Firmographics Explained: The 2026 B2B Targeting Guide
Firmographics are the demographics of companies — industry, size, revenue, location, structure. Here's how to collect them, score them, and turn them into a target list that actually converts.
TL;DR
- Firmographics are the demographics of companies: industry, employee count, revenue, location, ownership, and org structure. They answer "which accounts should we sell to?" before you ever touch a persona.
- The five core fields — industry, size, revenue, location, growth stage — explain most of the variance in win rate. Everything else is nice-to-have.
- Static firmographics decay fast. Headcount, funding, and tech stack change quarterly; a list you bought in January is meaningfully wrong by April.
- Firmographics alone don't rank accounts. Pair them with technographics and intent, then score. Firmographics filter; the other two prioritize.
- Enrichment is the bottleneck, not collection. You can pull a company list in minutes; getting verified contacts inside those companies is where most GTM teams stall.
What Are Firmographics?#
Firmographics describe organizations the way demographics describe people. Age, income, and zip code become founding year, annual revenue, and headquarters location. The term dates back to 1980s industrial marketing research and stuck because B2B buying is a company-level decision long before it's an individual one.
Think of it like real estate. Demographics tell you who lives in a house; firmographics tell you the house itself — square footage, neighborhood, year built, whether it's owner-occupied. If you sell commercial roofing, you filter on the building before you care about the resident.
In practice, a firmographic profile is a row of structured fields attached to a company record in your CRM. Here's the working set most revenue teams standardize on:
- Industry / vertical — NAICS, SIC, or a modern taxonomy like G2 categories. The single strongest predictor of fit for most B2B products.
- Company size — headcount bands (1-10, 11-50, 51-200, 201-1000, 1000+). Drives seat-based pricing, buying committee size, and sales cycle length.
- Revenue — annual recurring or reported revenue. Harder to source accurately for private companies; treat public figures as ground truth and estimates as ranges.
- Location — HQ country, state, and metro. Governs data residency rules, language, currency, and territory assignment.
- Growth stage and ownership — bootstrapped, VC-backed (and which round), PE-owned, public, or subsidiary. Funding events are the highest-signal firmographic trigger in outbound.
- Org structure — number of locations, subsidiaries, parent-child relationships. Critical if you sell into enterprise where a "logo" is really twelve buying units.
Why Do Firmographics Matter More Than Persona Data?#
Because the wrong account can't be saved by the right persona. A perfectly targeted VP of Engineering at a 4-person agency will never buy your $60k enterprise platform, no matter how good your sequence is.
Firmographics do three jobs your persona work can't:
They set your total addressable market honestly. When you filter on industry + size + geography, you get a number. If that number is 800 accounts and your quota assumes 4,000, you have a strategy problem, not an execution problem. Most teams discover this only after a quarter of missed pipeline.
They make territory and routing defensible. Splitting accounts by headcount band and region is boring and it works. Splitting by "gut feel about vertical" produces reps arguing over the same logos.
They compress your messaging. A 50-person Series A SaaS company and a 5,000-person manufacturer have different pain, budget cycles, and procurement processes. Segmenting by firmographics is what lets you write two good emails instead of one generic one.
The failure mode to watch: teams treat firmographics as a one-time list-building exercise, load 20,000 rows into the CRM, and never refresh them. Six months later half the headcounts are wrong, 12% of the domains have changed hands, and reps stop trusting the fields entirely. Once reps distrust a field, they stop filtering on it, and your segmentation collapses back into "email everyone."
Firmographics vs Technographics vs Intent Data: What's the Difference?#
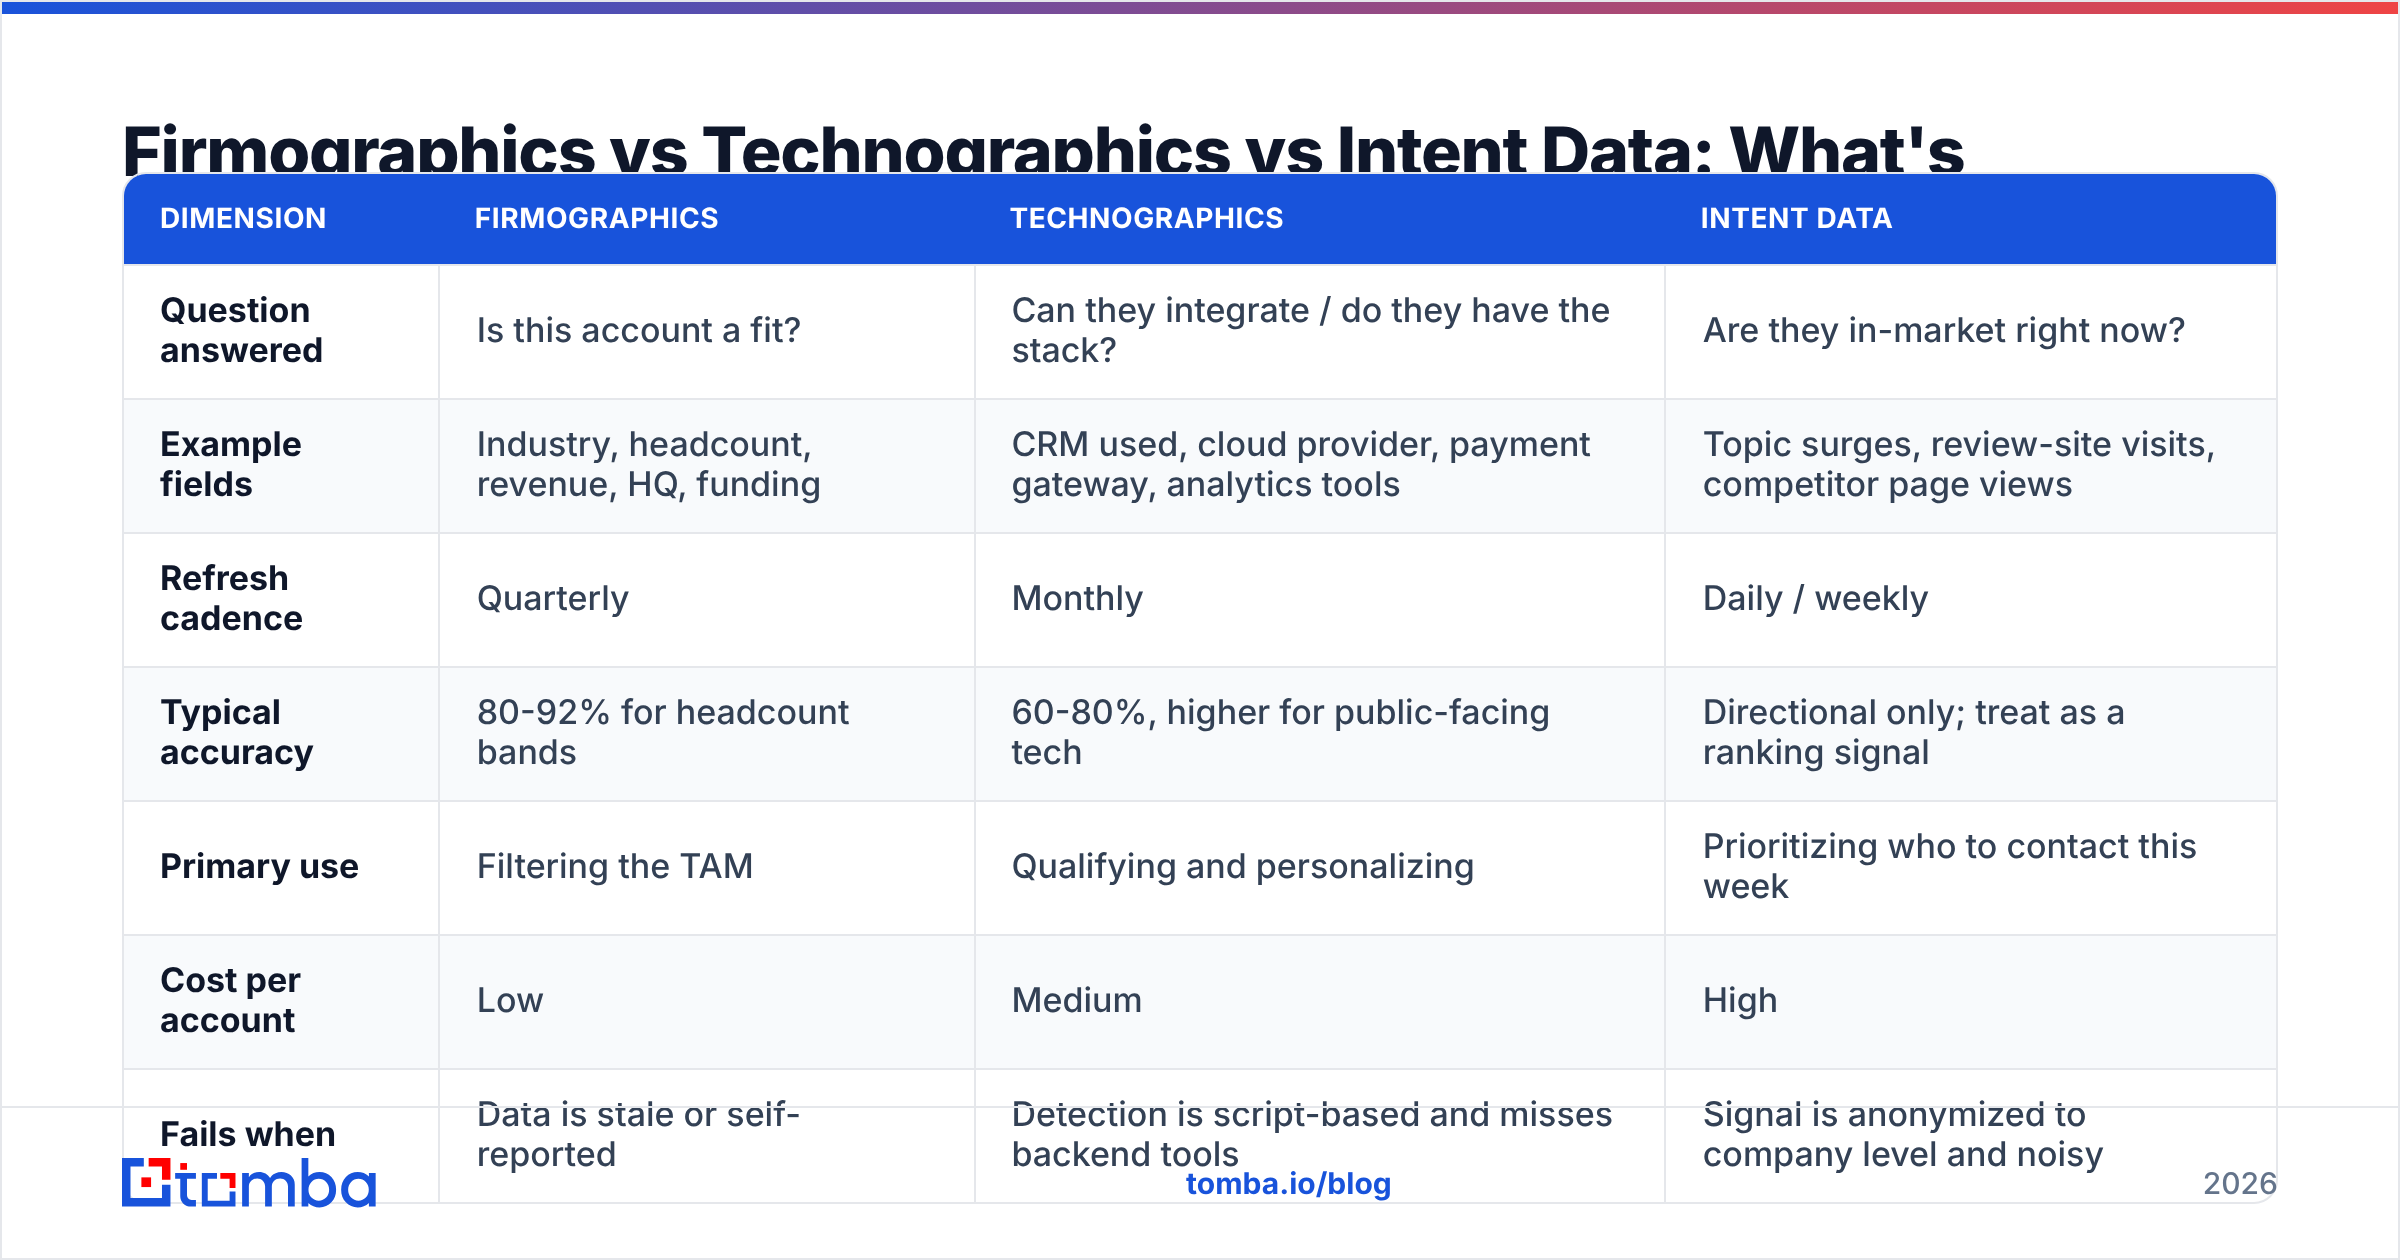
These three layers get conflated constantly, usually by vendors selling all three under one label. They answer different questions and should be used in a specific order.
| Dimension | Firmographics | Technographics | Intent Data |
|---|---|---|---|
| Question answered | Is this account a fit? | Can they integrate / do they have the stack? | Are they in-market right now? |
| Example fields | Industry, headcount, revenue, HQ, funding | CRM used, cloud provider, payment gateway, analytics tools | Topic surges, review-site visits, competitor page views |
| Refresh cadence | Quarterly | Monthly | Daily / weekly |
| Typical accuracy | 80-92% for headcount bands | 60-80%, higher for public-facing tech | Directional only; treat as a ranking signal |
| Primary use | Filtering the TAM | Qualifying and personalizing | Prioritizing who to contact this week |
| Cost per account | Low | Medium | High |
| Fails when | Data is stale or self-reported | Detection is script-based and misses backend tools | Signal is anonymized to company level and noisy |
Use them as a funnel, not a menu. Firmographics eliminate 90% of the market. Technographics qualify the survivors. Intent tells you which of the qualified accounts to call on Tuesday. Running intent first means paying premium prices for signals from companies you could never close.
Where Do You Actually Get Firmographic Data?#
Five sources, ranked by how much of your list they realistically cover.
Public registries and filings. Company registries, SEC EDGAR for US public companies, and equivalents elsewhere. Authoritative, free, and painfully incomplete for private SMBs. Good for revenue and ownership on the enterprise end.
Website and domain signals. The company's own site tells you industry, locations, careers page headcount hints, and often customer logos. This is where a domain search earns its keep — it maps a domain to its people and email pattern in one call, which is the bridge from a firmographic record to an actual contactable person.
Professional network profiles. Headcount and growth trends are more current here than anywhere else, because employees update their own records. Employee-count-over-time is one of the few genuinely reliable growth signals available at scale.
Commercial B2B databases. Aggregators that blend the above and sell it back as clean rows. Fast, but check the refresh policy — some vendors resell snapshots that are 18 months old. Where the data comes from should be a question you ask every provider before you sign.
Your own CRM and product telemetry. The most underrated source. Your closed-won accounts already contain the firmographic profile of a good customer. Export them, find the shared attributes, and you've built an ICP from evidence rather than a whiteboard session.
For most teams the honest answer is a blend: a commercial database for breadth, plus enrichment on your own records for depth. Vendors like BookYourData and other established list providers cover the breadth side well, particularly for verticals where registry data is thin. What you still need to solve separately is the contact layer — a firmographic row without a verified email is a research project, not a pipeline.
How Do You Build a Firmographic Segmentation That Works?#
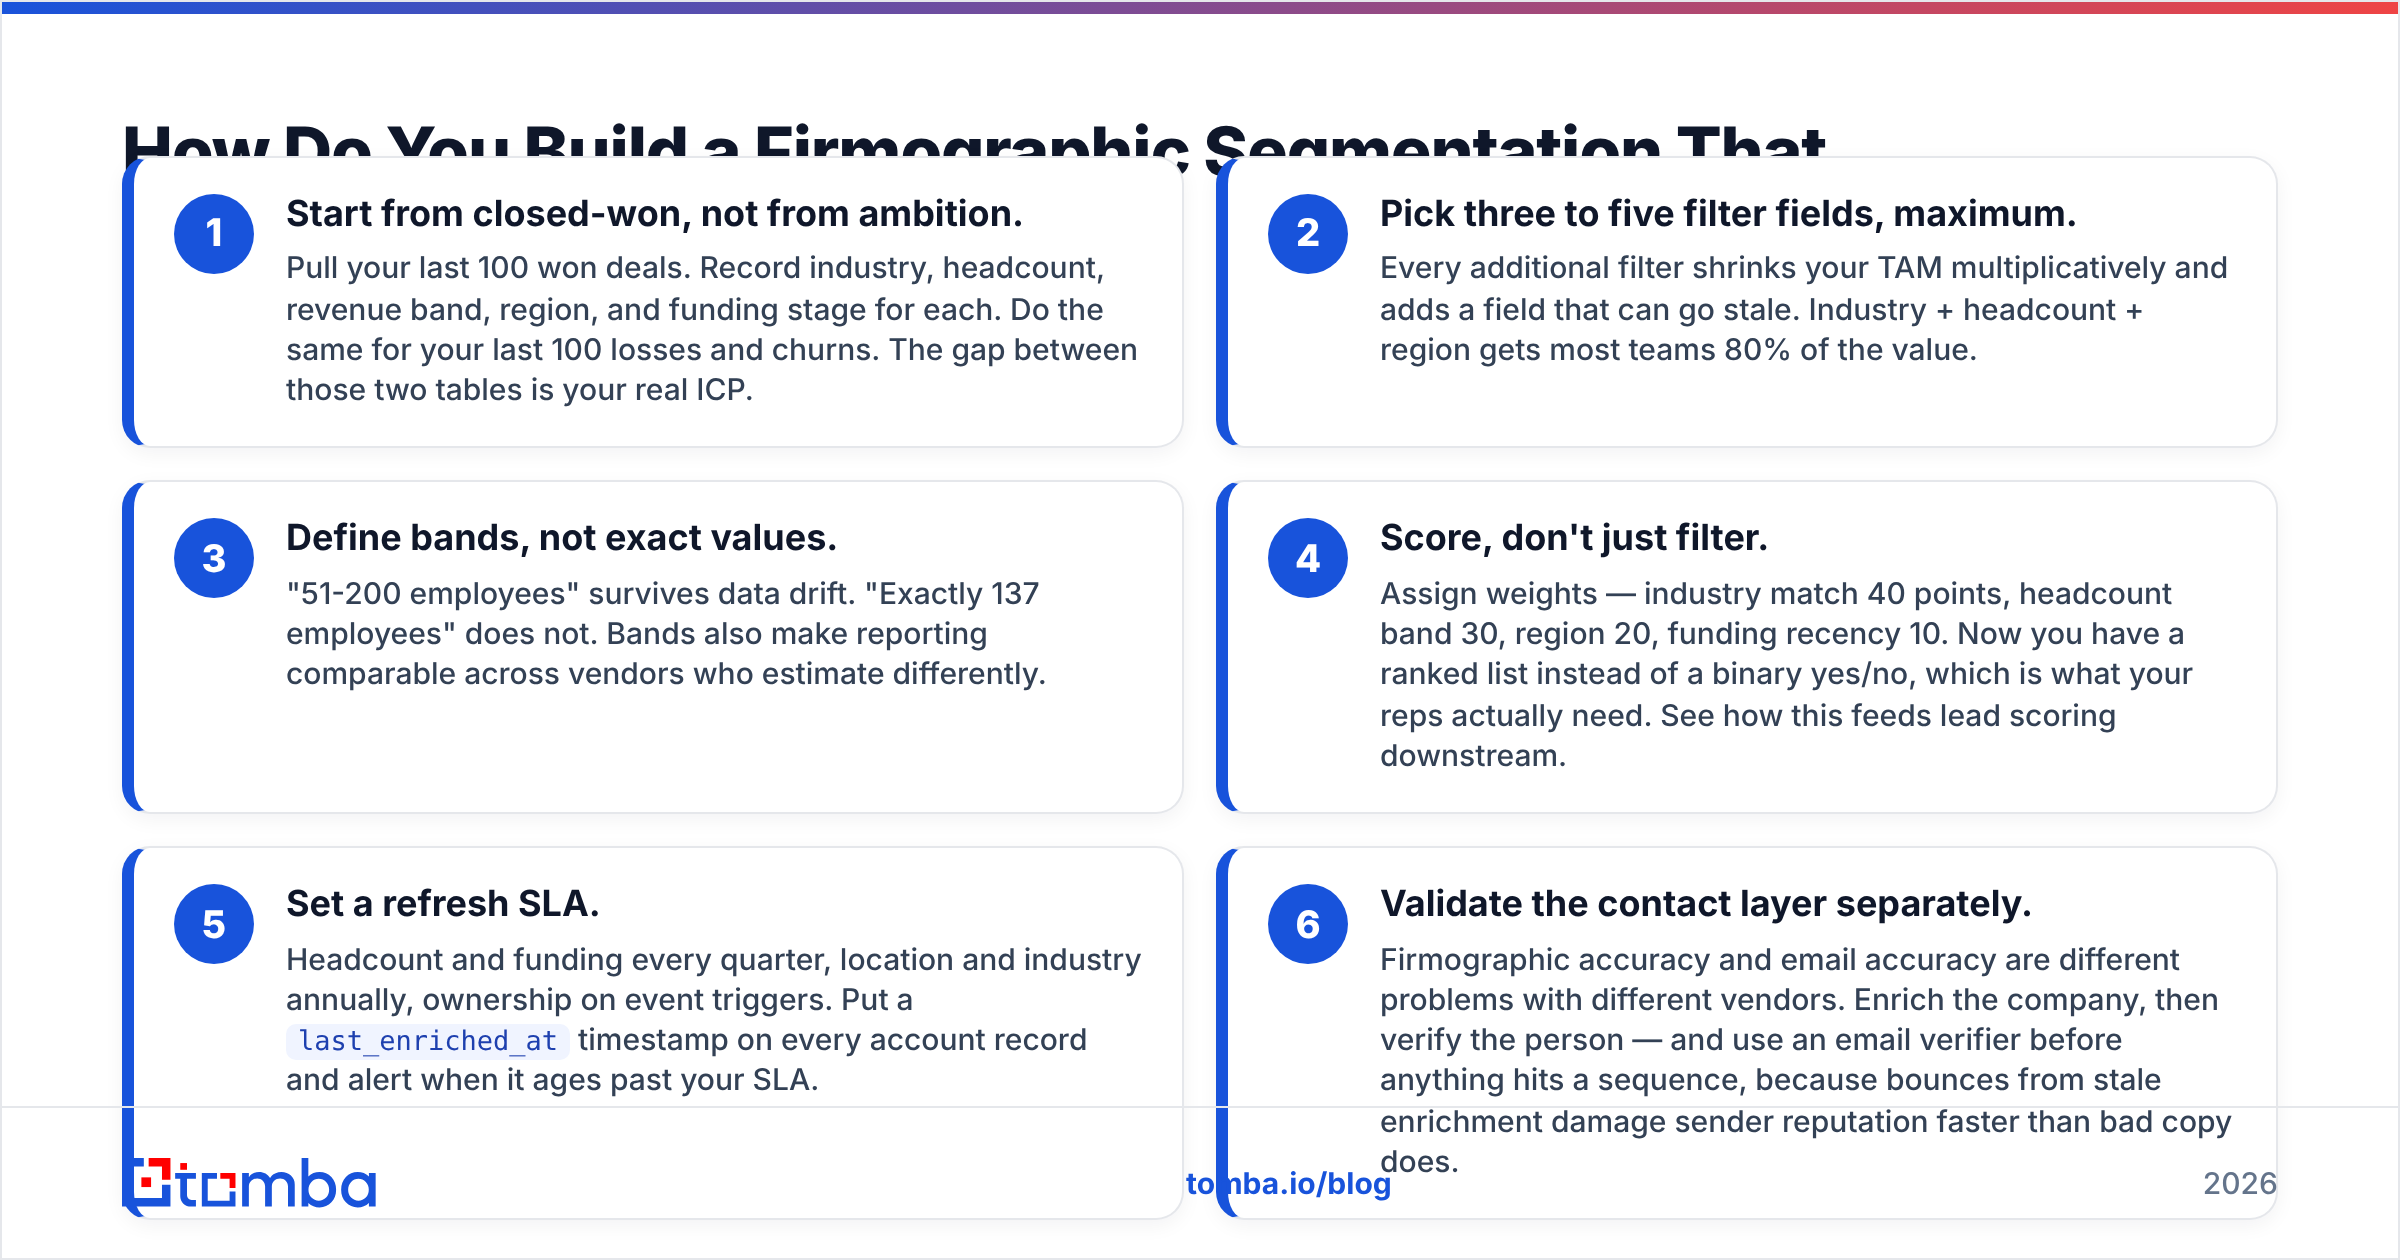
Six steps, in order. Skipping step one is the most common mistake.
- Start from closed-won, not from ambition. Pull your last 100 won deals. Record industry, headcount, revenue band, region, and funding stage for each. Do the same for your last 100 losses and churns. The gap between those two tables is your real ICP.
- Pick three to five filter fields, maximum. Every additional filter shrinks your TAM multiplicatively and adds a field that can go stale. Industry + headcount + region gets most teams 80% of the value.
- Define bands, not exact values. "51-200 employees" survives data drift. "Exactly 137 employees" does not. Bands also make reporting comparable across vendors who estimate differently.
- Score, don't just filter. Assign weights — industry match 40 points, headcount band 30, region 20, funding recency 10. Now you have a ranked list instead of a binary yes/no, which is what your reps actually need. See how this feeds lead scoring downstream.
- Set a refresh SLA. Headcount and funding every quarter, location and industry annually, ownership on event triggers. Put a
last_enriched_attimestamp on every account record and alert when it ages past your SLA. - Validate the contact layer separately. Firmographic accuracy and email accuracy are different problems with different vendors. Enrich the company, then verify the person — and use an email verifier before anything hits a sequence, because bounces from stale enrichment damage sender reputation faster than bad copy does.

How Accurate Is Firmographic Data, Really?#
Less accurate than vendor marketing suggests, and the error rate is not uniform across fields.
Headcount bands from professional-network-derived sources land in the 85-92% range for companies above 50 employees, and drop sharply below that — small companies churn staff faster and update profiles less. Revenue estimates for private companies are the weakest field on the sheet; treat any private-company revenue number without a filing behind it as an order-of-magnitude estimate, not a figure. Industry classification is deceptively noisy: a company that describes itself as "AI infrastructure" may be tagged as software, IT services, or data processing depending on the taxonomy, and those three tags route to three different reps.
Location is usually right but frequently unhelpful — a registered HQ in Delaware tells you nothing about where the buying team sits.
A practical accuracy protocol:
- Sample 50 records per vendor and manually verify against the company's own site and filings before you commit to an annual contract.
- Track field-level accuracy, not a single vendor score. You may find a vendor is excellent on headcount and useless on revenue, which is fine if you only filter on headcount.
- Measure bounce rate as your downstream accuracy proxy. If enrichment is stale, contact data derived from it bounces, and bounce rate is the number you can actually see in your ESP.
- Re-verify before every campaign, not on a fixed calendar. Campaign-triggered verification catches drift the calendar misses.
Independent review platforms like G2 and Capterra are useful for surfacing complaints about data freshness that never appear in vendor benchmarks — read the two-star reviews specifically, since those are where refresh-rate problems get documented.
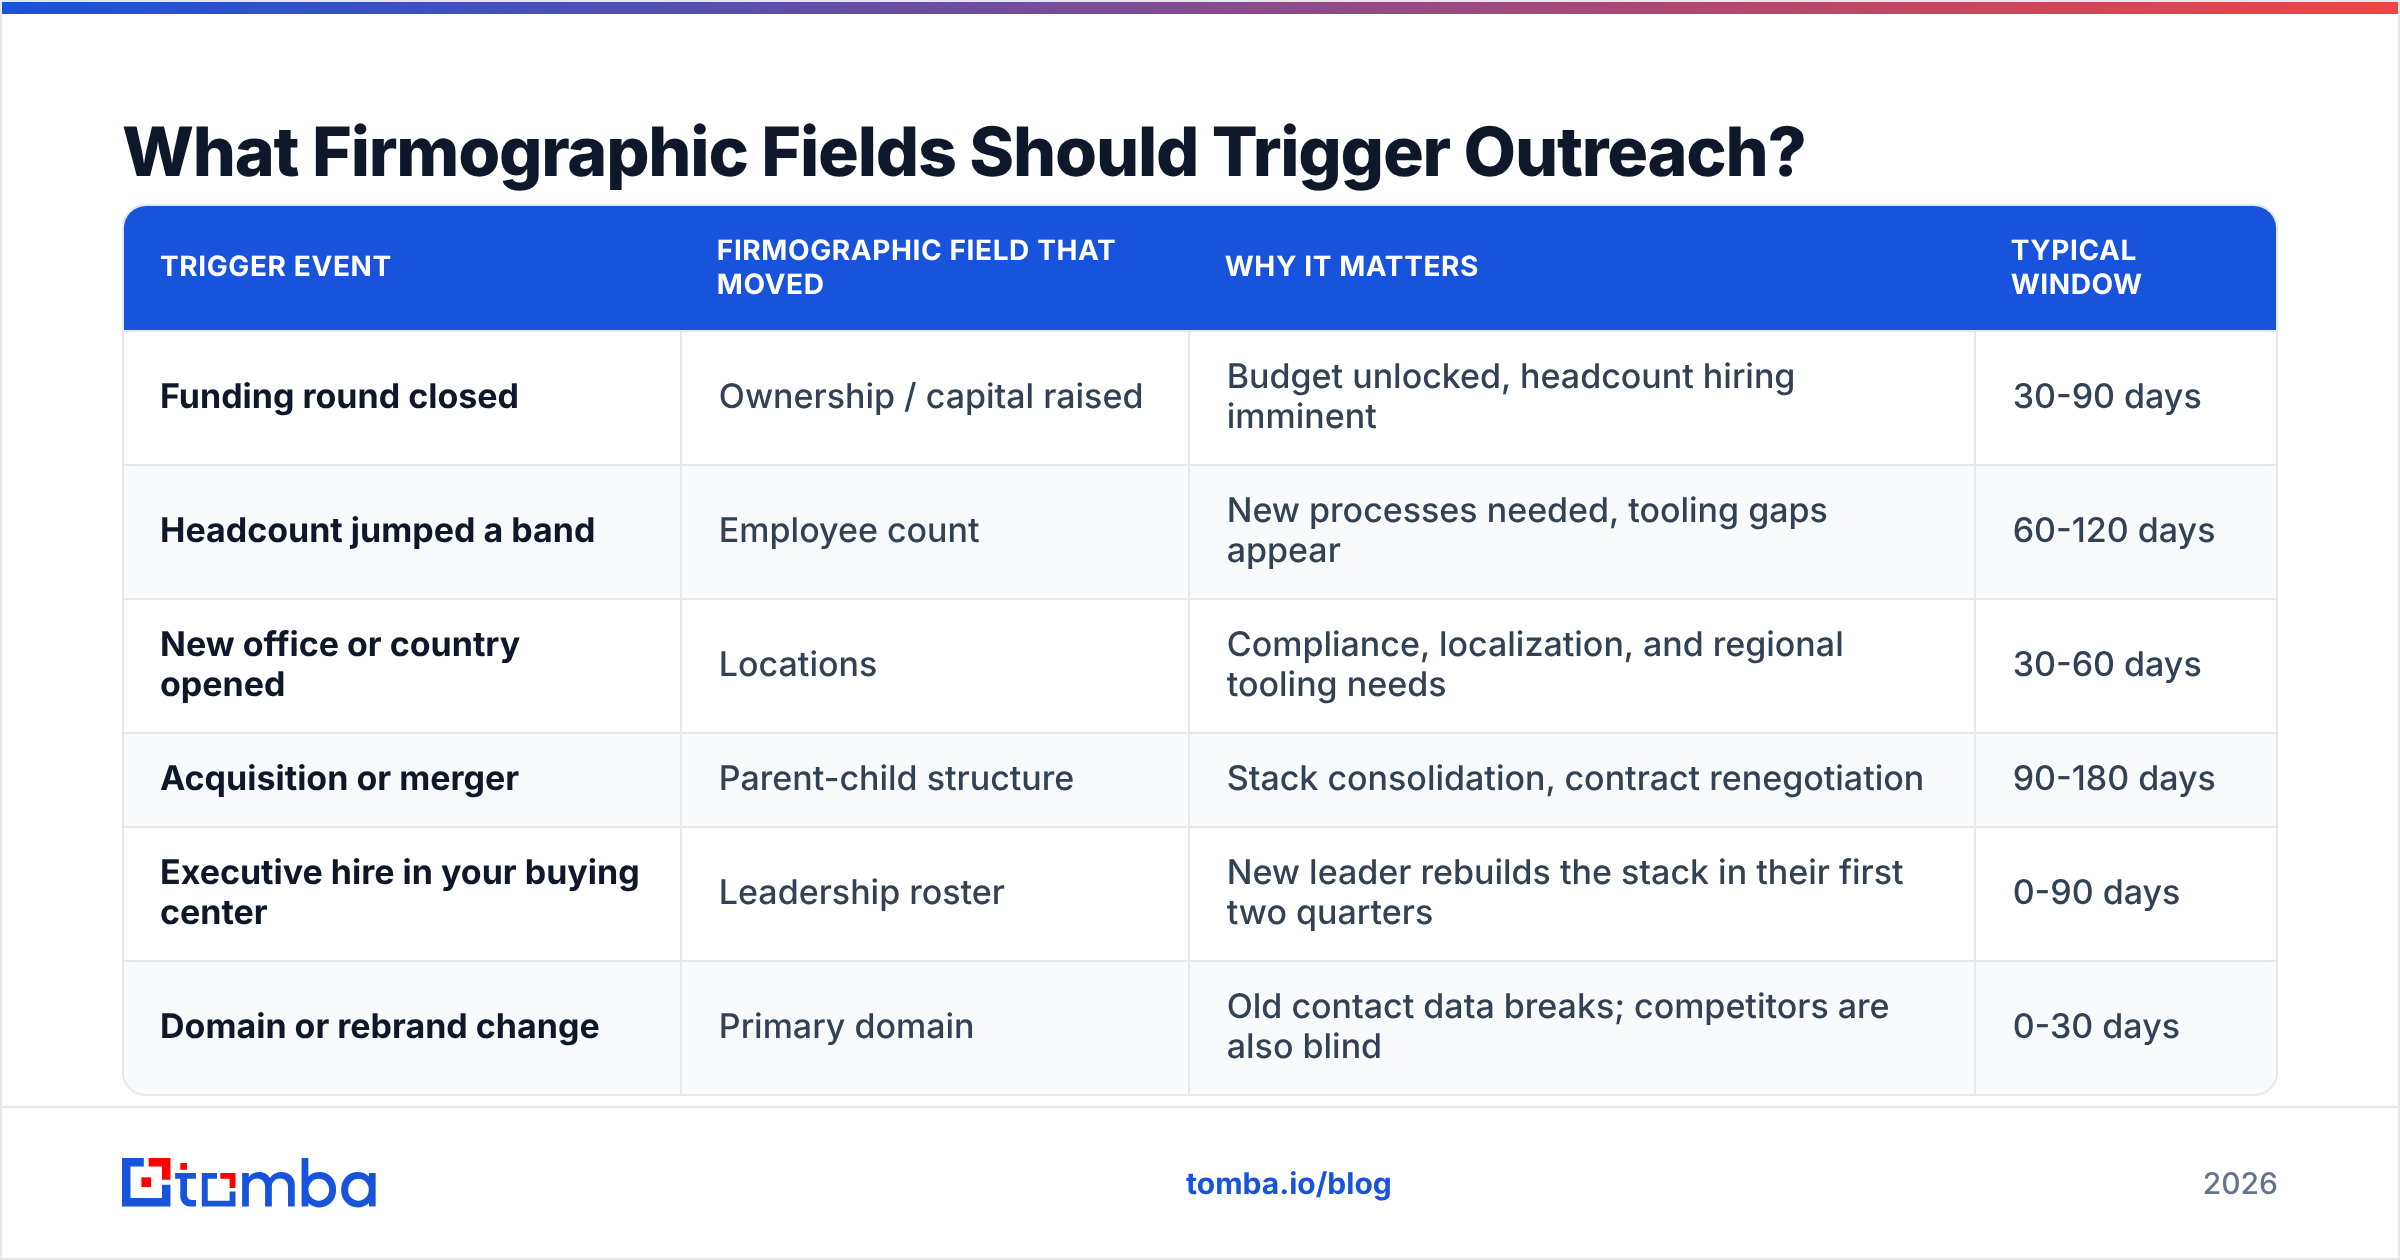
What Firmographic Fields Should Trigger Outreach?#
Static fields tell you who to target. Changes in those fields tell you when.
| Trigger event | Firmographic field that moved | Why it matters | Typical window |
|---|---|---|---|
| Funding round closed | Ownership / capital raised | Budget unlocked, headcount hiring imminent | 30-90 days |
| Headcount jumped a band | Employee count | New processes needed, tooling gaps appear | 60-120 days |
| New office or country opened | Locations | Compliance, localization, and regional tooling needs | 30-60 days |
| Acquisition or merger | Parent-child structure | Stack consolidation, contract renegotiation | 90-180 days |
| Executive hire in your buying center | Leadership roster | New leader rebuilds the stack in their first two quarters | 0-90 days |
| Domain or rebrand change | Primary domain | Old contact data breaks; competitors are also blind | 0-30 days |
The domain-change trigger is the most underused. When a company rebrands, every list in the market goes stale simultaneously, including your competitors'. Whoever re-enriches first gets a clean inbox. This is a good use case for a bulk email finder run against the new domain, since patterns often change alongside the rebrand.
How Do Firmographics Fit Into RevOps and ABM?#
Firmographics are the join key. They're the field set that lets marketing, sales, and customer success talk about the same account without arguing over definitions.
In revenue operations terms, firmographic fields should be system-of-record data owned by ops, not free-text fields reps edit. Lock them. Enrich them on a schedule. Version them so you can answer "what did we think this account's headcount was when we scored it?"
For account-based marketing, firmographics define the tier structure. Tier 1 accounts get one-to-one treatment because they clear a revenue and headcount threshold. Tier 2 gets one-to-few by industry cluster. Tier 3 gets programmatic. Without firmographic bands you have no principled way to allocate the budget, and ABM degenerates into "the accounts the CRO recognizes."
Analyst coverage from firms like Forrester has consistently placed account-data quality — not creative or channel mix — as the top constraint on ABM program performance. That matches what most operators see: the program isn't underperforming because the ads are bad, it's underperforming because 30% of the target list was never a fit.
One structural warning: don't let firmographic segmentation ossify. Markets move. The 200-500 employee manufacturing segment that carried your 2024 number may be flat in 2026 while a segment you excluded is growing 40%. Re-run the closed-won analysis every two quarters and let the data reopen segments you closed.
Turn Firmographic Rows Into Contactable Pipeline#
A firmographic profile is only worth what you can do with it, and what you can do with it is reach someone. That last mile — company record to verified inbox — is where most enrichment stacks quietly fail.
Tomba Email Finder closes that gap. Feed it a domain from your firmographic list and it returns the people, their roles, and verified professional email addresses, with the pattern detection that makes bulk runs predictable rather than a guessing game. Pair it with the email verifier before you launch and your bounce rate stops being a symptom of stale enrichment.
Pricing is straightforward: a free tier with 25 searches per month to test your own list against, Starter at $49/mo, Growth at $99/mo, Pro at $249/mo, and custom Enterprise terms. Full Tomba pricing is public, and the Tomba API means you can wire enrichment directly into the refresh SLA from step five instead of doing it by hand every quarter.
Build the segmentation from evidence, refresh it on a schedule, and verify the contact layer separately from the company layer. That's the whole discipline.
Related guides#
Ready to find emails that actually work?
Join 150,000+ professionals who stopped guessing and started sending. Free credits on signup — no credit card required.
Get the Tomba newsletter
Practical outbound tactics and product updates — once every two weeks.
About the author