Forecast Accuracy Formula: How to Measure Sales Forecasts
Most revenue teams report one forecast accuracy number and call it a day. Here are the four formulas that actually matter, when each one lies to you, and how to hit 90% accuracy without gaming the pipeline.
TL;DR
- The basic forecast accuracy formula is
1 - |Actual - Forecast| / Actual, expressed as a percentage. Everything else is a variation on that skeleton. - One number is not enough. Run accuracy (how close), bias (which direction you're wrong), and MAPE or WAPE (error normalized across deals) together, because each hides a different failure.
- MAPE breaks badly on small denominators — a $2,000 deal forecast at $6,000 produces a 200% error that swamps your whole report. Use WAPE when deal sizes vary.
- Forecast accuracy below 80% is almost never a spreadsheet problem. It's a data problem: stale contacts, ghost pipeline, and stages that mean different things to different reps.
- Measure at the segment level (by rep, by stage, by deal size band) or you'll fix the wrong thing.
What is the forecast accuracy formula?#
The core forecast accuracy formula is this:
Forecast Accuracy % = (1 - |Actual - Forecast| / Actual) × 100Plain version: take the gap between what you predicted and what actually closed, divide by what actually closed, and subtract that from 100%.
Think of it like a weather forecast. If the forecaster says 20 inches of rain and 18 inches fall, the miss is 2 inches on a base of 18 — about 11% off, so roughly 89% accurate. Nobody cares whether the model was Bayesian. They care how wet they got.
Worked example for a quarter:
- Forecast: $1,200,000
- Actual closed-won: $1,050,000
- Absolute error: $150,000
- $150,000 / $1,050,000 = 0.1428
- Accuracy: (1 - 0.1428) × 100 = 85.7%
Note the denominator: actual, not forecast. This matters more than people expect. Dividing by forecast makes an over-forecast look better than it is, and most CRO dashboards quietly do exactly that because it flatters the number. Pick one convention, write it down, and never switch it mid-year.
Which forecast accuracy formulas should you actually run?#
Four. Each answers a different question, and running only the first one is how teams end up "90% accurate" while missing three quarters in a row.
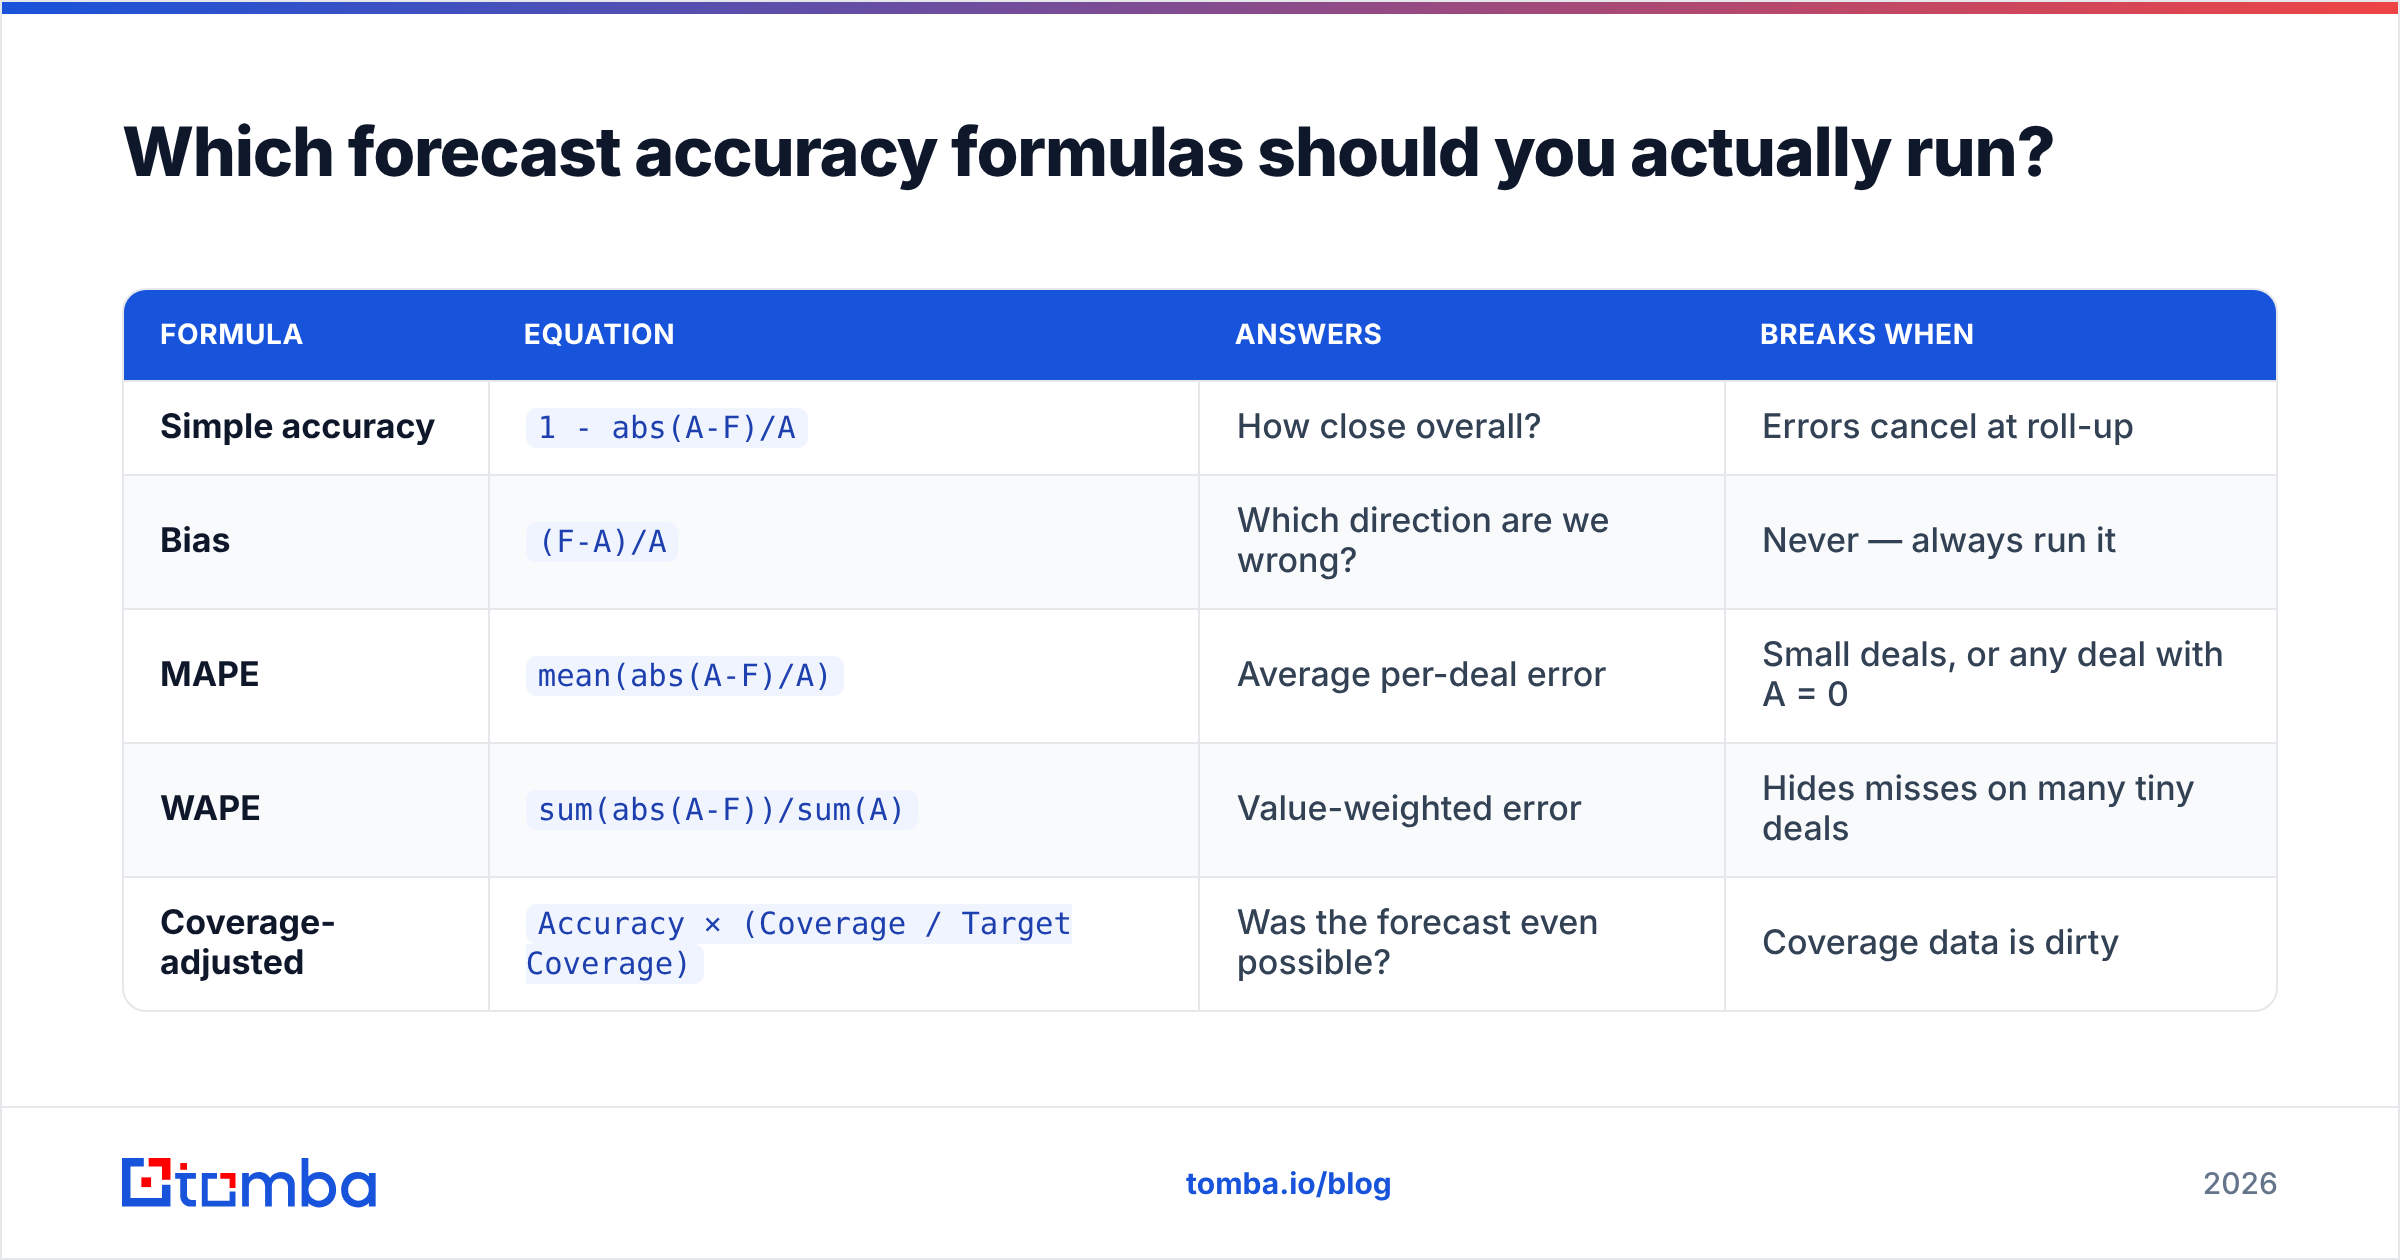
- Simple accuracy —
1 - |A - F| / A. Answers: how close were we in aggregate? Best for board reporting. Worst for diagnosis, because over- and under-forecasts cancel out at the roll-up level. - Forecast bias —
(F - A) / A. Keeps the sign. A persistent +12% means your team systematically inflates. A persistent -8% means sandbagging. Bias is the single most actionable number in this list and the one most teams never compute. - MAPE (Mean Absolute Percentage Error) — average of
|A - F| / Aacross every individual deal or period. Answers: how wrong are we per unit, on average? Punishes small-deal misses brutally. - WAPE (Weighted Absolute Percentage Error) —
Σ|A - F| / ΣA. Same idea as MAPE but weighted by deal value, so a $500K miss matters more than a $5K miss. This is the right default for most B2B pipelines. - Coverage-adjusted accuracy — accuracy scored against your pipeline coverage ratio. If you forecast $1M on $2M of pipeline (2x coverage) and your historical win rate is 22%, the forecast was fiction before the quarter started.
| Formula | Equation | Answers | Breaks when |
|---|---|---|---|
| Simple accuracy | 1 - abs(A-F)/A |
How close overall? | Errors cancel at roll-up |
| Bias | (F-A)/A |
Which direction are we wrong? | Never — always run it |
| MAPE | mean(abs(A-F)/A) |
Average per-deal error | Small deals, or any deal with A = 0 |
| WAPE | sum(abs(A-F))/sum(A) |
Value-weighted error | Hides misses on many tiny deals |
| Coverage-adjusted | Accuracy × (Coverage / Target Coverage) |
Was the forecast even possible? | Coverage data is dirty |
Why does MAPE fail on B2B sales pipelines?#
Because of division by small numbers, and because closed-lost deals produce an actual of zero.
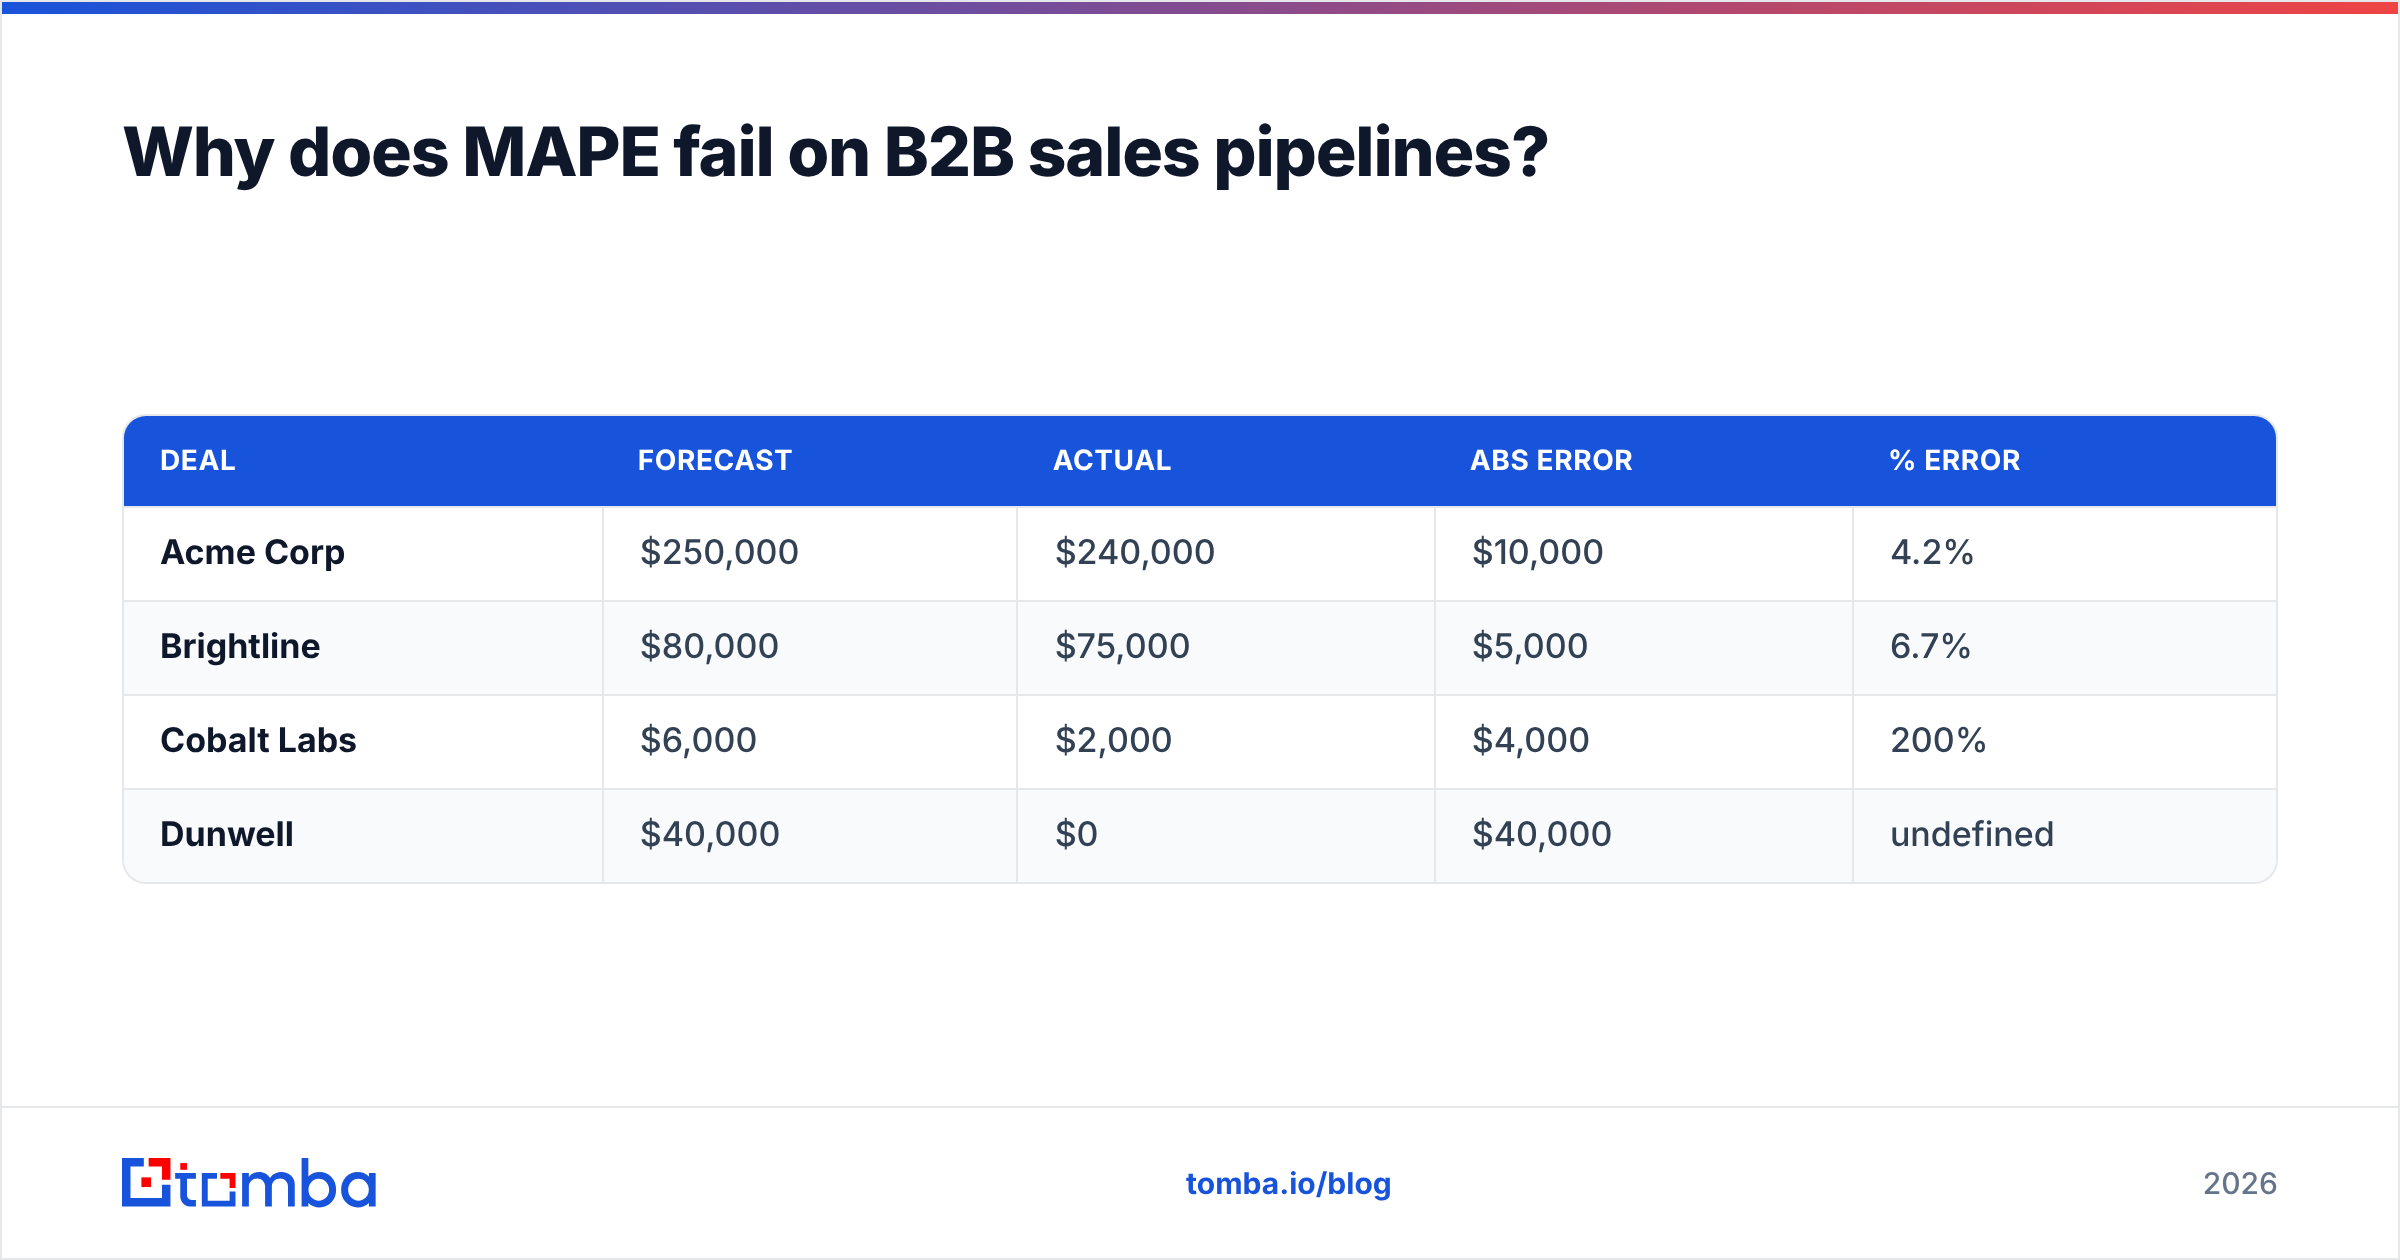
Take a rep with four deals:
| Deal | Forecast | Actual | Abs error | % error |
|---|---|---|---|---|
| Acme Corp | $250,000 | $240,000 | $10,000 | 4.2% |
| Brightline | $80,000 | $75,000 | $5,000 | 6.7% |
| Cobalt Labs | $6,000 | $2,000 | $4,000 | 200% |
| Dunwell | $40,000 | $0 | $40,000 | undefined |
MAPE on the first three deals is (4.2 + 6.7 + 200) / 3 = 70.3% error — implying the rep is catastrophically bad. But WAPE is ($10,000 + $5,000 + $4,000 + $40,000) / ($240,000 + $75,000 + $2,000 + $0) = 59,000 / 317,000 = 18.6% error, or 81.4% accurate. That's a much more honest picture of a rep who called two large deals within 7% and blew one small one.
Rule of thumb: if your average deal size varies by more than 5x across the pipeline, MAPE will mislead you. Use WAPE, and report MAPE only within tight deal-size bands.
The zero-actual problem has no clean fix inside MAPE. Standard practice is to either exclude closed-lost deals from MAPE (and report their count separately as a "phantom pipeline rate") or switch to sMAPE, which uses (|A-F|) / ((A+F)/2) as the denominator and caps at 200%. Most RevOps teams just use WAPE and move on. The forecasting literature on Wikipedia's MAPE entry walks through the asymmetry problem in detail if you want the math.
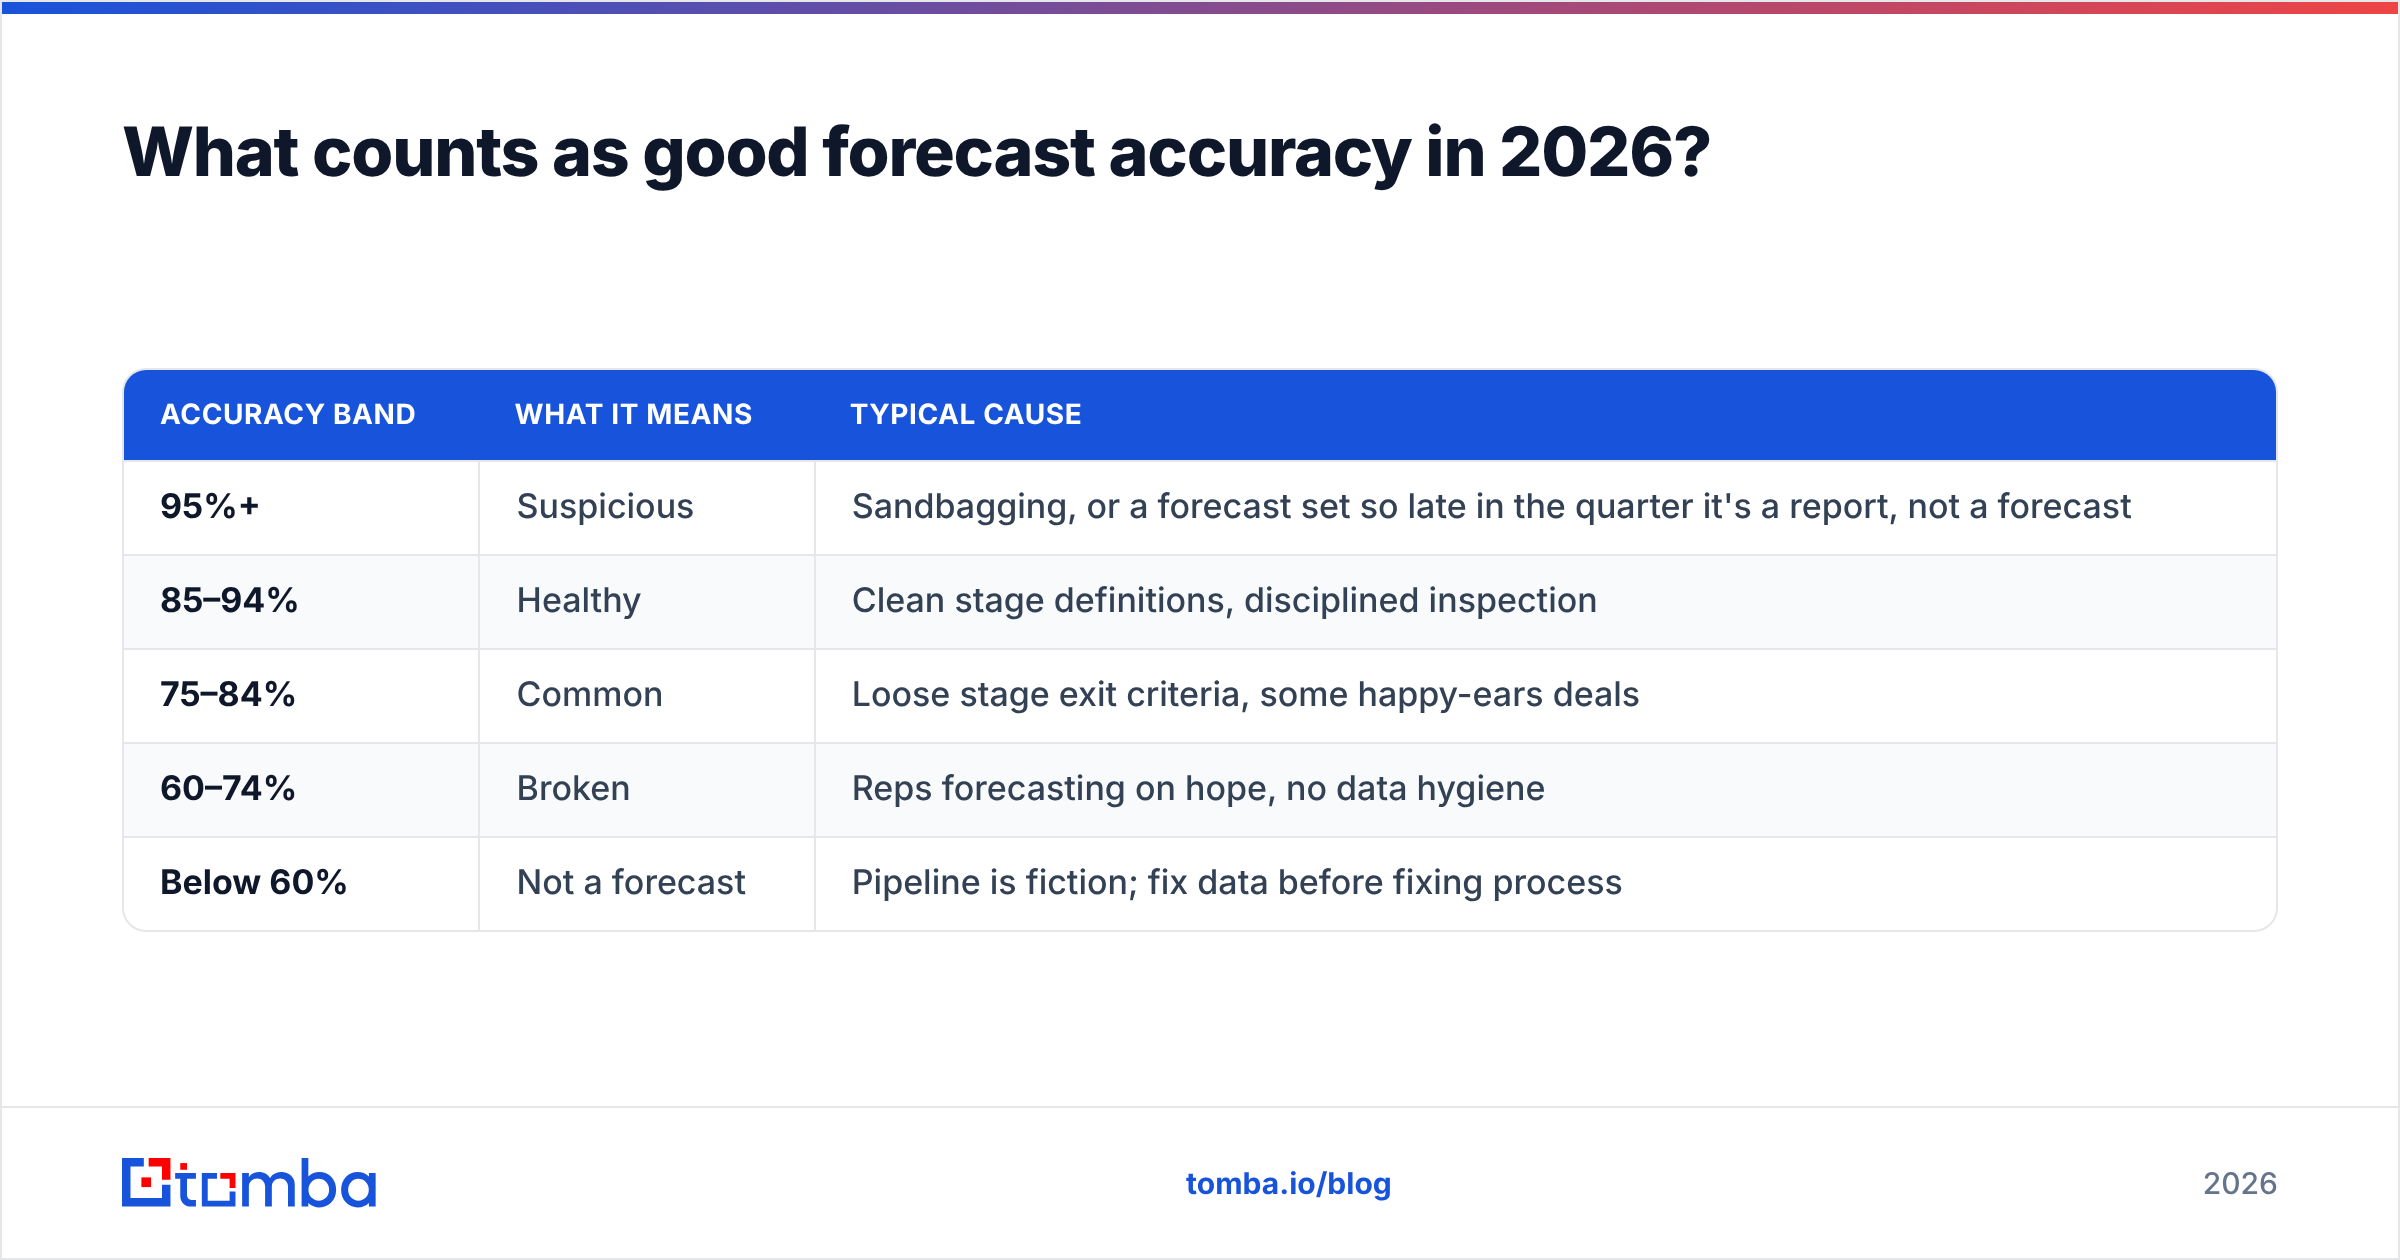
What counts as good forecast accuracy in 2026?#
Benchmarks, roughly, for B2B SaaS teams running a monthly or quarterly commit:
| Accuracy band | What it means | Typical cause |
|---|---|---|
| 95%+ | Suspicious | Sandbagging, or a forecast set so late in the quarter it's a report, not a forecast |
| 85–94% | Healthy | Clean stage definitions, disciplined inspection |
| 75–84% | Common | Loose stage exit criteria, some happy-ears deals |
| 60–74% | Broken | Reps forecasting on hope, no data hygiene |
| Below 60% | Not a forecast | Pipeline is fiction; fix data before fixing process |
Two caveats. First, accuracy compresses as the quarter progresses — a week-1 forecast at 78% and a week-11 forecast at 78% are wildly different levels of skill. Always report accuracy by snapshot date, not just at close. Second, Gartner's sales research and vendor surveys consistently find that most teams overstate their own accuracy because they compare against a forecast that was revised mid-quarter. Freeze the forecast. Compare against the frozen number.
How do you actually improve forecast accuracy?#
Here's the uncomfortable part: the formula is never the bottleneck. Five levers, in the order they usually pay off.
- Freeze and snapshot. Write the forecast to an immutable table at a fixed cadence (week 1, week 6, week 11). Without snapshots you cannot compute bias, and without bias you cannot coach.
- Enforce exit criteria per stage. "Demo done" is not a stage. "Economic buyer identified, budget confirmed, mutual action plan signed" is. Ambiguous stages are the single biggest source of variance in your CRM.
- Kill ghost pipeline. Deals where the champion left, the email bounces, or nobody has replied in 45 days are not pipeline. They inflate coverage, inflate the forecast, and destroy accuracy in the final two weeks. Re-verify contact data on every deal older than one quarter with an email verifier — bounced champions are usually departed champions.
- Score bias per rep, not per team. Team bias averages to near-zero while one rep runs +30% and another runs -25%. You need the per-rep number to have a real conversation.
- Backfill missing contact coverage. Multi-threaded deals close at materially higher rates than single-threaded ones. If your average opportunity has 1.4 contacts attached, your forecast is a coin flip on one person's calendar. Use domain search to map the full buying committee before you commit a deal.
- Rebuild the model quarterly. Win rates drift. A stage-weighted forecast using last year's conversion rates is a confident wrong answer.
How does data quality change the forecast accuracy formula?#
It doesn't change the math. It changes whether the math means anything.
A forecast accuracy formula operates on two inputs: what you predicted and what happened. The "what you predicted" side is built on pipeline records — deal value, stage, contacts, close date. If 20% of those records reference contacts who no longer work at the account, your forecast has a 20% fictional base, and no amount of statistical sophistication recovers it.
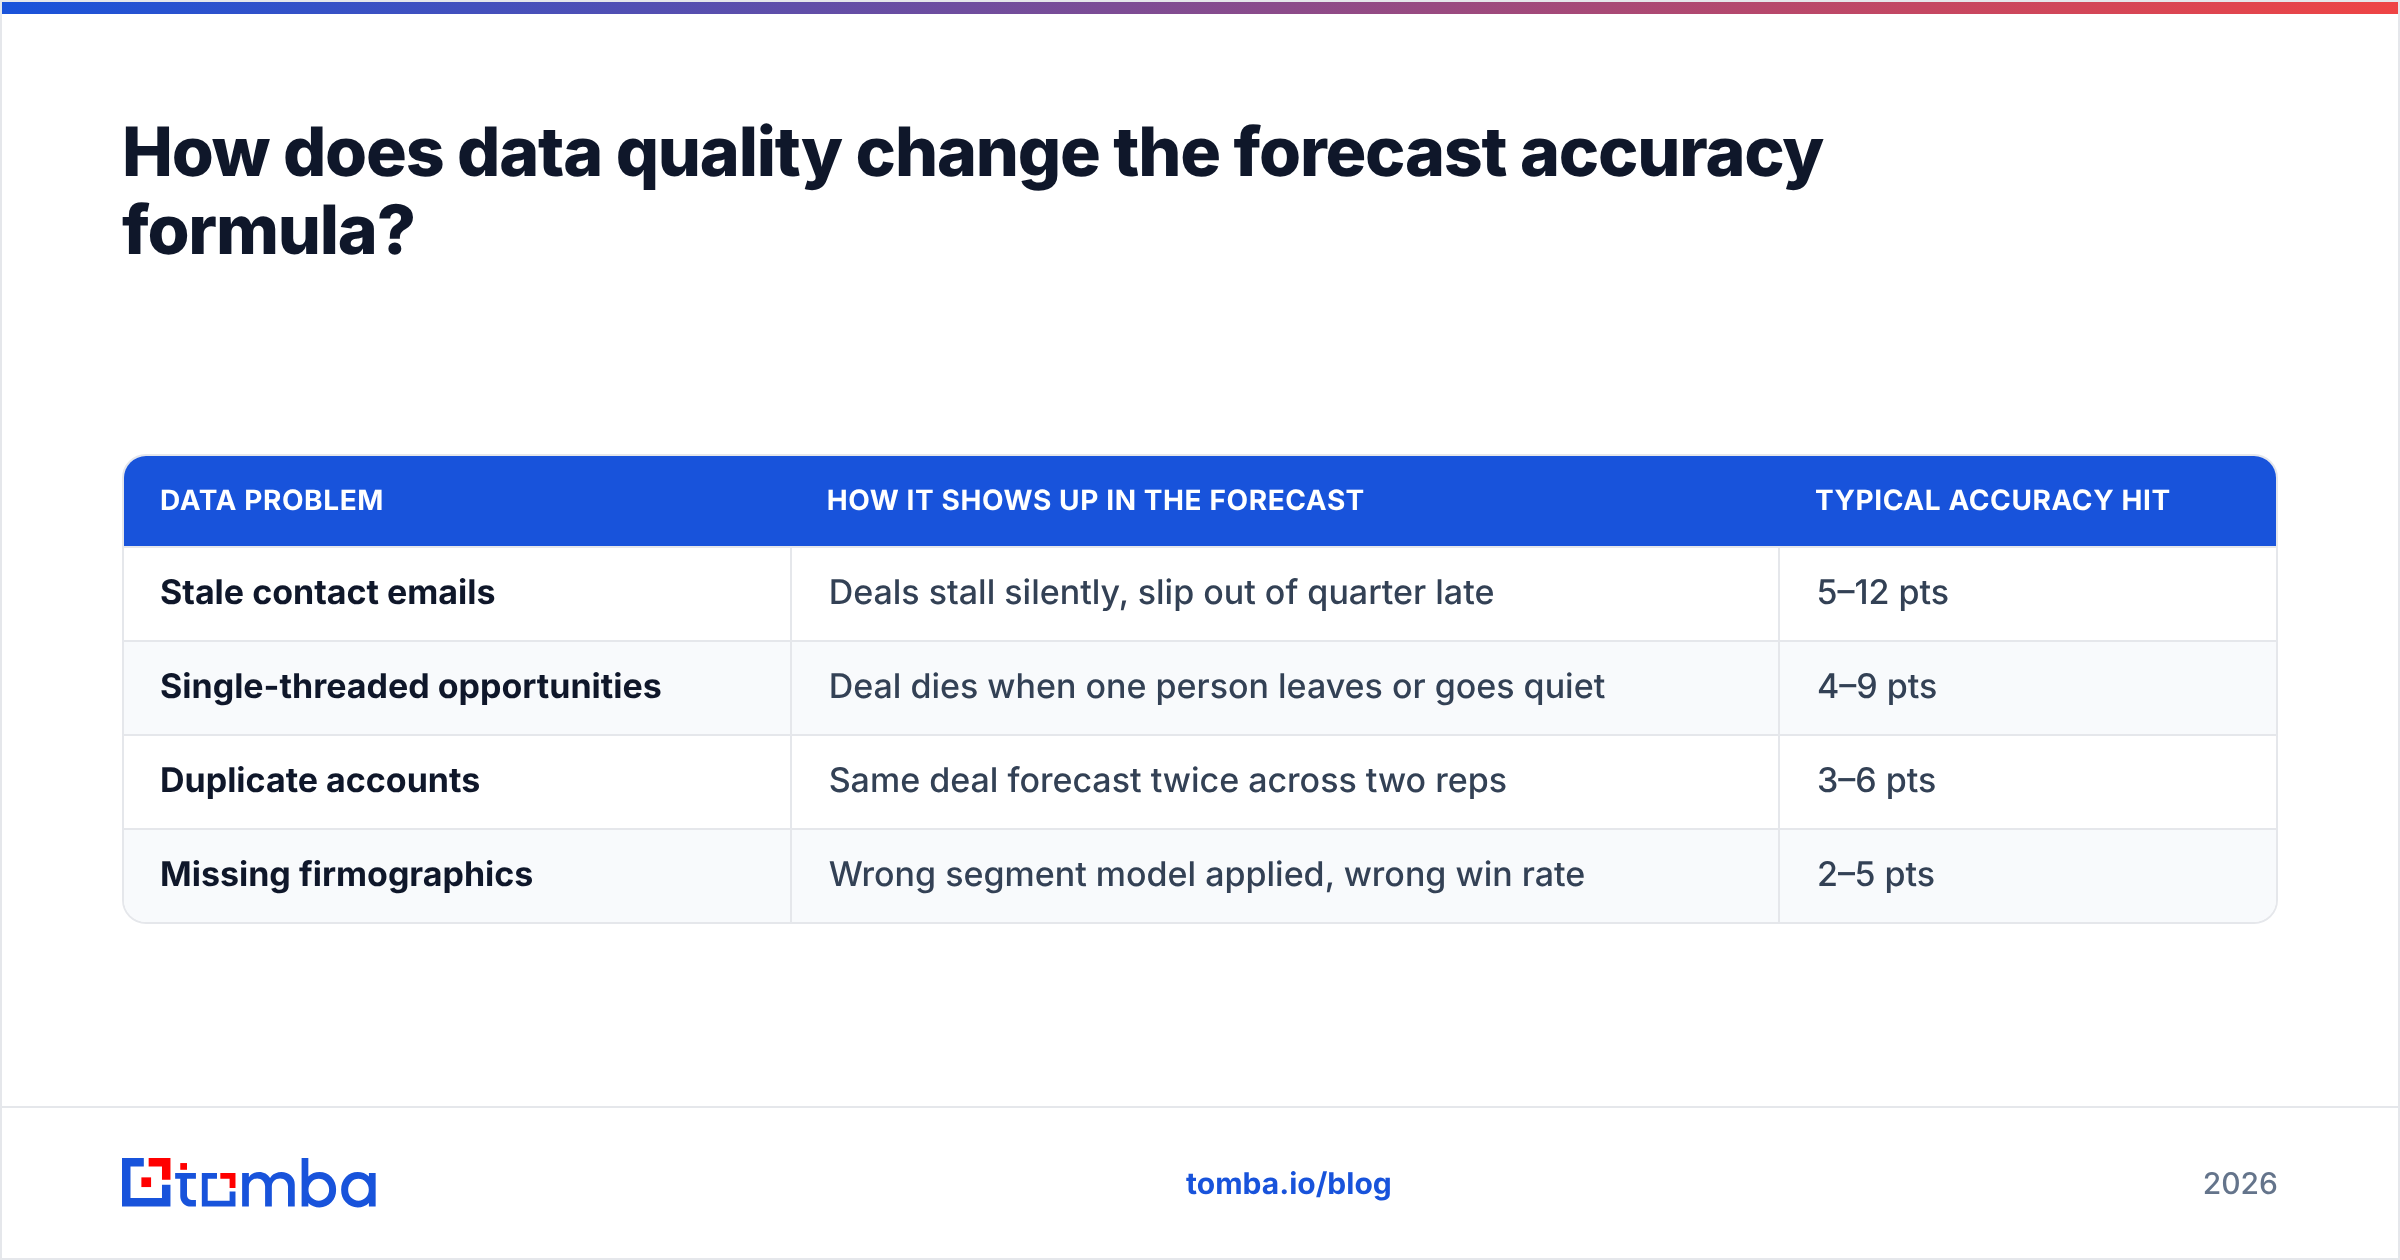
Concretely, three data problems map directly to accuracy loss:
| Data problem | How it shows up in the forecast | Typical accuracy hit |
|---|---|---|
| Stale contact emails | Deals stall silently, slip out of quarter late | 5–12 pts |
| Single-threaded opportunities | Deal dies when one person leaves or goes quiet | 4–9 pts |
| Duplicate accounts | Same deal forecast twice across two reps | 3–6 pts |
| Missing firmographics | Wrong segment model applied, wrong win rate | 2–5 pts |
The remedy is boring and it works: run a quarterly hygiene pass. Re-verify every contact on open pipeline, dedupe accounts, and enrich missing fields so your segment models apply the right historical win rate. Teams that do this before touching their forecasting model typically recover 8–15 points of accuracy without changing a single formula. A bulk email finder makes the re-verification pass a batch job instead of a two-week manual project, and data enrichment fills the firmographic gaps that break segment-level models.
For the process side of hygiene — who owns it, what cadence, what gets archived — HubSpot's CRM data management guidance is a reasonable baseline to adapt.
How do you build a forecast accuracy report that people read?#
Keep it to one page with four blocks.
Block 1 — Headline. Simple accuracy for the quarter, plus the same number for the prior four quarters. Trend beats absolute value.
Block 2 — Bias. Signed bias for the team and per rep, sorted. This is where coaching conversations start. Anyone consistently outside ±10% needs a different forecasting method, not a pep talk.
Block 3 — Accuracy by snapshot. Week-1, week-6, week-11 accuracy plotted together. A flat line means your team learns nothing during the quarter. A steep improvement curve is healthy.
Block 4 — Error attribution. Where did the miss come from? Break the total dollar error into slipped (moved to next quarter), lost (closed-lost), shrunk (won at lower value), and unforecast (won but never in the commit). Unforecast revenue above 15% means your reps don't trust the process and are hiding deals.
That last breakdown is the one that changes behavior. "We were 82% accurate" produces nodding. "We were 82% accurate and $340,000 of the miss was deals that slipped because the champion never replied after week 3" produces action.
Frequently asked questions#
Should I use the forecast or the actual as the denominator? Actual. Dividing by forecast lets an over-forecast score better than an under-forecast of the same absolute size. If your BI tool defaults to forecast-as-denominator, change it and re-baseline your history.
How often should I measure? Weekly snapshots, monthly reporting, quarterly model rebuilds. Weekly is enough granularity to see slippage patterns without turning forecasting into a full-time job.
Does AI forecasting fix this? Partially. Models built on activity data catch deals that reps overrate, and they're genuinely better at close-date prediction than stage-weighted averages. They don't fix bad contact data — they learn from it and confidently reproduce it. Clean the inputs first.
What about new products with no history? Use bottom-up capacity forecasting (reps × meetings × conversion) rather than pipeline-weighted forecasting until you have two full sales cycles of history. Score accuracy anyway; the error bars are the point.
Is a single accuracy target per team fair? No. Enterprise deals with 9-month cycles and transactional SMB deals need different targets. Set the band per segment or you'll punish the enterprise team for physics.
Fix the inputs, and the formula takes care of itself#
The forecast accuracy formula is arithmetic anyone can implement in an afternoon. What separates an 85% team from a 68% team is whether the pipeline feeding that arithmetic reflects reality — whether the contacts on those opportunities still work there, whether every deal is multi-threaded, whether the accounts are deduped.
Start with the contact layer. Use the Tomba Email Finder to map the full buying committee on every open opportunity, verify the contacts already sitting in your CRM, and stop forecasting deals whose only champion left six weeks ago. The free tier gives you 25 searches a month to test the workflow on your top accounts; the Starter plan runs $49/mo and the Growth plan $99/mo when you're ready to run it across the whole pipeline — full Tomba pricing is on the site. Clean inputs, honest formula, forecast you can actually defend.
Related guides#
Ready to find emails that actually work?
Join 150,000+ professionals who stopped guessing and started sending. Free credits on signup — no credit card required.
Get the Tomba newsletter
Practical outbound tactics and product updates — once every two weeks.
About the author