Forecast Accuracy Metrics: The 2026 Guide for Sales Teams
MAPE, WAPE, bias, slip rate, coverage ratio — most revenue teams track one and get blindsided by the rest. Here is how each forecast accuracy metric works, what a good number looks like, and which one catches a bad quarter first.
TL;DR
- One number is not enough. Track MAPE (percentage error), bias (direction of error), slip rate (deals that move out), and coverage ratio together — each catches a different failure.
- Median B2B sales teams land within roughly 20% of their commit; strong ones hold ±5–10% at the quarter level. Anything past ±15% means your process, not your reps, is broken.
- WAPE beats MAPE the moment your deal sizes are uneven — which is almost always in B2B.
- Forecast error is usually a data problem before it is a judgment problem: stale contacts, dead champions, and unverified records inflate stage-weighted pipeline.
- Measure accuracy at a fixed snapshot (day 1 of the quarter, week 6, week 11) or you are grading a moving target.
What are forecast accuracy metrics?#
Forecast accuracy metrics measure the gap between what you said would close and what actually closed. That is the whole idea. Everything else — MAPE, WAPE, bias, slip — is a different way of dividing that gap by something so the answer is comparable across quarters, teams, and segments.
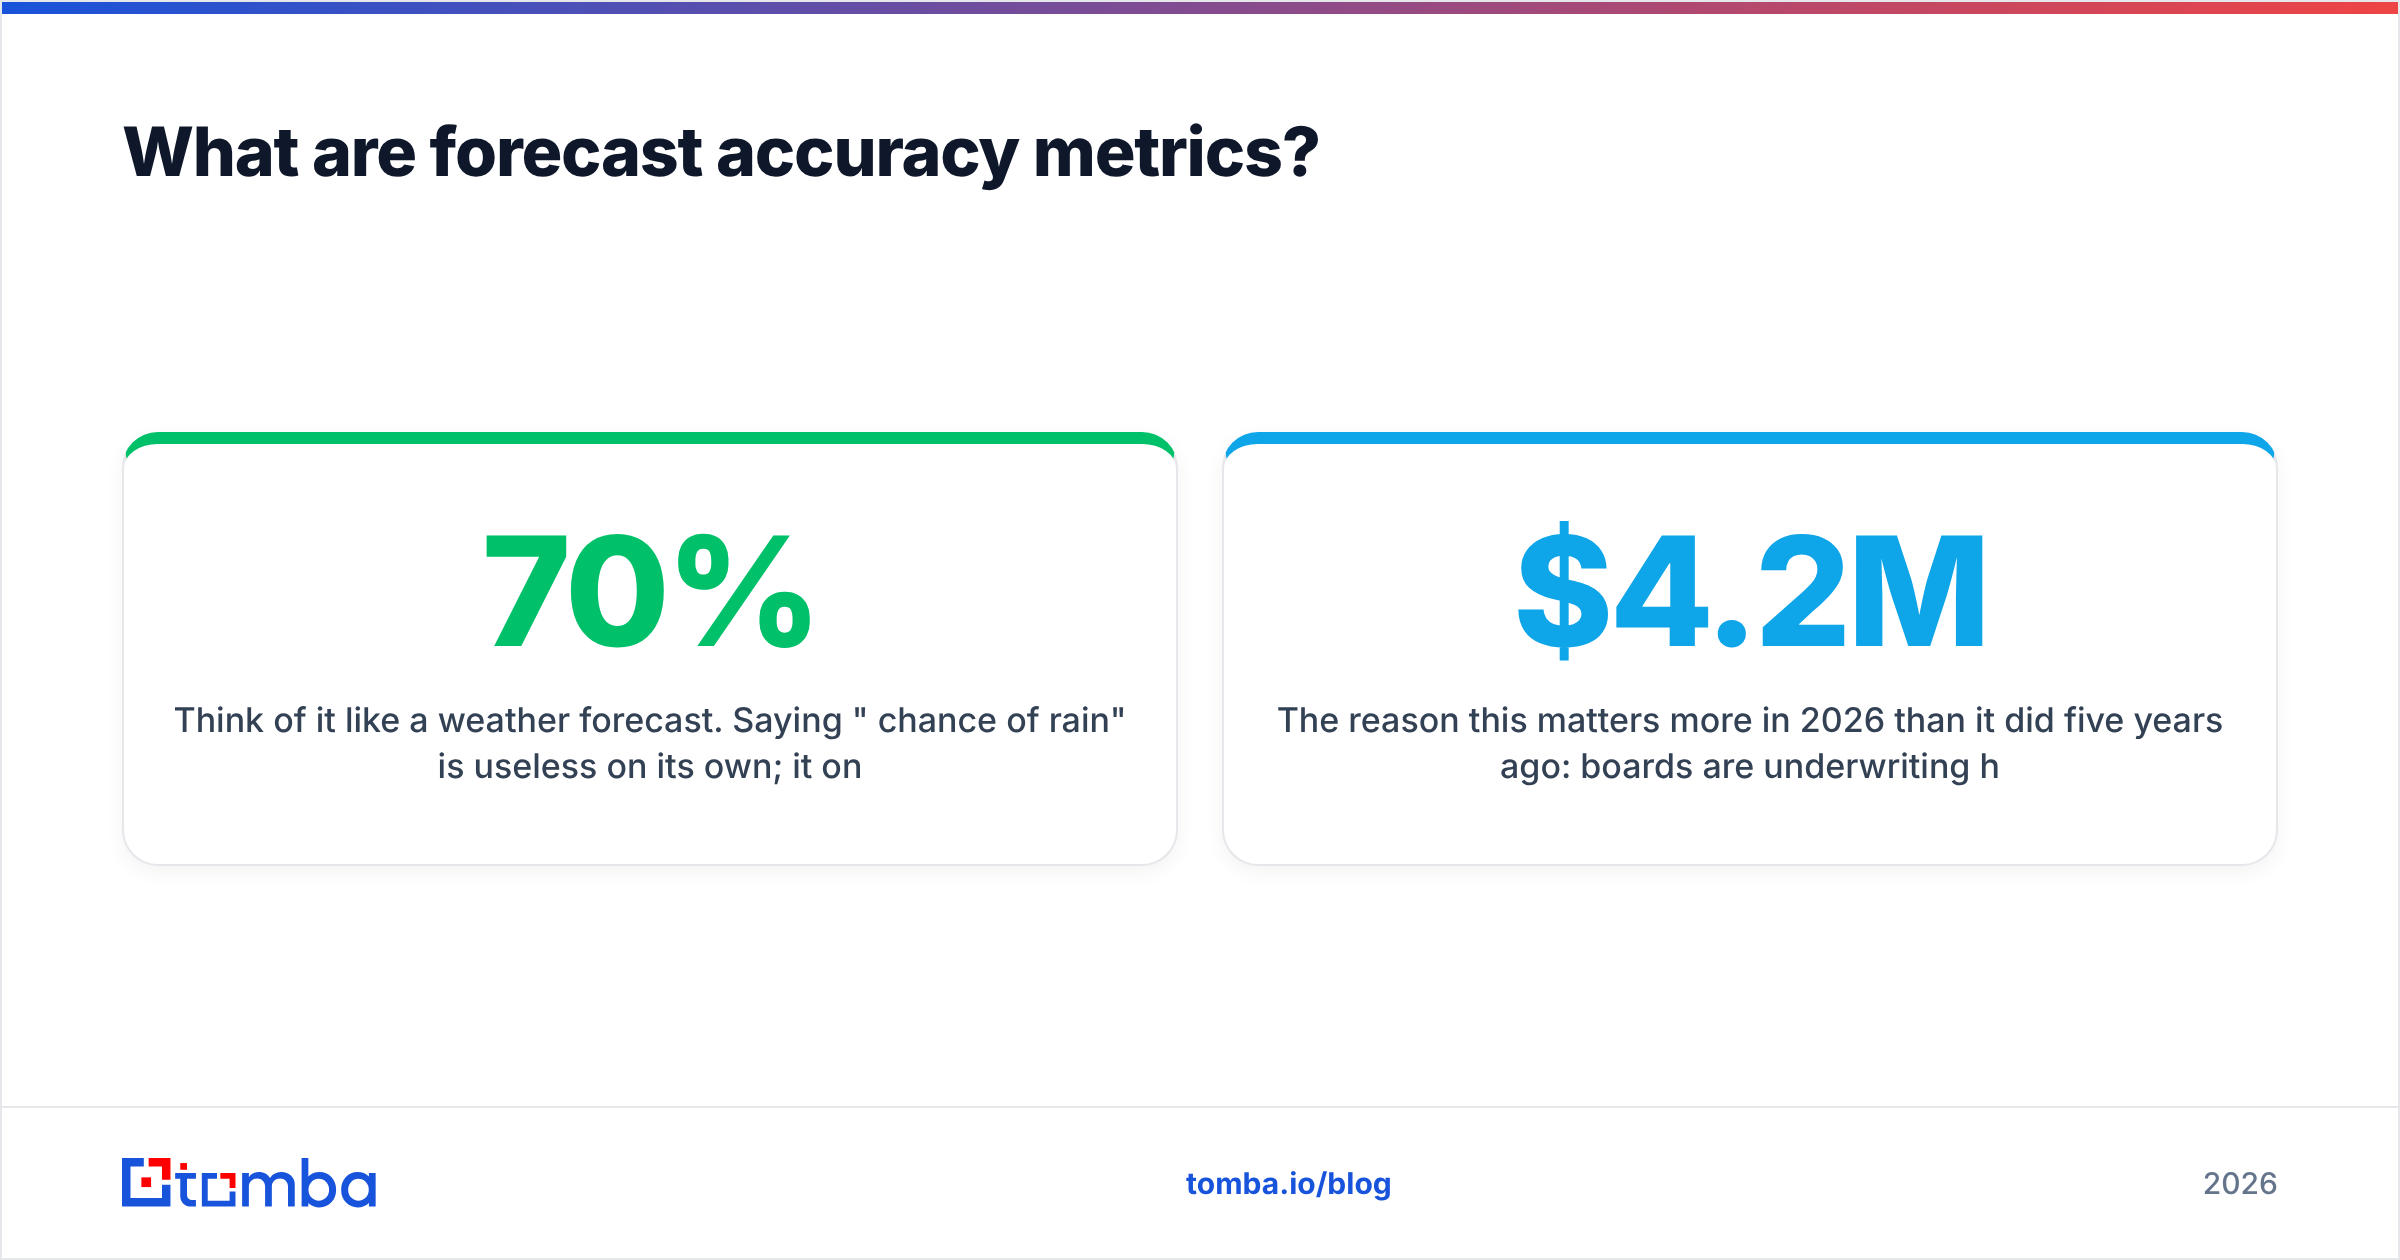
Think of it like a weather forecast. Saying "70% chance of rain" is useless on its own; it only becomes useful after a hundred forecasts, when you can check whether it actually rained on roughly 70 of those days. Sales forecasting works the same way. A single quarter where you hit the number tells you nothing. Four quarters of tracked error tells you whether your pipeline model is calibrated or whether you are just lucky when the market is good.
The reason this matters more in 2026 than it did five years ago: boards are underwriting hiring plans off forecast, not off bookings. Gartner has been consistent that forecast credibility, not forecast optimism, is what buys sales leaders runway. A team that reliably calls $4.2M and delivers $4.1M gets more headcount than a team that calls $6M and delivers $4.4M.
Three things a good accuracy program needs:
- A fixed snapshot rule. Pick the moment you freeze the forecast — start of quarter, mid-quarter, and final commit are the common three. Compare each snapshot to actuals separately.
- A single unit of truth. Closed-won revenue as booked in the CRM, net of clawbacks. Not ARR, not bookings-plus-pipeline-adds, not "we'll count that January deal."
- Segmentation. Enterprise and SMB fail differently. Blend them and both look mediocre.

Actually — that image lives at the placeholder below.
Which forecast accuracy metrics should you actually track?#
Here is the honest comparison. Most teams pick MAPE because it is the one they have heard of, then discover it punishes small-deal segments unfairly and hides systematic optimism.
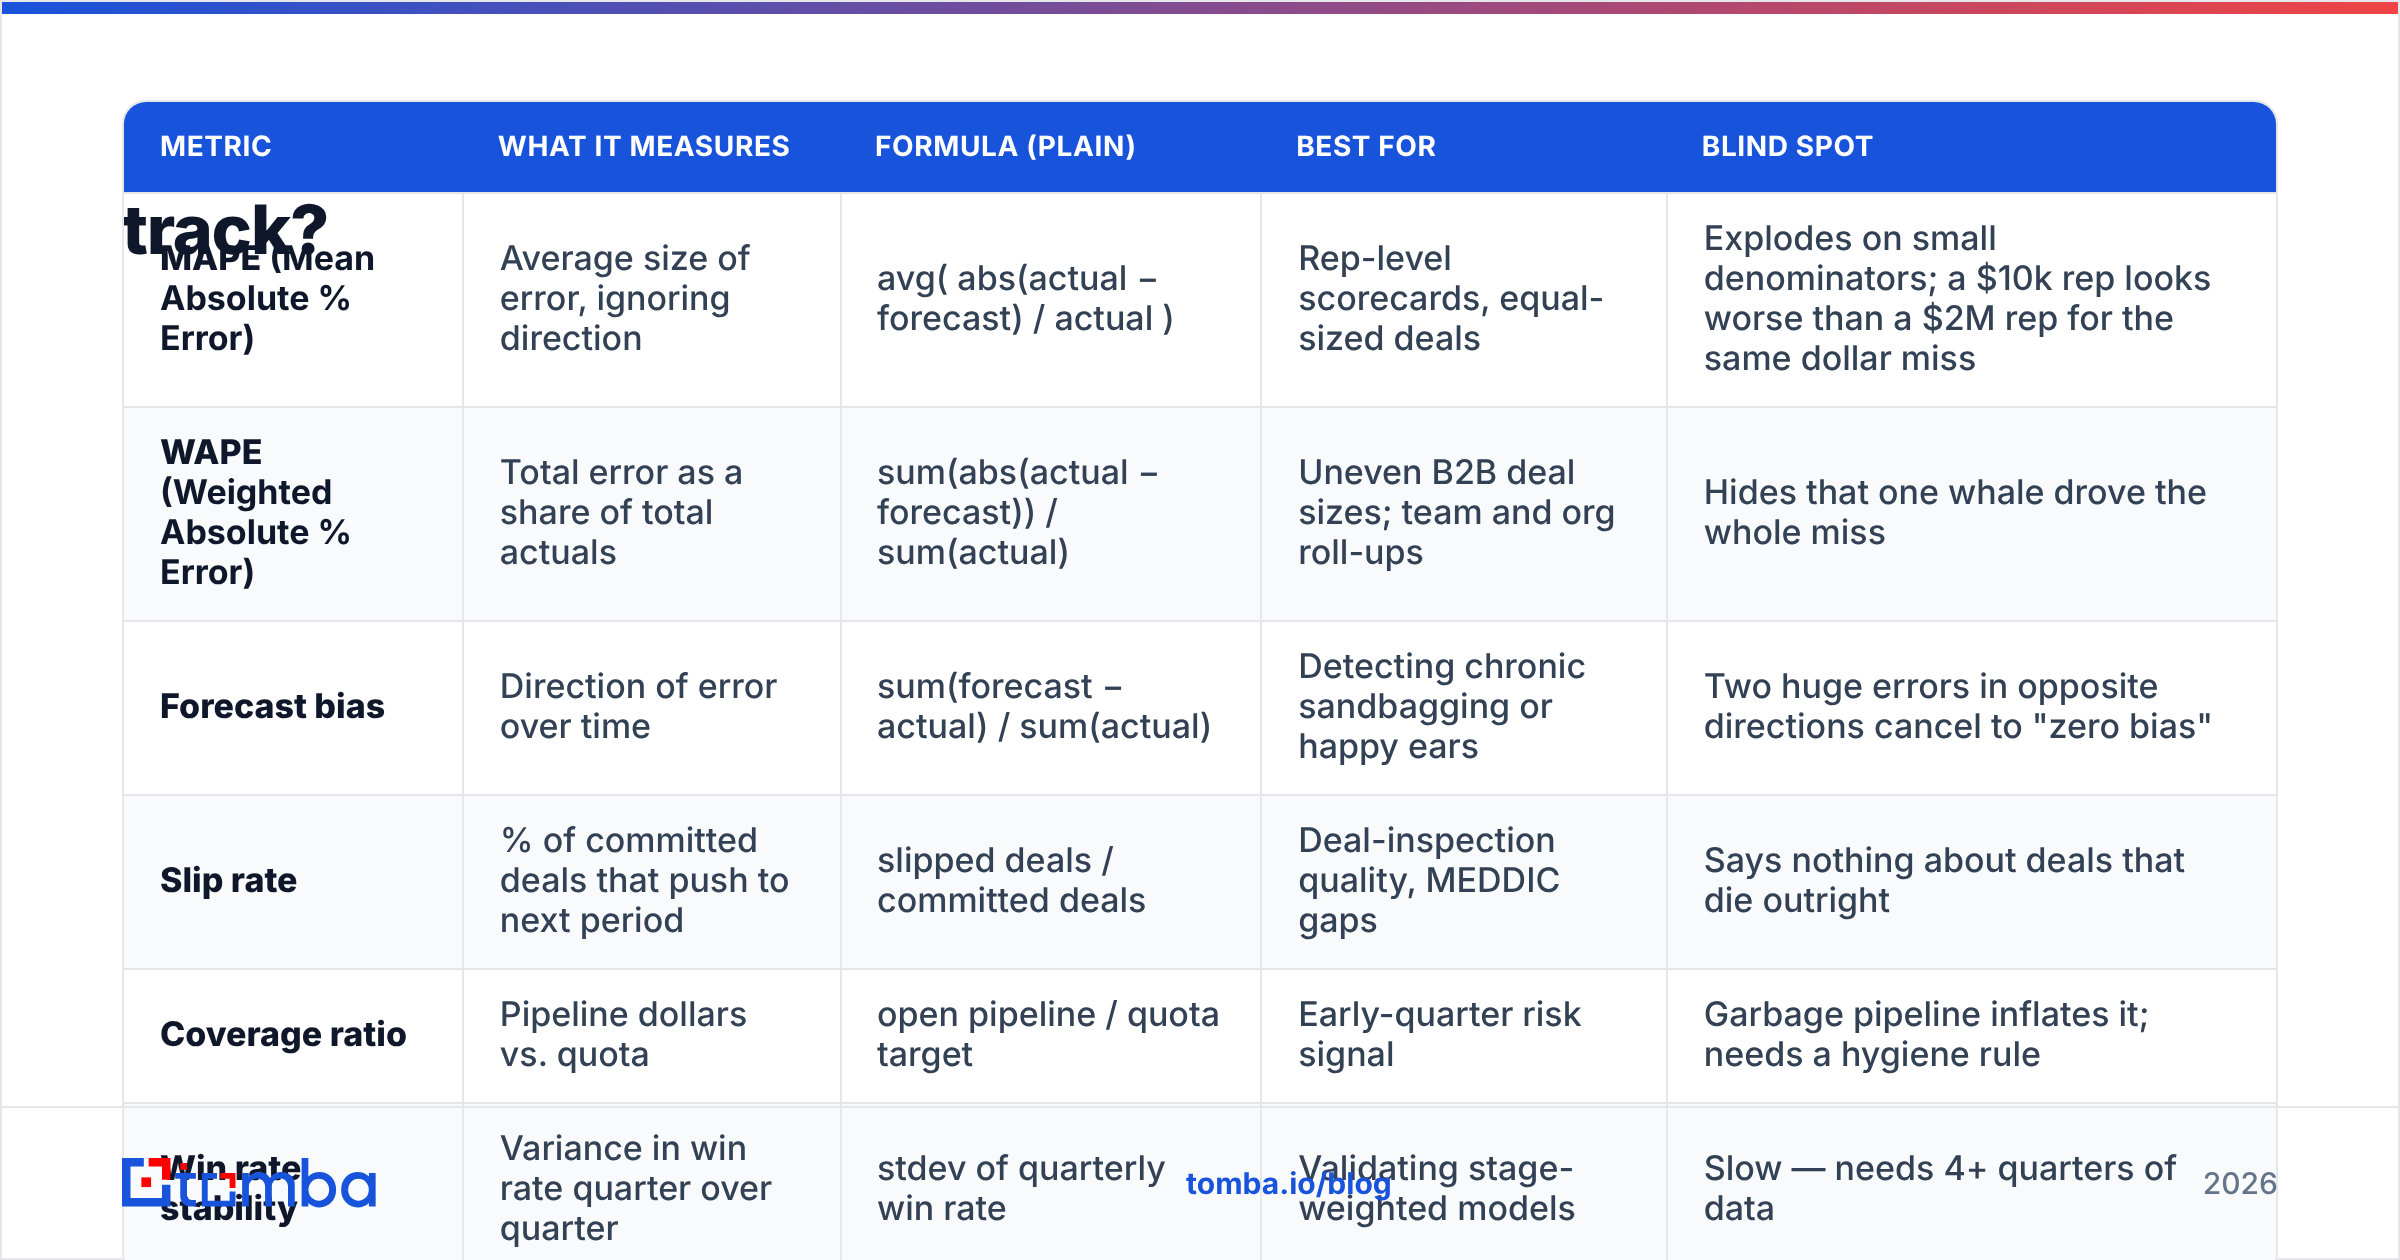
| Metric | What it measures | Formula (plain) | Best for | Blind spot |
|---|---|---|---|---|
| MAPE (Mean Absolute % Error) | Average size of error, ignoring direction | avg( abs(actual − forecast) / actual ) | Rep-level scorecards, equal-sized deals | Explodes on small denominators; a $10k rep looks worse than a $2M rep for the same dollar miss |
| WAPE (Weighted Absolute % Error) | Total error as a share of total actuals | sum(abs(actual − forecast)) / sum(actual) | Uneven B2B deal sizes; team and org roll-ups | Hides that one whale drove the whole miss |
| Forecast bias | Direction of error over time | sum(forecast − actual) / sum(actual) | Detecting chronic sandbagging or happy ears | Two huge errors in opposite directions cancel to "zero bias" |
| Slip rate | % of committed deals that push to next period | slipped deals / committed deals | Deal-inspection quality, MEDDIC gaps | Says nothing about deals that die outright |
| Coverage ratio | Pipeline dollars vs. quota | open pipeline / quota target | Early-quarter risk signal | Garbage pipeline inflates it; needs a hygiene rule |
| Win rate stability | Variance in win rate quarter over quarter | stdev of quarterly win rate | Validating stage-weighted models | Slow — needs 4+ quarters of data |
The practical answer for most B2B teams: WAPE for the org number, MAPE for individual reps with comparable deal sizes, bias tracked always, slip rate reviewed weekly. Coverage ratio is a leading indicator, not an accuracy metric — treat it as an input.
How do you calculate MAPE, WAPE, and bias?#
Run these on a real quarter before you argue about which one is best. Numbers settle debates faster than frameworks.
- Pull the snapshot. Export every opportunity with a close date inside the quarter, as of your freeze date. Include forecast category, amount, owner, and stage.
- Pull actuals. Closed-won amount for the same opportunity IDs, plus anything that closed and was never in the snapshot (these are your "surprise wins" — track them separately, they are a pipeline-hygiene tell).
- Compute MAPE per rep. For each rep:
abs(their actual − their commit) / their actual. Average across reps. If a rep closed $0, exclude them or MAPE goes to infinity — this is the metric's main structural flaw. - Compute WAPE for the team. Sum every absolute dollar error, divide by total actual revenue. A team that forecast $5.0M and closed $4.4M with offsetting misses across reps might show 12% WAPE while individual MAPEs average 34%. Both are true; they answer different questions.
- Compute bias with the sign intact.
(total forecast − total actual) / total actual. Positive means chronic over-calling. Four consecutive quarters of positive bias above 10% is a management problem, not a modeling problem. - Segment and re-run. Split by segment, region, and deal size band. The blended number almost always conceals one segment that is fine and one that is a mess.
What counts as good forecast accuracy in 2026?#
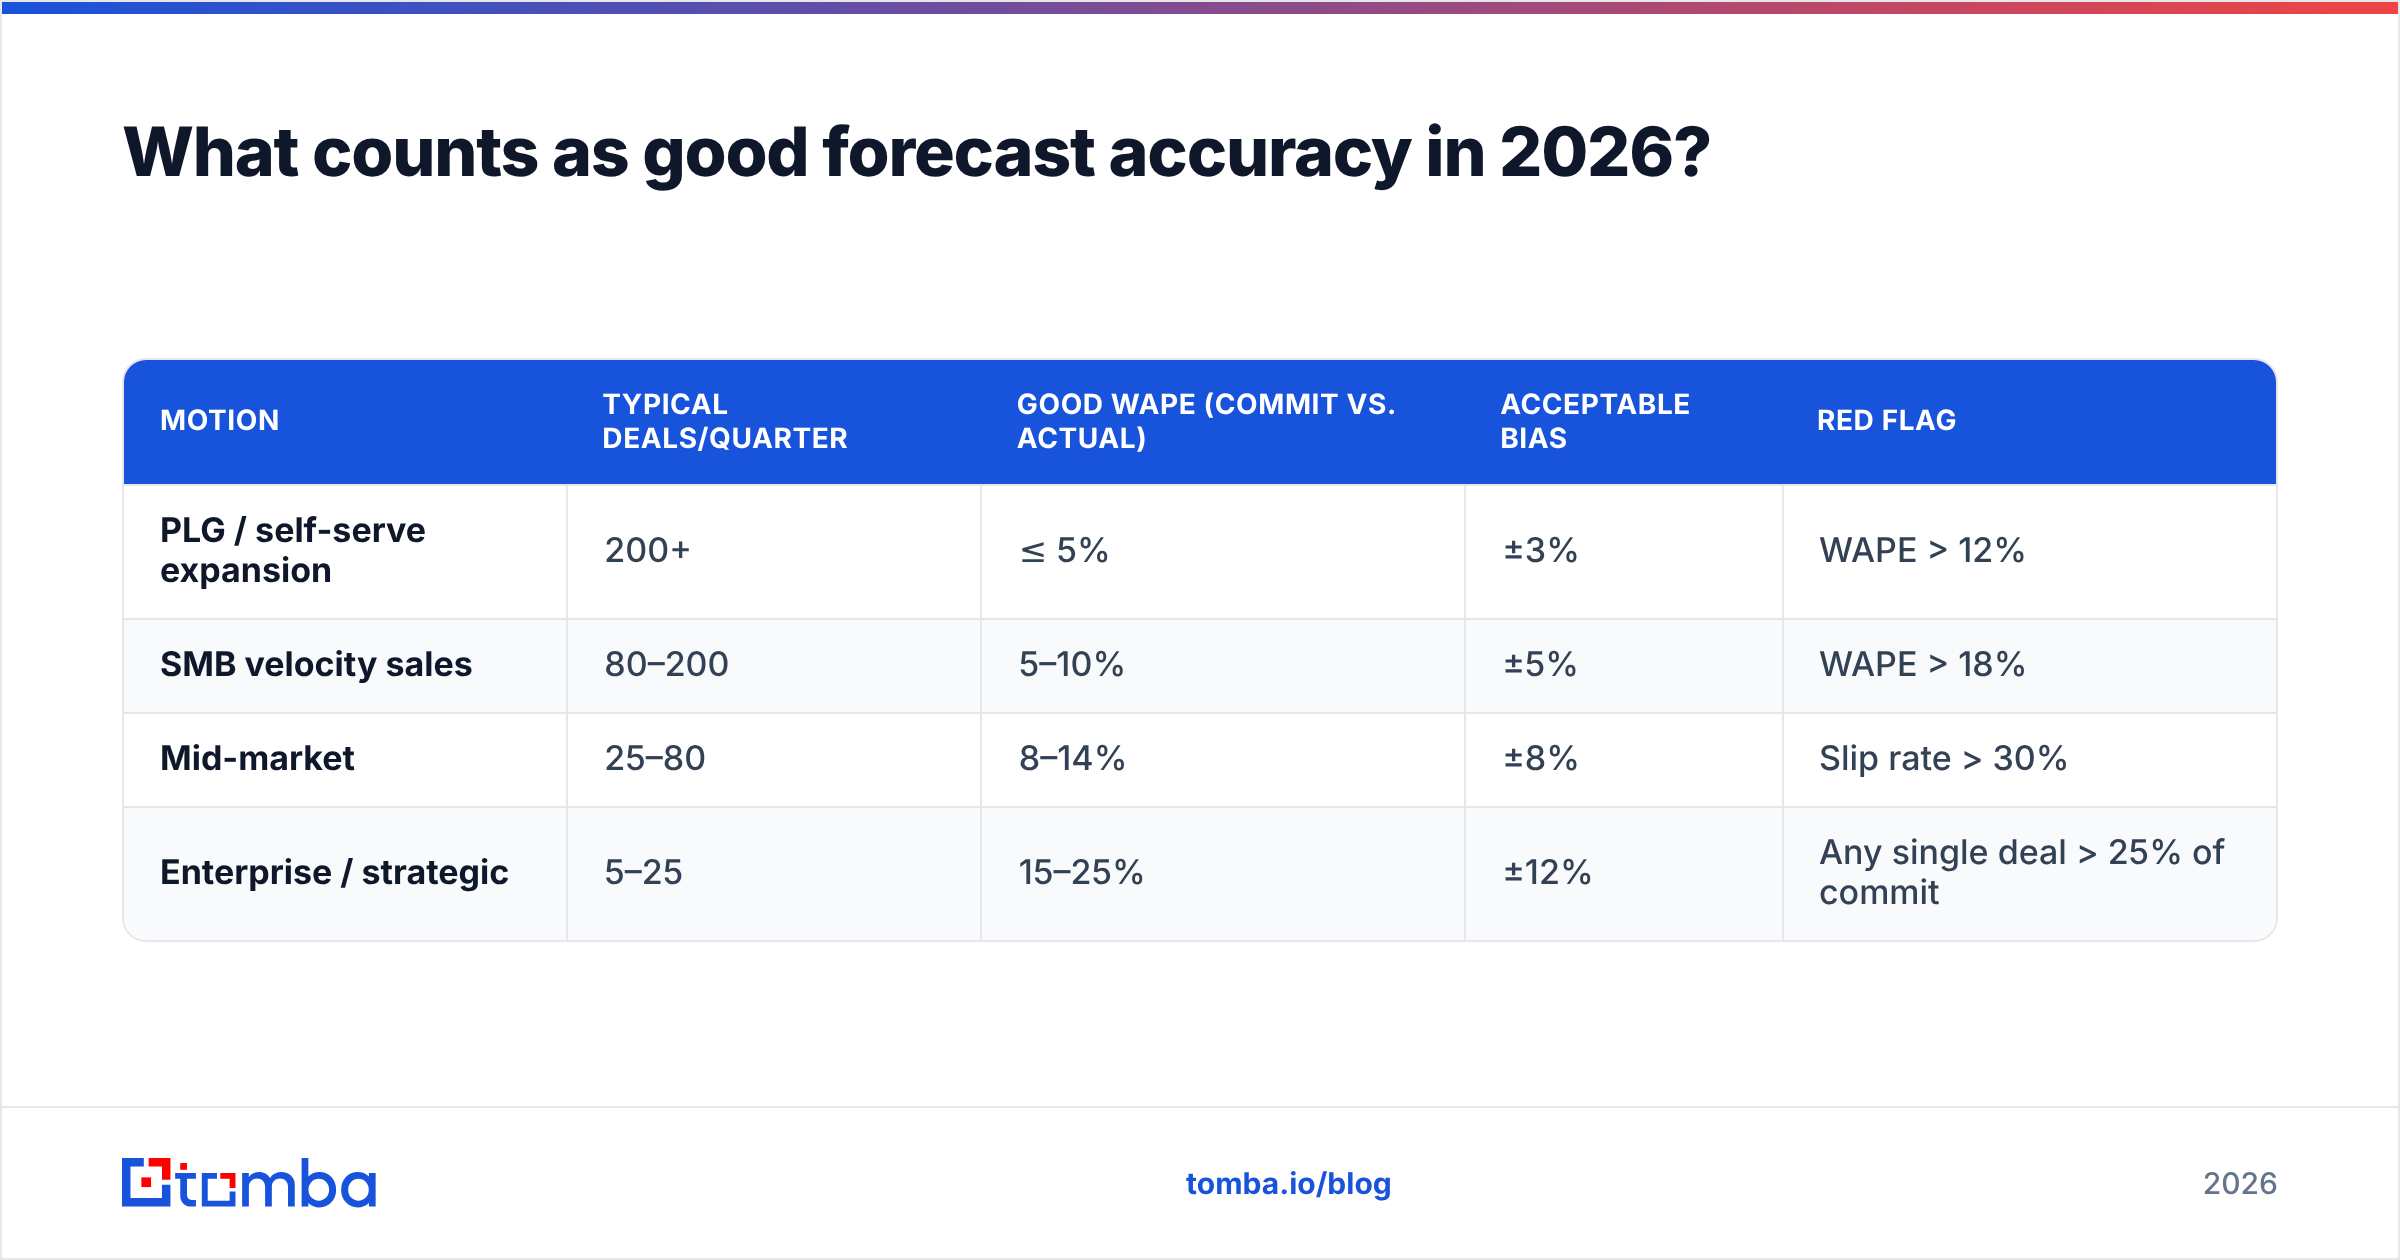
Depends on your motion. A self-serve-heavy business with 300 deals a quarter should be far tighter than an enterprise team closing eleven.
| Motion | Typical deals/quarter | Good WAPE (commit vs. actual) | Acceptable bias | Red flag |
|---|---|---|---|---|
| PLG / self-serve expansion | 200+ | ≤ 5% | ±3% | WAPE > 12% |
| SMB velocity sales | 80–200 | 5–10% | ±5% | WAPE > 18% |
| Mid-market | 25–80 | 8–14% | ±8% | Slip rate > 30% |
| Enterprise / strategic | 5–25 | 15–25% | ±12% | Any single deal > 25% of commit |
Two caveats worth internalizing. First, small-N enterprise forecasting is genuinely hard — one $1.8M deal slipping two weeks wrecks the quarter and no metric will have predicted it. Judge those teams on slip rate and deal-inspection quality instead of WAPE. Second, suspiciously good accuracy is its own warning sign. A team hitting 2% WAPE every quarter is usually sandbagging the commit and holding closed deals in reserve, which destroys the forecast's value as a planning input even though the scorecard looks immaculate.
HubSpot's sales research has repeatedly found that most reps forecast on gut feel adjusted by whatever their manager pushed back on last week. That is not a model. It is a negotiation. The fix is separating the algorithmic forecast (stage-weighted or historically-calibrated) from the judgment forecast (rep commit) and tracking accuracy on both. When judgment consistently beats the model, your model needs retraining. When the model wins, your inspection process needs work.
Why do accurate forecasts still fail?#
Because forecast accuracy metrics grade the output of a pipeline whose inputs nobody audits.
Here is the chain. A stage-weighted forecast multiplies open pipeline by historical stage conversion rates. That math is only as good as the pipeline records feeding it. And pipeline records rot fast — contact data decays at roughly 2–3% per month as people change jobs, companies restructure, and email addresses go dark. Over a two-quarter enterprise sales cycle, a meaningful slice of your "engaged" opportunities are engaged with someone who left.
What that does to your numbers:
- Stage 3 deals with a departed champion still count at 40% weight. They convert at close to zero.
- Opportunities with bounced contact emails show as active in sequence reporting because the bounce never got written back to the CRM.
- Duplicate accounts double-count pipeline, inflating coverage ratio right when you need it to be honest.
- Missing decision-maker contacts mean the deal is being forecast off a single champion relationship — the single largest predictor of slip in most inspection frameworks.
None of these show up in MAPE until the quarter is already lost. They show up in a data audit in an afternoon. Running an email verifier pass across your open-opportunity contacts, then re-scoring pipeline on records that have at least two verified, reachable stakeholders, typically strips 10–20% of nominal pipeline out of the model — and makes the remaining forecast dramatically more accurate. Painful the first time. Cheaper than a missed board number.

How do you build a forecast accuracy scorecard?#
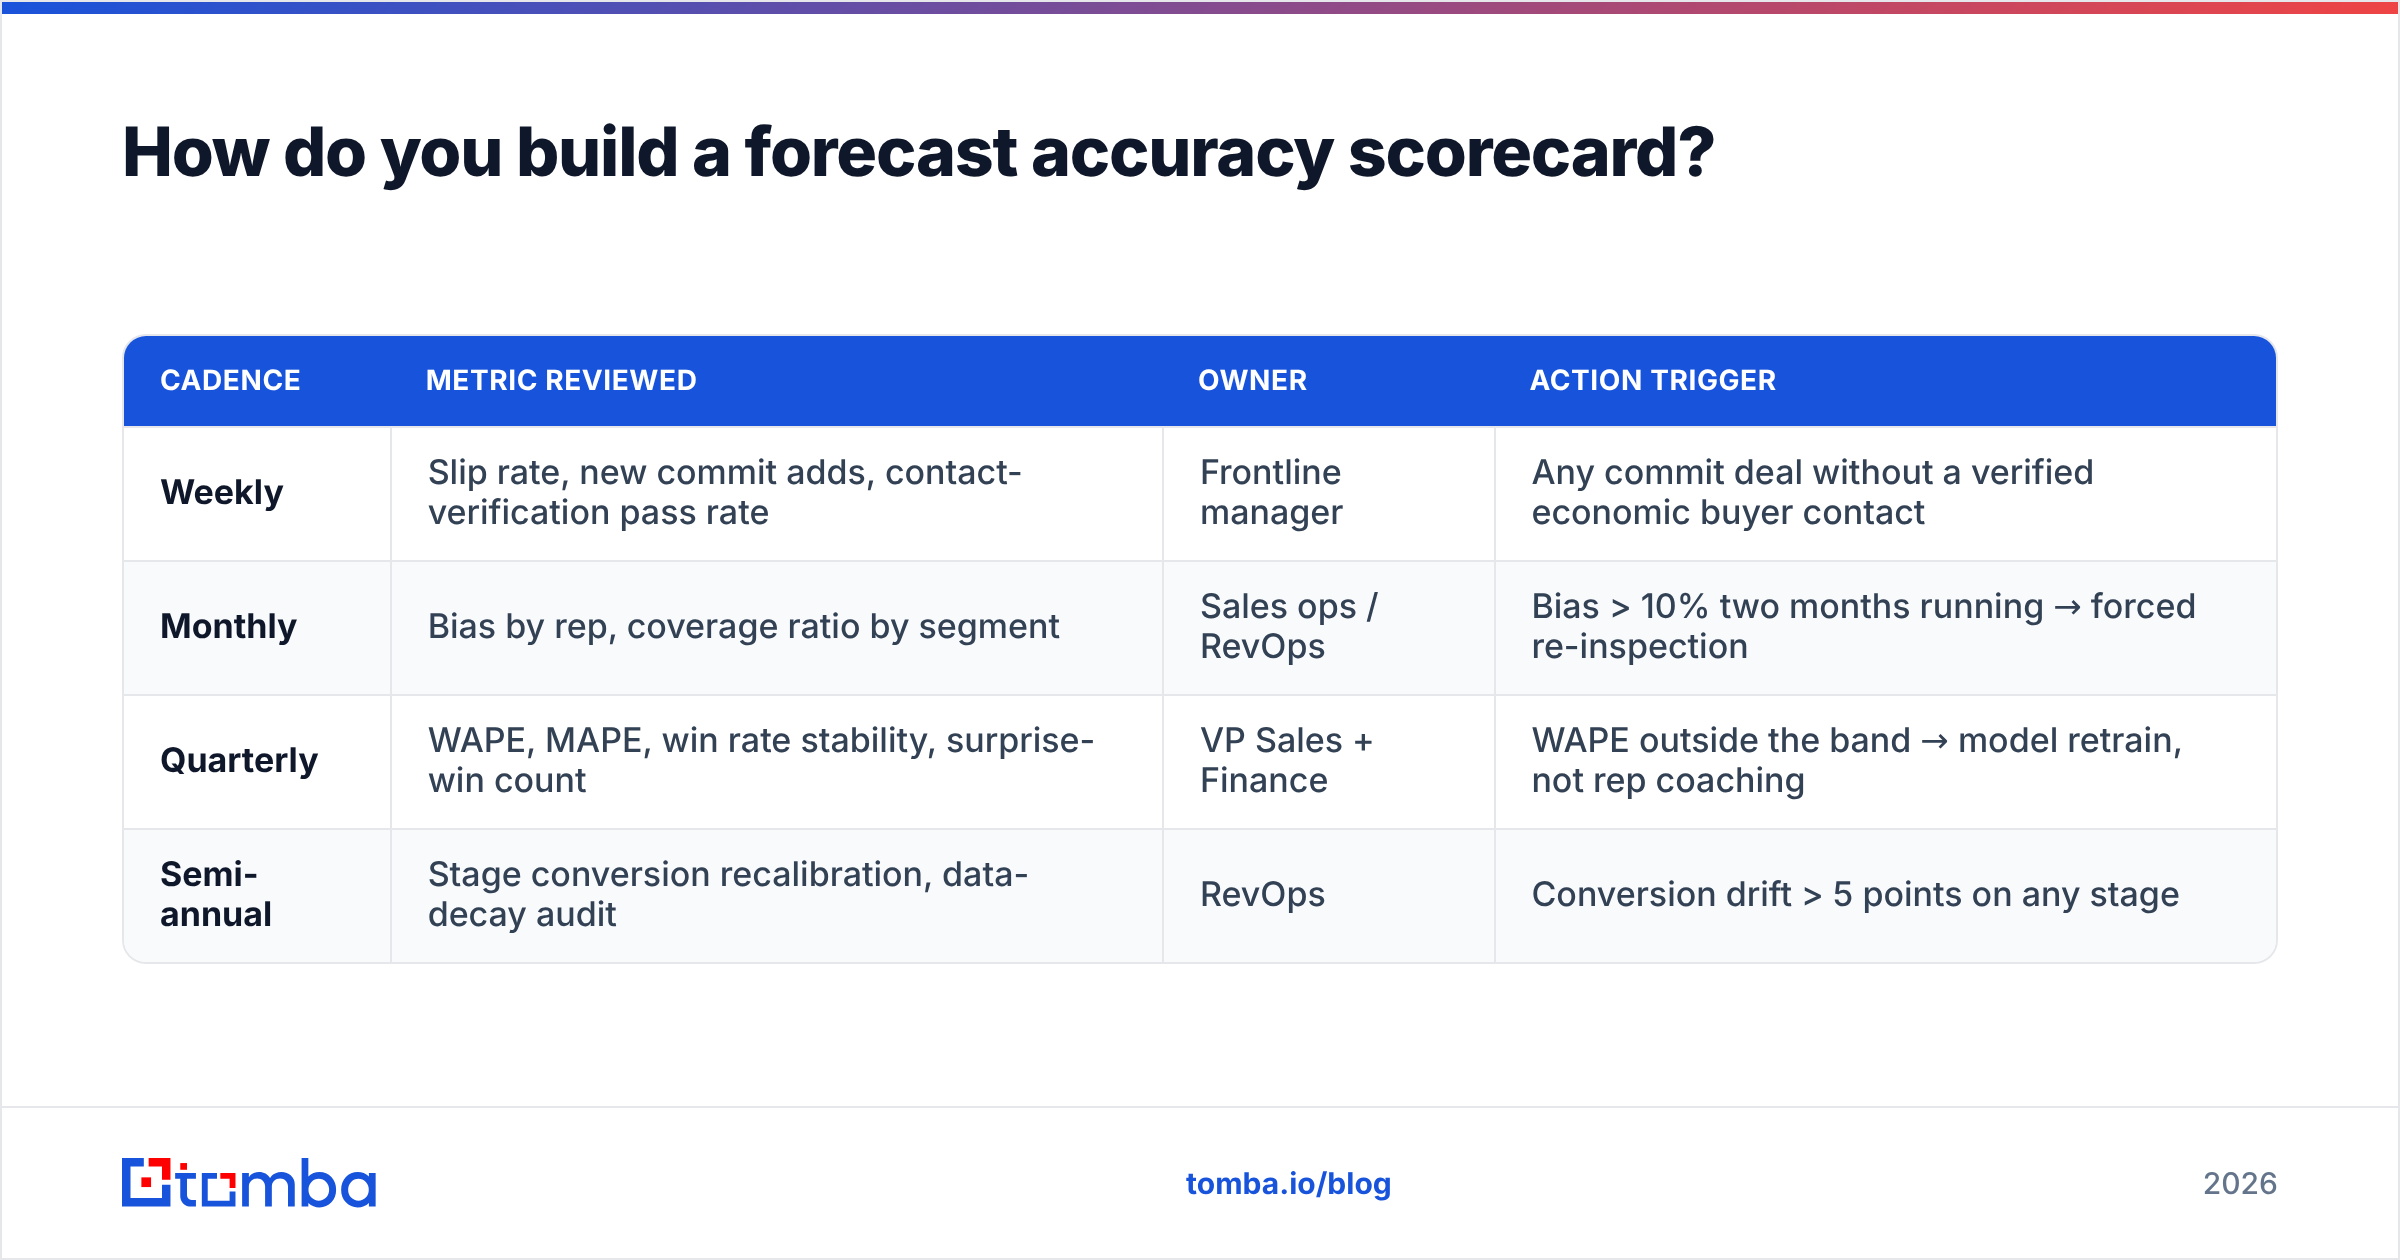
Keep it to one page and one cadence. Scorecards die from ambition.
| Cadence | Metric reviewed | Owner | Action trigger |
|---|---|---|---|
| Weekly | Slip rate, new commit adds, contact-verification pass rate | Frontline manager | Any commit deal without a verified economic buyer contact |
| Monthly | Bias by rep, coverage ratio by segment | Sales ops / RevOps | Bias > 10% two months running → forced re-inspection |
| Quarterly | WAPE, MAPE, win rate stability, surprise-win count | VP Sales + Finance | WAPE outside the band → model retrain, not rep coaching |
| Semi-annual | Stage conversion recalibration, data-decay audit | RevOps | Conversion drift > 5 points on any stage |
A few implementation notes that save pain later:
Freeze snapshots in a separate table. If you compute accuracy off live CRM records, the historical forecast changes every time someone edits a field. You will spend a quarter arguing about numbers that both parties computed correctly from different states of the same object. Write the snapshot to an immutable row and never touch it.
Never blend metrics into a single "forecast health score." It sounds elegant and it destroys diagnostic value. A composite of 78 tells you nothing about whether the problem is optimism, slip, or thin coverage.
Instrument the leading indicators, not just the lagging ones. Slip rate and contact-verification pass rate move weeks before WAPE does. By the time WAPE is bad, the quarter is over. Salesforce's guidance on forecast management makes the same point in different language: inspection frequency, not model sophistication, is what moves accuracy in practice.
How do data quality tools improve forecast accuracy?#
Indirectly, but measurably. You are not going to buy a tool that makes your forecast accurate. You can buy tools that stop your pipeline from lying to your model.
The specific interventions that show up in accuracy numbers within one or two quarters:
- Verify every contact on a commit-stage opportunity. A deal you cannot reach is not a deal. Bulk verification across your open pipeline is a one-hour job with a bulk verify run and it directly reduces phantom stage-3 volume.
- Enrich accounts with multi-threaded contacts. Deals with three or more verified stakeholders slip materially less than single-threaded ones. Contact enrichment turns a single-champion opportunity into a multi-threaded one you can actually forecast.
- Auto-flag departed champions. When a contact's email stops resolving, that is a signal to re-score the deal, not an inbox annoyance to ignore.
- Deduplicate before you compute coverage. Duplicate accounts are the most common cause of coverage ratios that look healthy in September and evaporate in December.
None of this replaces deal inspection. It makes inspection faster, because the manager walks into the call already knowing which deals have a reachable buying committee and which are being forecast off one person who has not replied in three weeks.
Frequently asked questions#
Is MAPE or WAPE better for sales forecasting? WAPE, for almost every B2B team. MAPE weights a $12k deal's error the same as a $1.2M deal's error, which distorts the org number. Keep MAPE for rep-level comparisons within a homogeneous segment.
How many quarters of data do I need before accuracy metrics mean anything? Four minimum for bias, six to eight before you trust stage conversion recalibration. One quarter is noise.
Should reps see their own accuracy scores? Yes, and only their own plus the team median. Public rankings on forecast accuracy produce sandbagging within two quarters — reps learn to commit low and get "credit" for beating it.
Does AI forecasting fix this? It fixes the arithmetic, not the inputs. A model trained on pipeline records with dead contacts and duplicate accounts will produce a confident, precise, wrong number faster than a spreadsheet would.
Start with the data your forecast is built on#
Forecast accuracy metrics are diagnostics. They tell you the pipeline lied; they do not tell you where. The fastest place to look is the contact layer — whether the humans attached to your commit-stage opportunities are still there, still reachable, and still more than one per account.
Tomba's Email Finder fills that gap: find and verify the additional stakeholders on every commit deal so you are forecasting a buying committee, not a single champion who might be gone by Thursday. The free tier covers 25 searches a month if you want to test it against one segment first; paid plans start at $49/mo on Starter with bulk and API access for pushing verified contacts straight back into your CRM. Check Tomba pricing for the full breakdown, or run a verification pass on your current open pipeline and see how much of it is actually reachable.
Related guides#
Ready to find emails that actually work?
Join 150,000+ professionals who stopped guessing and started sending. Free credits on signup — no credit card required.
Get the Tomba newsletter
Practical outbound tactics and product updates — once every two weeks.
About the author