Forecast Confidence in 2026: How to Score Deals Honestly
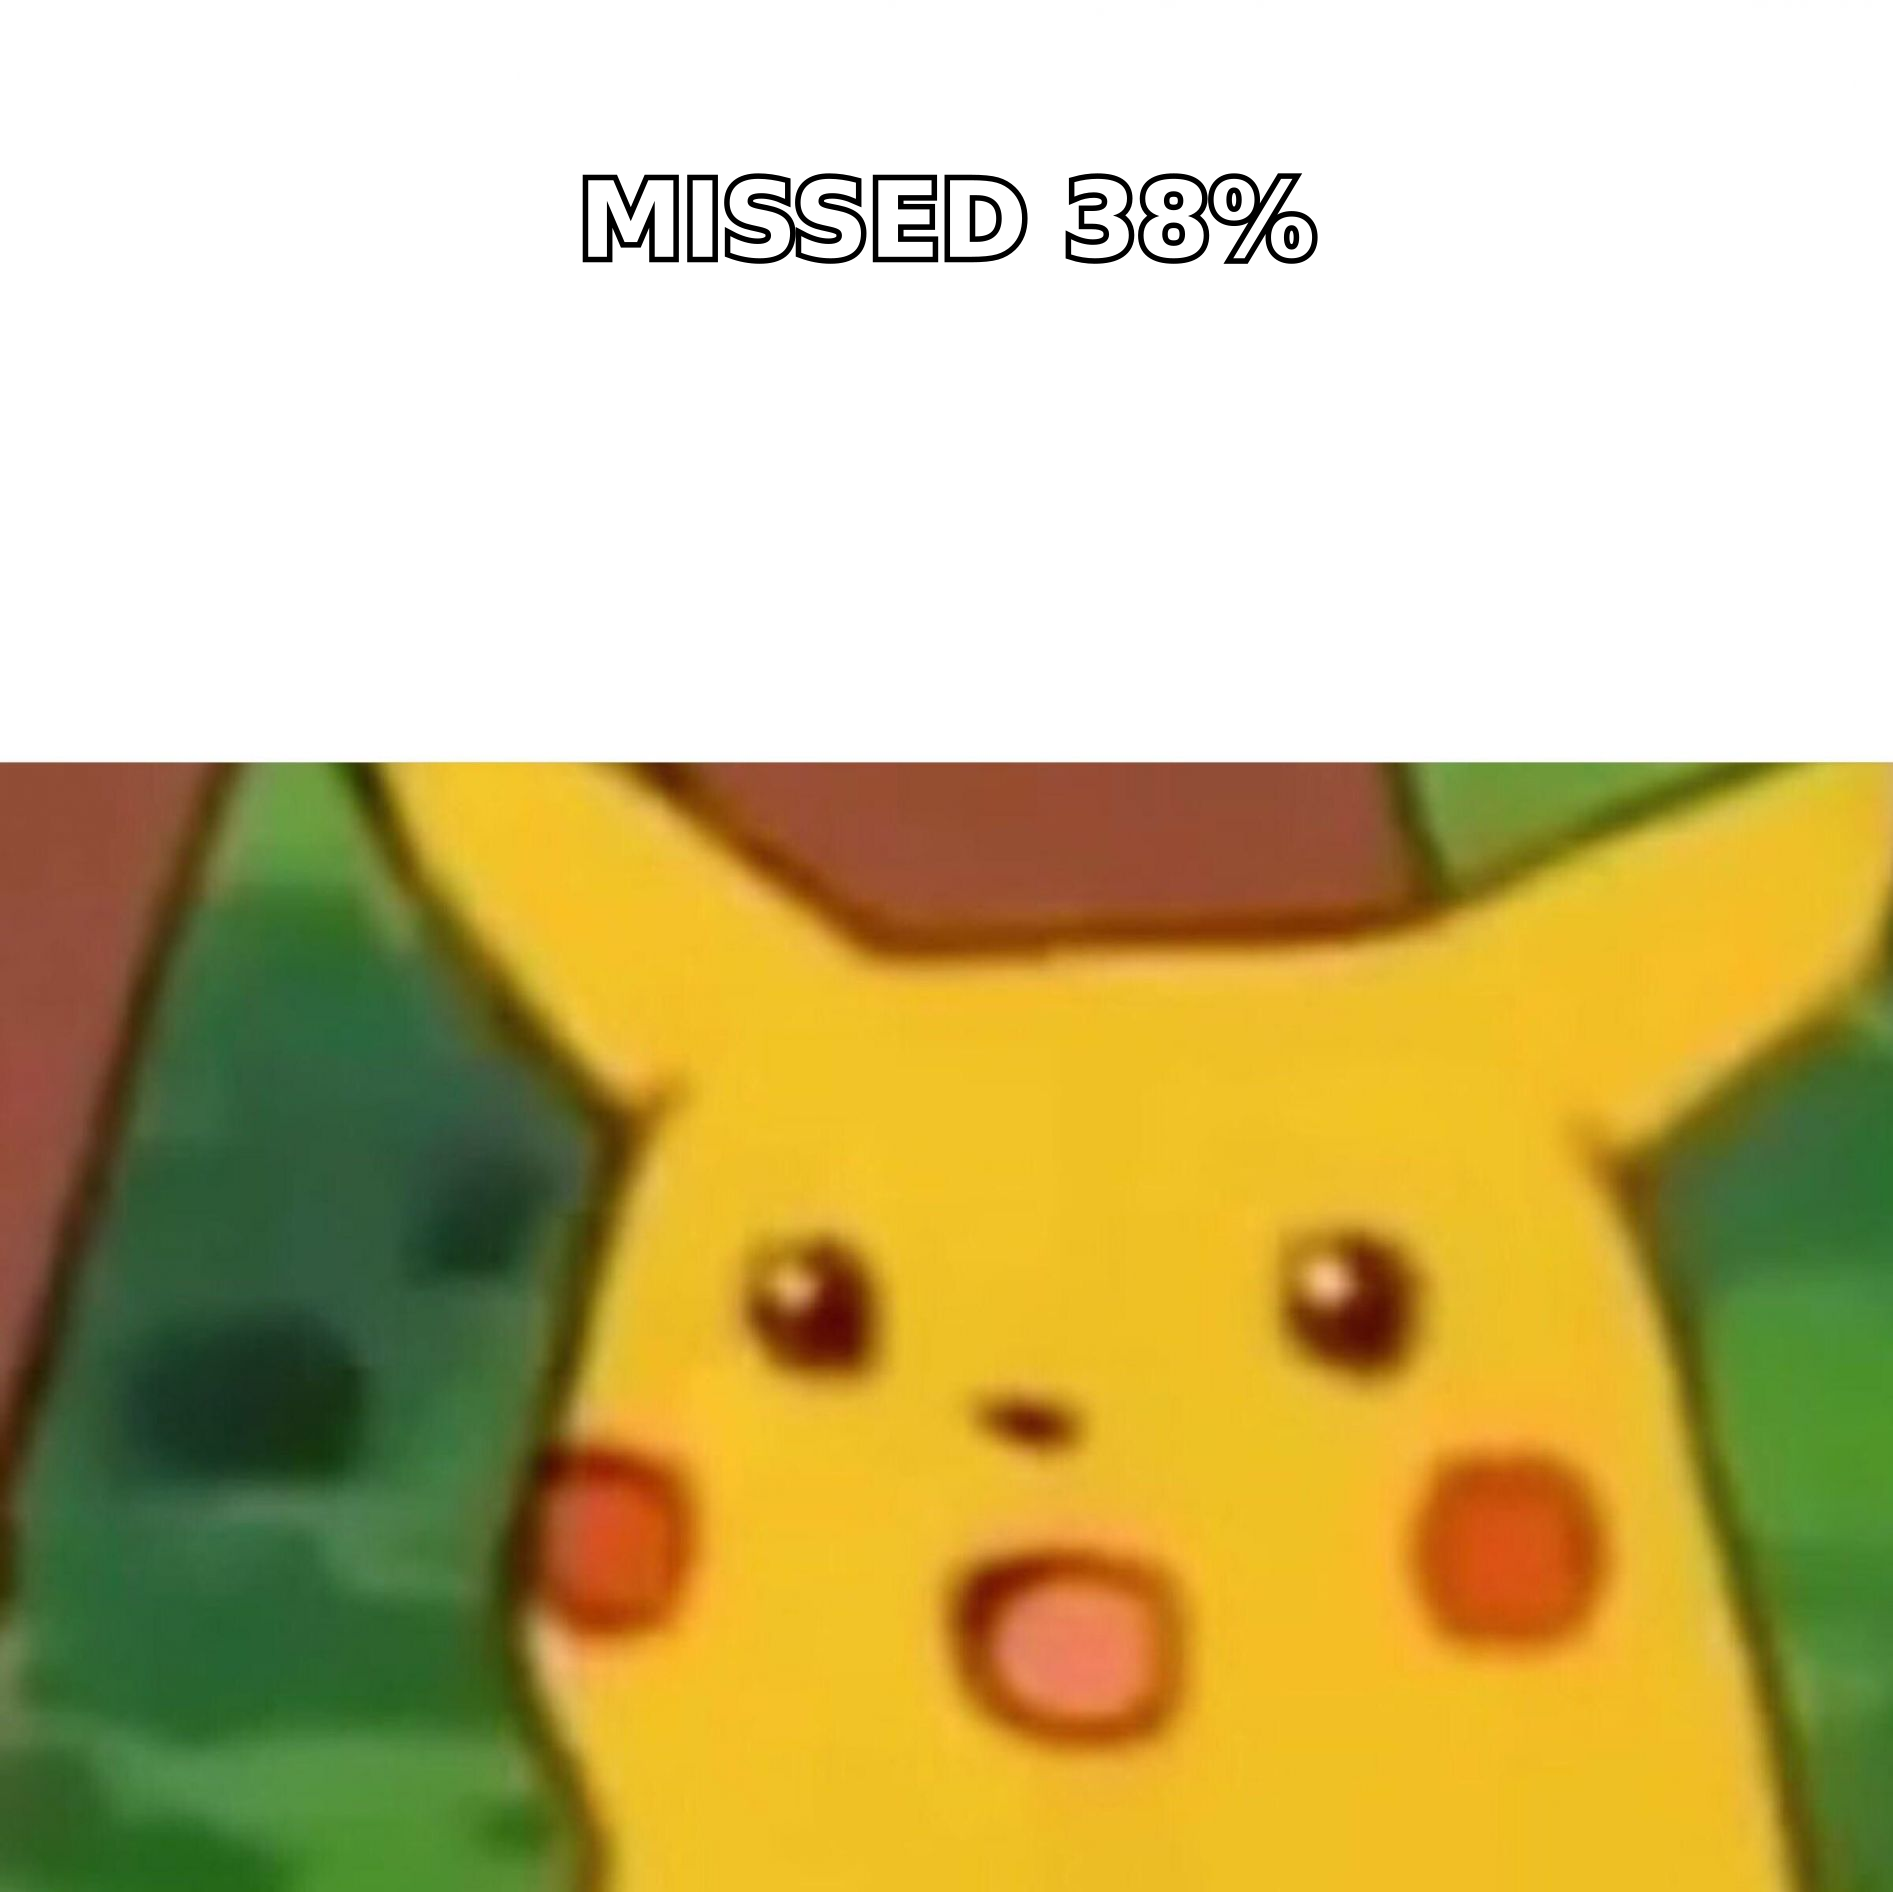
Reps call deals "90% sure" and miss by 40%. Here's how forecast confidence scoring actually works, which signals predict a close, and a scoring model you can run before your next pipeline review.
TL;DR
- Forecast confidence is not a percentage a rep feels — it's a score derived from observable deal evidence (multithreading, mutual action plan, economic buyer engagement, recency).
- Most forecasts miss because probability is tied to stage rather than behavior. Stage-based percentages inherit optimism; behavior-based scores don't.
- A workable model uses 5–7 weighted signals, produces a 0–100 score, and maps to three commit bands. You can build it in a spreadsheet before you buy anything.
- Bad contact data is an underrated forecast killer: if you only have one verified contact at an account, your deal is single-threaded by default and your confidence should drop accordingly.
- Measure forecast accuracy the same way every quarter (commit vs. closed, slip rate, coverage ratio) or you're just changing the story, not the outcome.
What is forecast confidence?#
Forecast confidence is the probability that a specific deal closes in the period you said it would — expressed as a score you can defend with evidence, not a number a rep picks in a CRM dropdown.
Think of it like a weather forecast. A meteorologist doesn't say "70% chance of rain" because they feel optimistic. They say it because in 100 historical days with this exact pressure, humidity, and wind pattern, it rained on 70 of them. Sales forecasting should work the same way: your confidence in a deal is the historical close rate of deals that look like this one.
Most sales teams don't do that. They assign a probability to a pipeline stage — Discovery 20%, Demo 40%, Proposal 60%, Negotiation 90% — and then multiply. The problem is that a deal sitting in Negotiation for 74 days with one contact and no procurement conversation is not a 90% deal. It's a 15% deal wearing a 90% badge.
Forecast confidence separates two things that stage-based models blend together:
- Progression — how far the deal has moved through your process
- Evidence — how much verifiable buyer behavior supports the close date
A deal can be far along and weak. A deal can be early and strong. Only the second dimension predicts revenue.
Why do 90% deals still slip?#
Because the number was never earned. Three failure modes cause most of it.
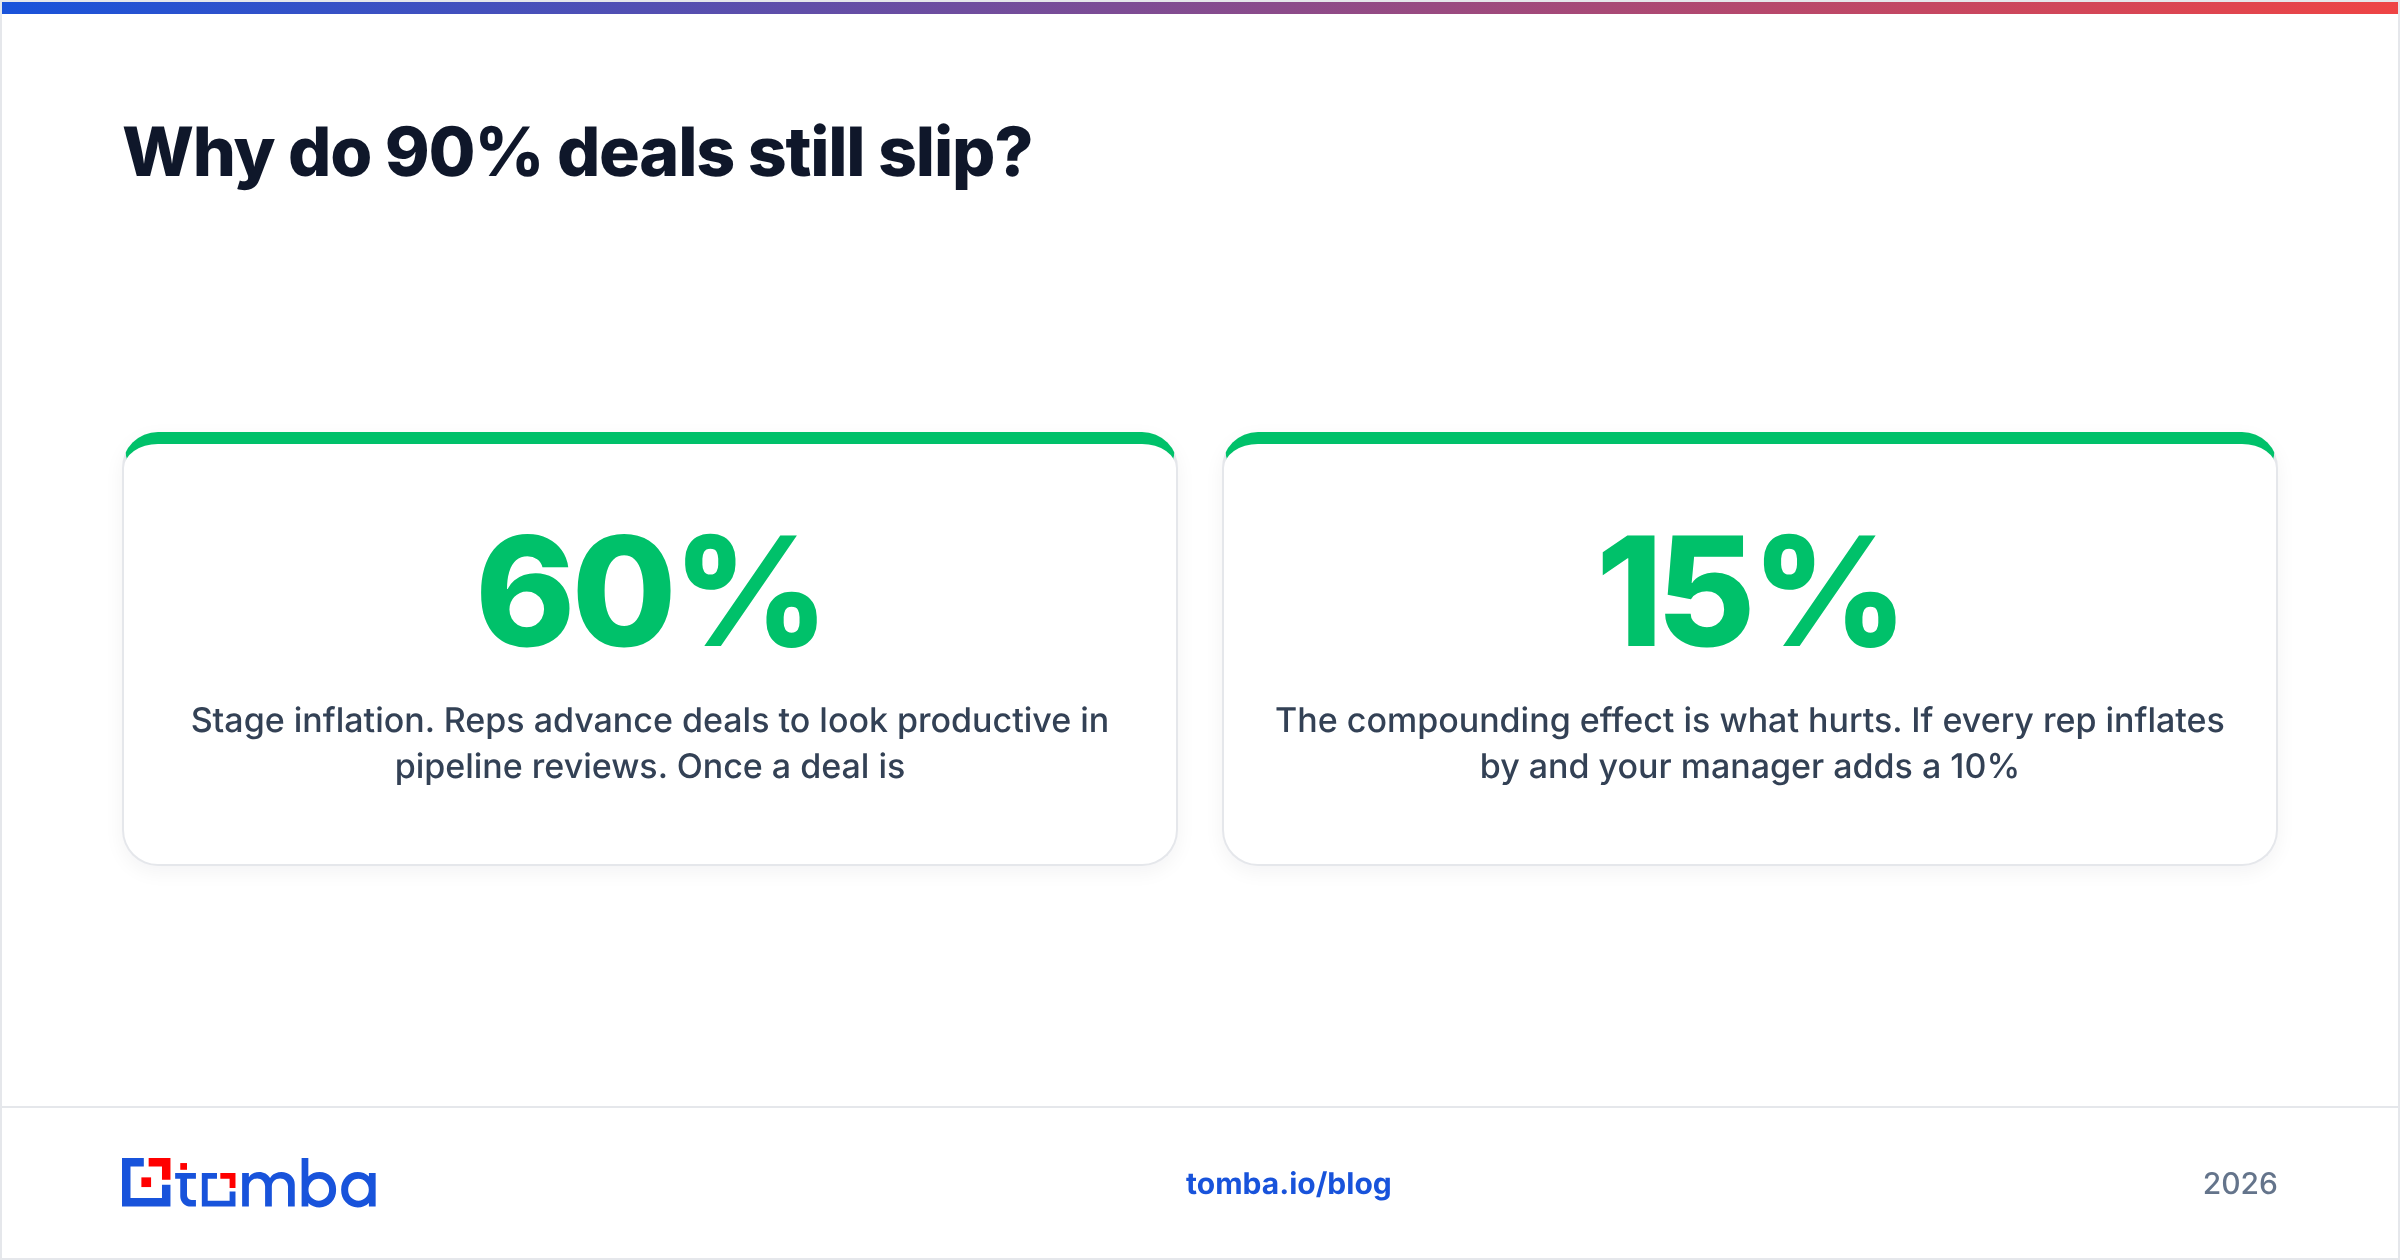
Stage inflation. Reps advance deals to look productive in pipeline reviews. Once a deal is in Proposal, the CRM assigns it 60% whether the buyer asked for the proposal or the rep sent one unprompted. Stage becomes an activity log, not a buyer signal.
Single-threaded relationships. One champion, one thread, one point of failure. When that person changes roles — and roughly one in five B2B contacts changes jobs annually — the deal evaporates and nobody saw it coming. This is why contact enrichment matters to forecasting and not just to prospecting: a deal where you have three verified stakeholders is measurably safer than one where you have a single email address.
No close-date discipline. The close date is set at deal creation and never revisited against buyer reality. If the buyer's procurement cycle takes six weeks and you're four weeks out with no legal contact, your date is fiction.
The compounding effect is what hurts. If every rep inflates by 15% and your manager adds a 10% "sandbagging correction," the number that reaches the board has passed through two layers of guesswork in opposite directions.
What signals actually predict a close?#
These are the inputs worth scoring. Each one is observable — you can point at a record and say yes or no.
- Multithreading depth — Number of distinct contacts at the account who have replied, attended, or engaged in the last 30 days. One contact is a red flag regardless of how enthusiastic they are.
- Economic buyer engagement — Has the person who signs the contract been in a live conversation? Not "my champion says the VP is on board" — actual contact.
- Mutual action plan (MAP) exists and is being followed — A shared, dated plan with owners on both sides. Deals with a MAP that the buyer has edited close at meaningfully higher rates than deals where the seller wrote it alone.
- Recency of buyer-initiated activity — Buyer-initiated beats seller-initiated by a wide margin. Ten follow-ups from you with no inbound reply is negative signal, not neutral.
- Documented pain with a number attached — Can the buyer articulate the cost of doing nothing in currency or hours? If the cost is vague, the budget will be too.
- Procurement and legal path known — Do you know who signs, what the review takes, and whether security review applies? Unknown path is the single most common cause of quarter-end slip.
Notice what's absent: rep sentiment, demo quality, number of calls logged. Those correlate with effort, not outcome.
How do you build a forecast confidence score?#
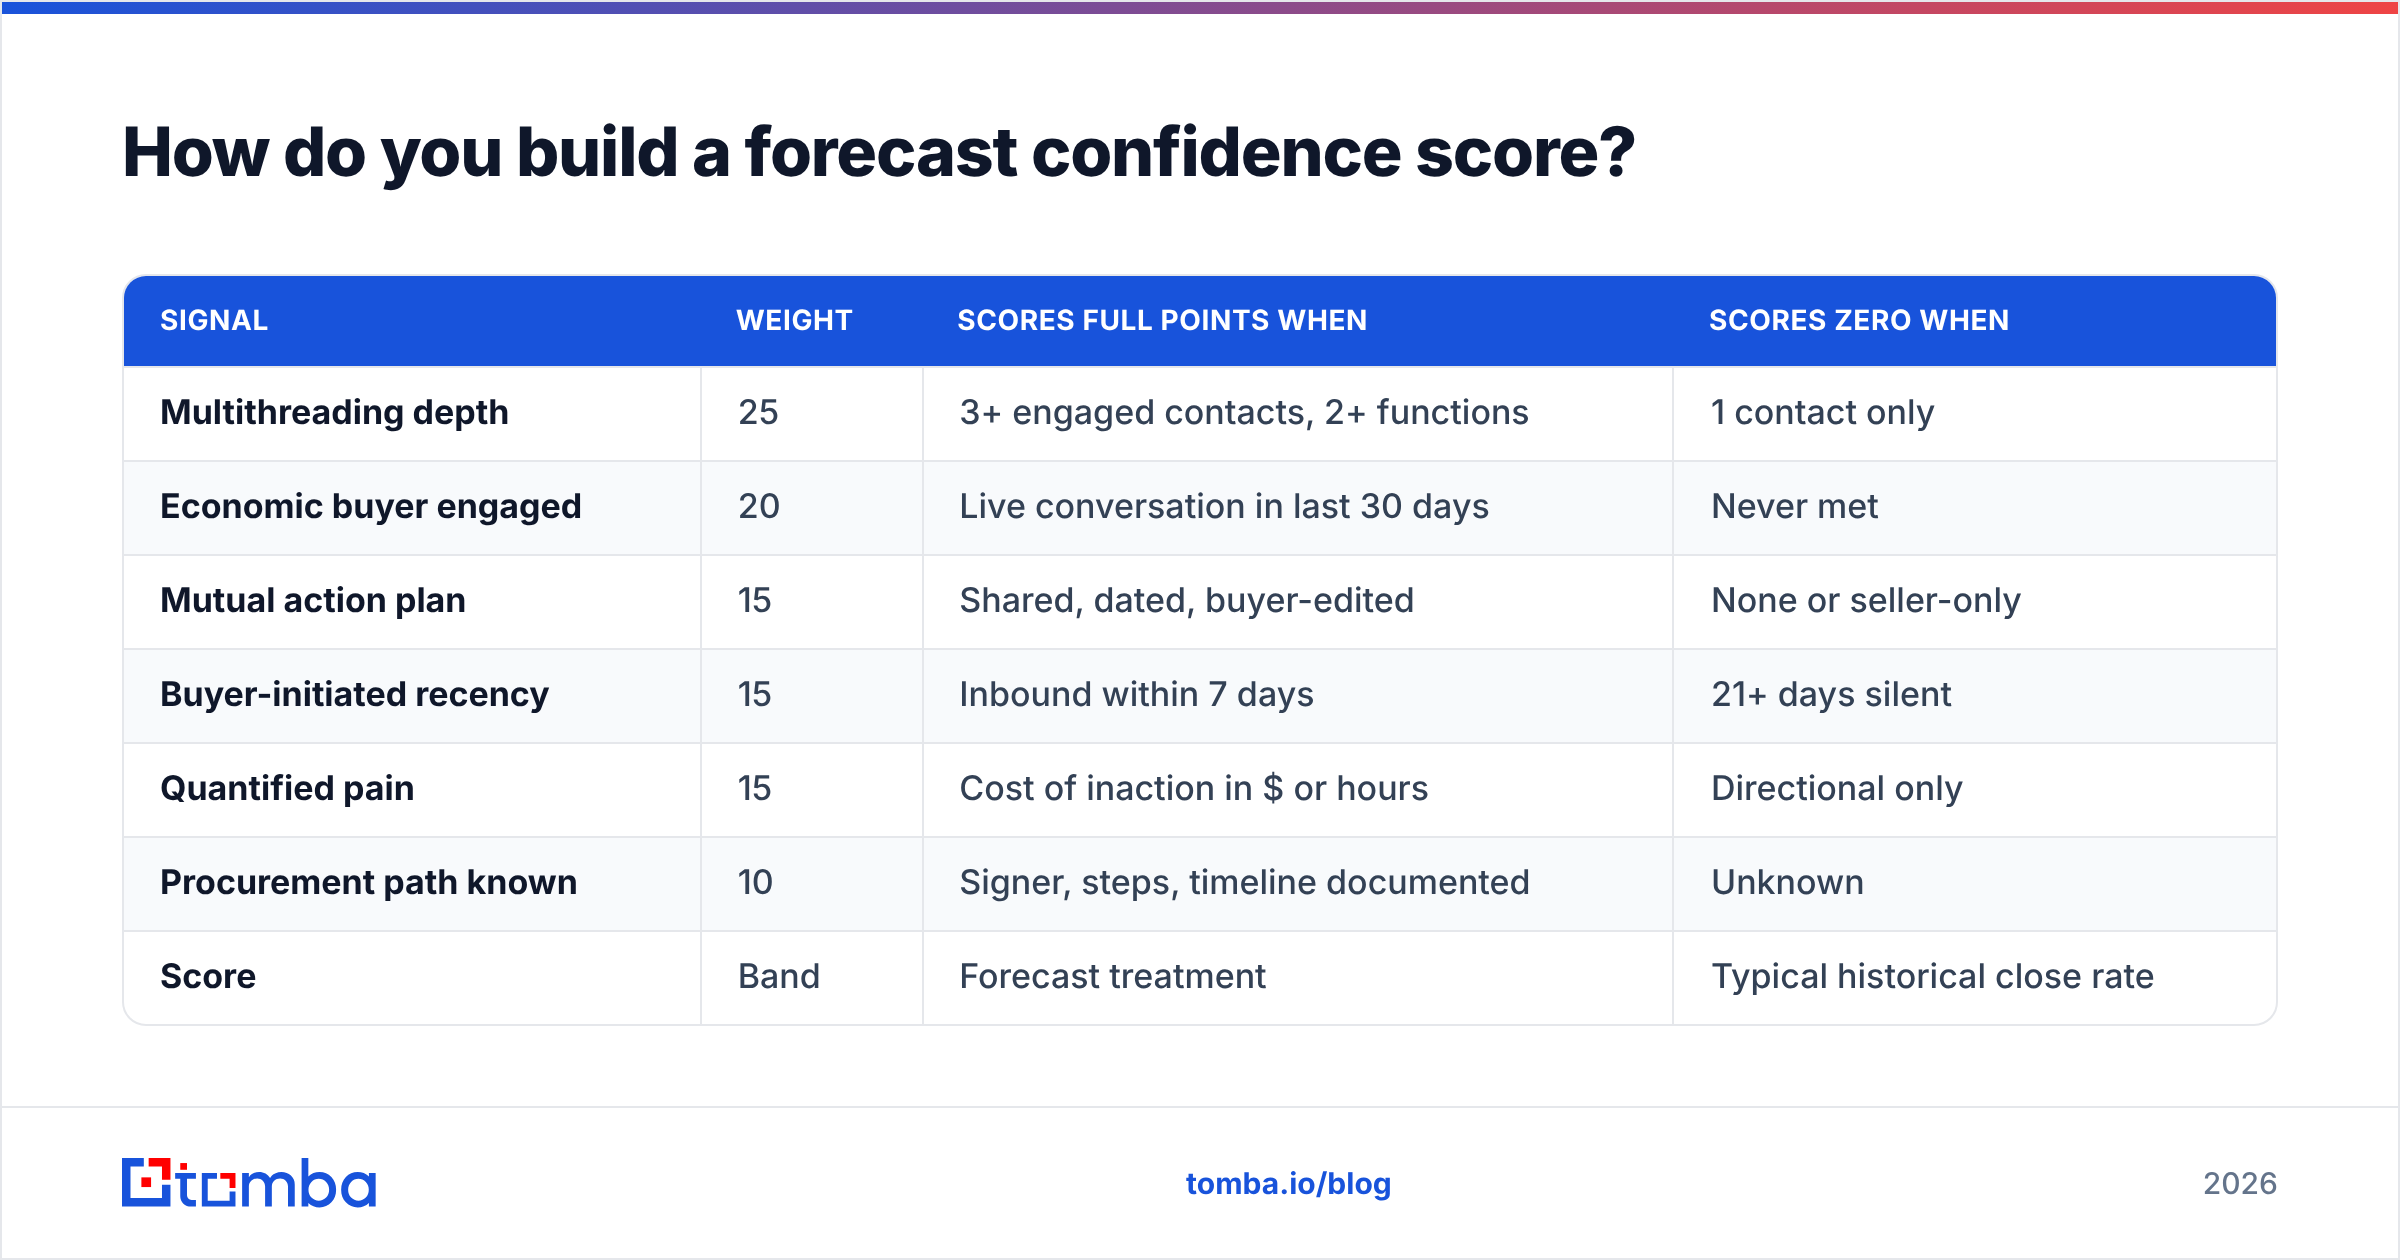
Assign weights to the signals, sum to 100, and score every deal in your commit and best-case categories. Keep it simple enough that a rep can score a deal in 90 seconds.
| Signal | Weight | Scores full points when | Scores zero when |
|---|---|---|---|
| Multithreading depth | 25 | 3+ engaged contacts, 2+ functions | 1 contact only |
| Economic buyer engaged | 20 | Live conversation in last 30 days | Never met |
| Mutual action plan | 15 | Shared, dated, buyer-edited | None or seller-only |
| Buyer-initiated recency | 15 | Inbound within 7 days | 21+ days silent |
| Quantified pain | 15 | Cost of inaction in $ or hours | Directional only |
| Procurement path known | 10 | Signer, steps, timeline documented | Unknown |
Then map the total to commit bands:
| Score | Band | Forecast treatment | Typical historical close rate |
|---|---|---|---|
| 80–100 | Commit | Counts in the number you defend | 75–90% |
| 55–79 | Best case | Upside only, not in commit | 40–60% |
| 30–54 | Pipeline | Excluded from period forecast | 15–30% |
| 0–29 | At risk | Triggers rescue plan or close-lost | Under 10% |
The close-rate column is the part you must calibrate to your own data. Run the score retroactively against the last 200 closed opportunities in your CRM, bucket them, and calculate what actually closed. If your 80+ band closes at 55%, your weights are wrong — usually because you're overweighting activity and underweighting the economic buyer. Recalibrate quarterly.
This is exactly the kind of work that belongs to revenue operations rather than to individual managers. One model, one definition, applied identically across the team — otherwise you're comparing scores that mean different things.
Which forecasting method should you use?#
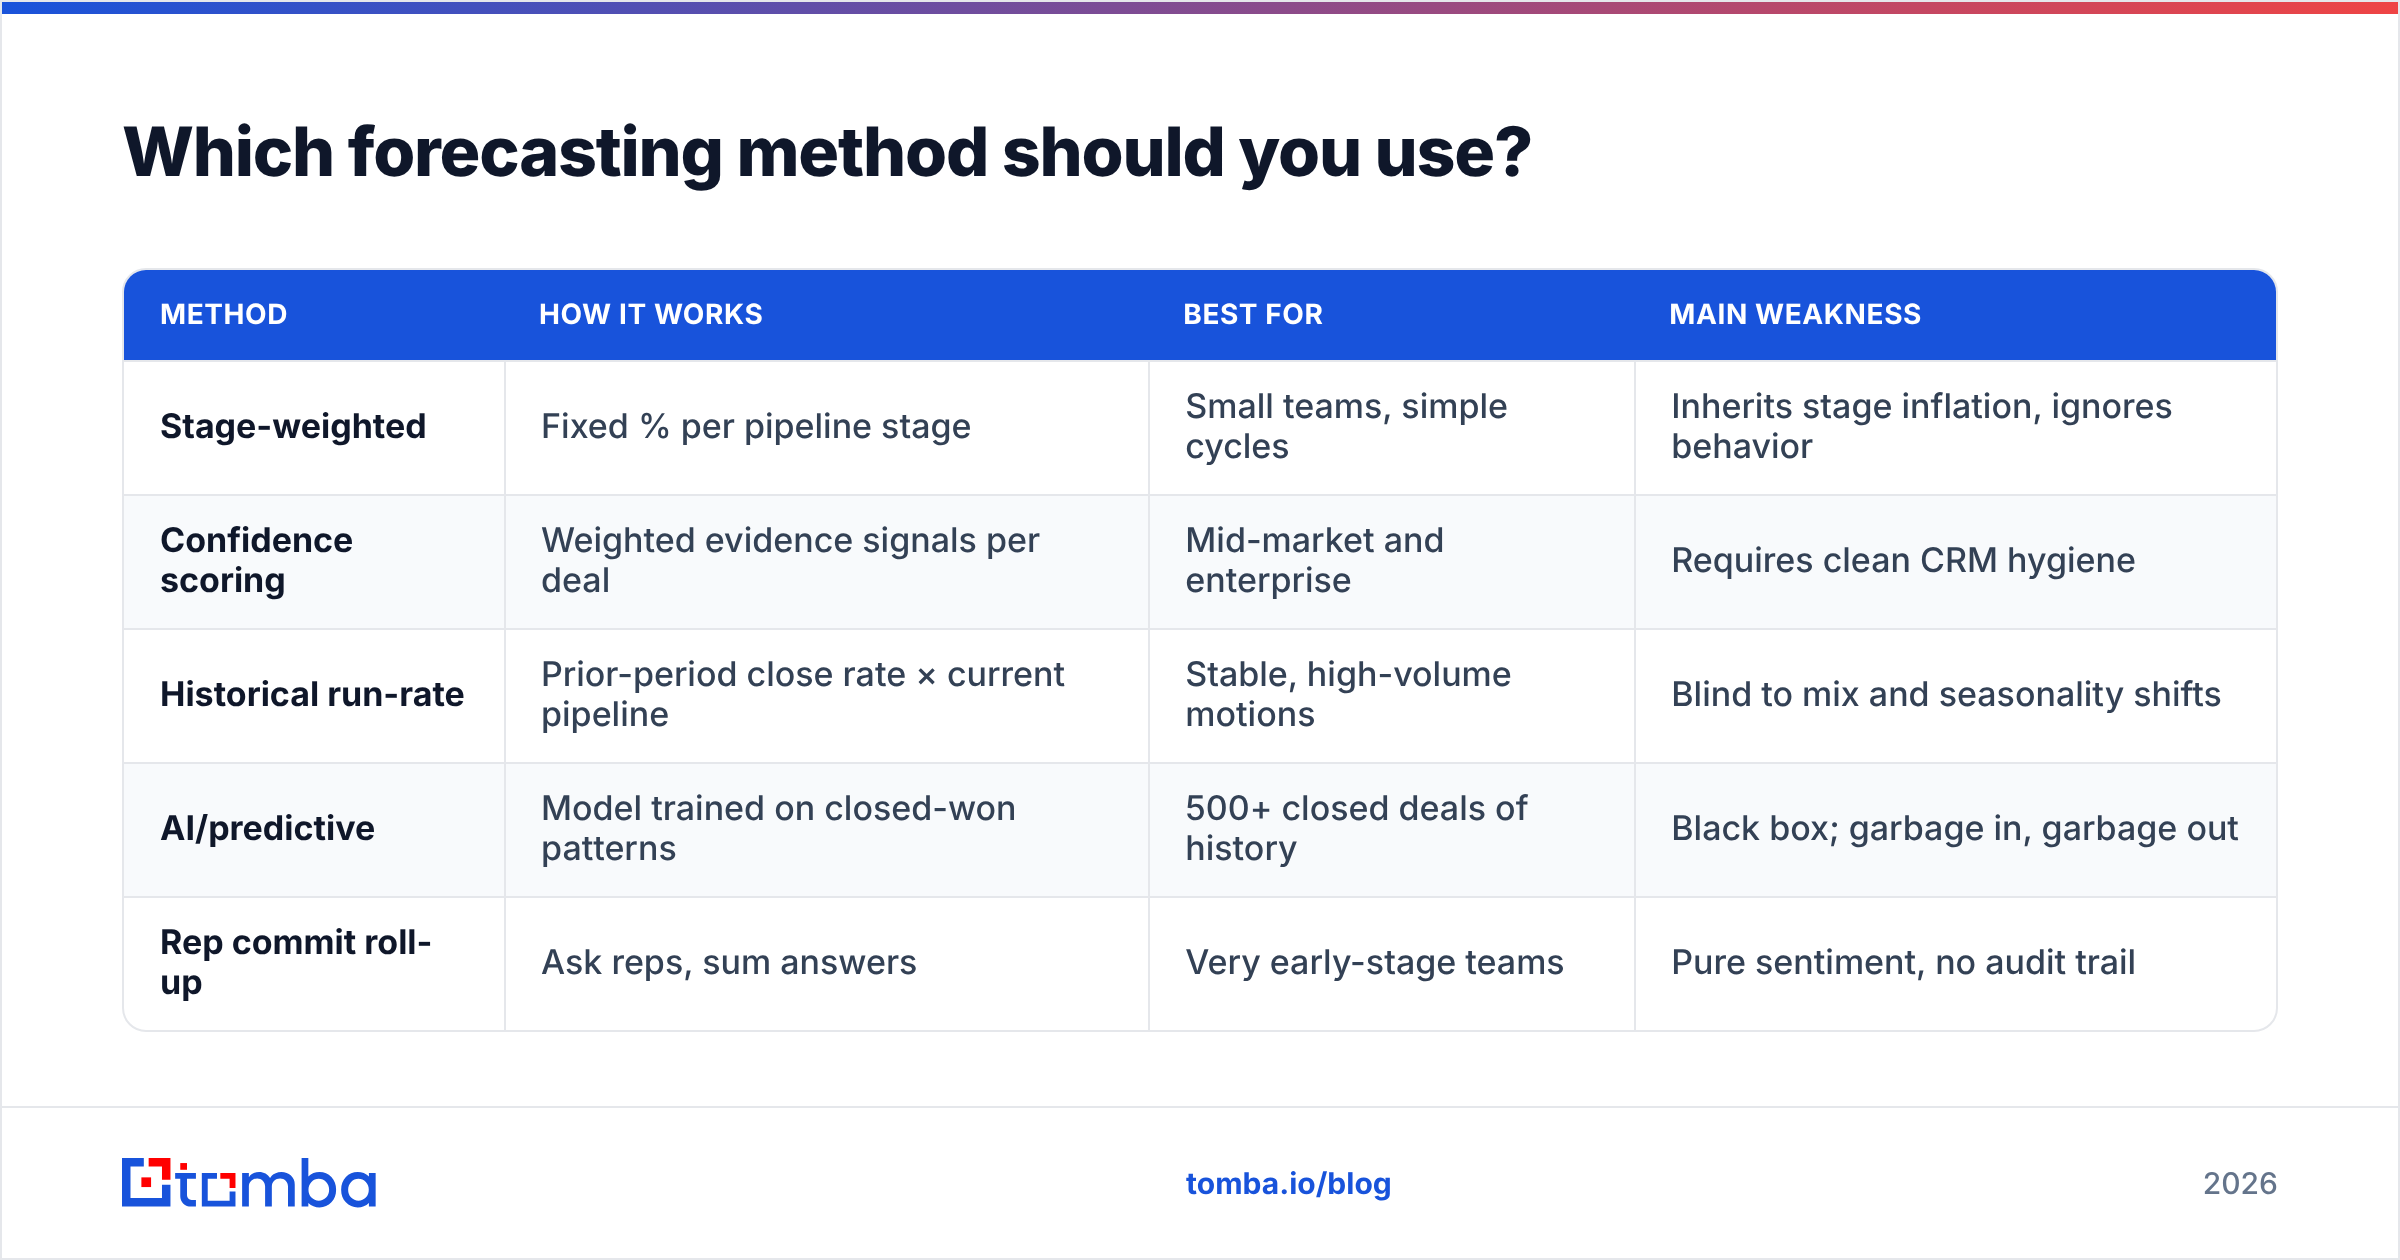
Confidence scoring is one method among several. Most mature teams run two in parallel and investigate the gap.
| Method | How it works | Best for | Main weakness |
|---|---|---|---|
| Stage-weighted | Fixed % per pipeline stage | Small teams, simple cycles | Inherits stage inflation, ignores behavior |
| Confidence scoring | Weighted evidence signals per deal | Mid-market and enterprise | Requires clean CRM hygiene |
| Historical run-rate | Prior-period close rate × current pipeline | Stable, high-volume motions | Blind to mix and seasonality shifts |
| AI/predictive | Model trained on closed-won patterns | 500+ closed deals of history | Black box; garbage in, garbage out |
| Rep commit roll-up | Ask reps, sum answers | Very early-stage teams | Pure sentiment, no audit trail |
The practical combination: run confidence scoring as your primary and historical run-rate as your sanity check. If scoring says $1.4M and run-rate says $900K, something in your pipeline mix has changed and you should find out what before the quarter ends. Vendors like HubSpot and Salesforce ship forecast categories out of the box, and Gartner's sales research is consistently blunt that the constraint is data discipline, not algorithm sophistication.
Predictive AI forecasting is genuinely useful — once you have enough closed-won and closed-lost history for the model to learn from, and once your CRM fields are populated reliably. Before that, an AI forecast is a confident-sounding average of your own bad inputs.
How does data quality change your forecast confidence?#
More than most teams account for. Forecast confidence is downstream of contact data in a way that's easy to miss.
Consider two deals, both in Negotiation, both $60K, both with a close date this month:
- Deal A: four verified stakeholders — champion, economic buyer, a technical evaluator, and a finance contact. All four have replied in the last three weeks.
- Deal B: one contact. Great relationship. No verified email for anyone else at the account.
Under a stage-weighted model these are both 90%. Under confidence scoring, Deal A scores in the 80s and Deal B scores in the 30s. Which one matches your experience of what actually happens?
The fix for Deal B is operational, not motivational. Before the deal review, run a domain search on the account to surface who else works there, verify the addresses so your outreach doesn't bounce into a bad sender reputation, and add a second and third thread. Multithreading is a data problem before it's a selling problem — you can't build a relationship with someone whose contact details you don't have.
The same logic applies to churn risk on your existing book. When your champion's email starts bouncing, that's an early warning your renewal forecast doesn't know about yet.
What does a good forecast review actually look like?#
Change the questions and the meeting changes. A stage-based review asks "where is this deal?" A confidence-based review asks "what's your evidence?"
Run it like this:
- Open with the delta, not the deals. Last period you committed X and closed Y. Why the gap? Name the specific deals that slipped and the specific signal each one was missing.
- Review by score band, not by rep. Every deal scoring 80+ gets 60 seconds. Every deal scoring 55–79 gets three minutes and a stated plan to move a specific signal. Below 55, the question is whether it belongs in this quarter at all.
- Ban the word "should." "They should sign by Friday" is not evidence. "Legal sent redlines Tuesday, signer is confirmed" is.
- Track the score's movement, not just its value. A deal at 62 that was 45 last week is healthier than a deal at 70 that was 85. Direction is signal.
- Close the loop on lost deals. Every closed-lost opportunity should have its final confidence score compared against reality. That's your calibration data.
This makes the review shorter, which is the tell that it's working. Most pipeline meetings are long because nobody has evidence, so everyone narrates instead.
How do you measure whether forecast confidence improved?#
Pick three metrics and hold them fixed for at least two quarters:
Forecast accuracy. Commit at the start of the period vs. closed at the end, as a percentage. Best-in-class teams land within 5–10%. Under 80% accuracy means your bands are miscalibrated, not that your reps are lying.
Slip rate. Percentage of committed deals that push to a later period rather than closing lost. High slip with low loss means your close dates are wrong — a procurement-path problem, usually.
Coverage ratio by band. Pipeline value divided by quota, calculated separately for each confidence band. A 3x coverage number is meaningless if all of it sits below 55.
Watch your win rate alongside these. If forecast accuracy improves while win rate holds steady, you got more honest. If both move up, your scoring model is also teaching reps what a good deal looks like — which is the real return on this work.
One caution: don't tie compensation to forecast accuracy directly. The instant you do, reps will forecast low and beat it, and you'll have optimized for sandbagging instead of truth.
Where should you start this quarter?#
Do it in this order and you'll have a working model in two weeks:
- Export your last 200 closed opportunities and score them retroactively against the six signals.
- Calculate the actual close rate per band. Adjust weights until the bands separate cleanly.
- Add the six fields to your CRM as required-on-commit.
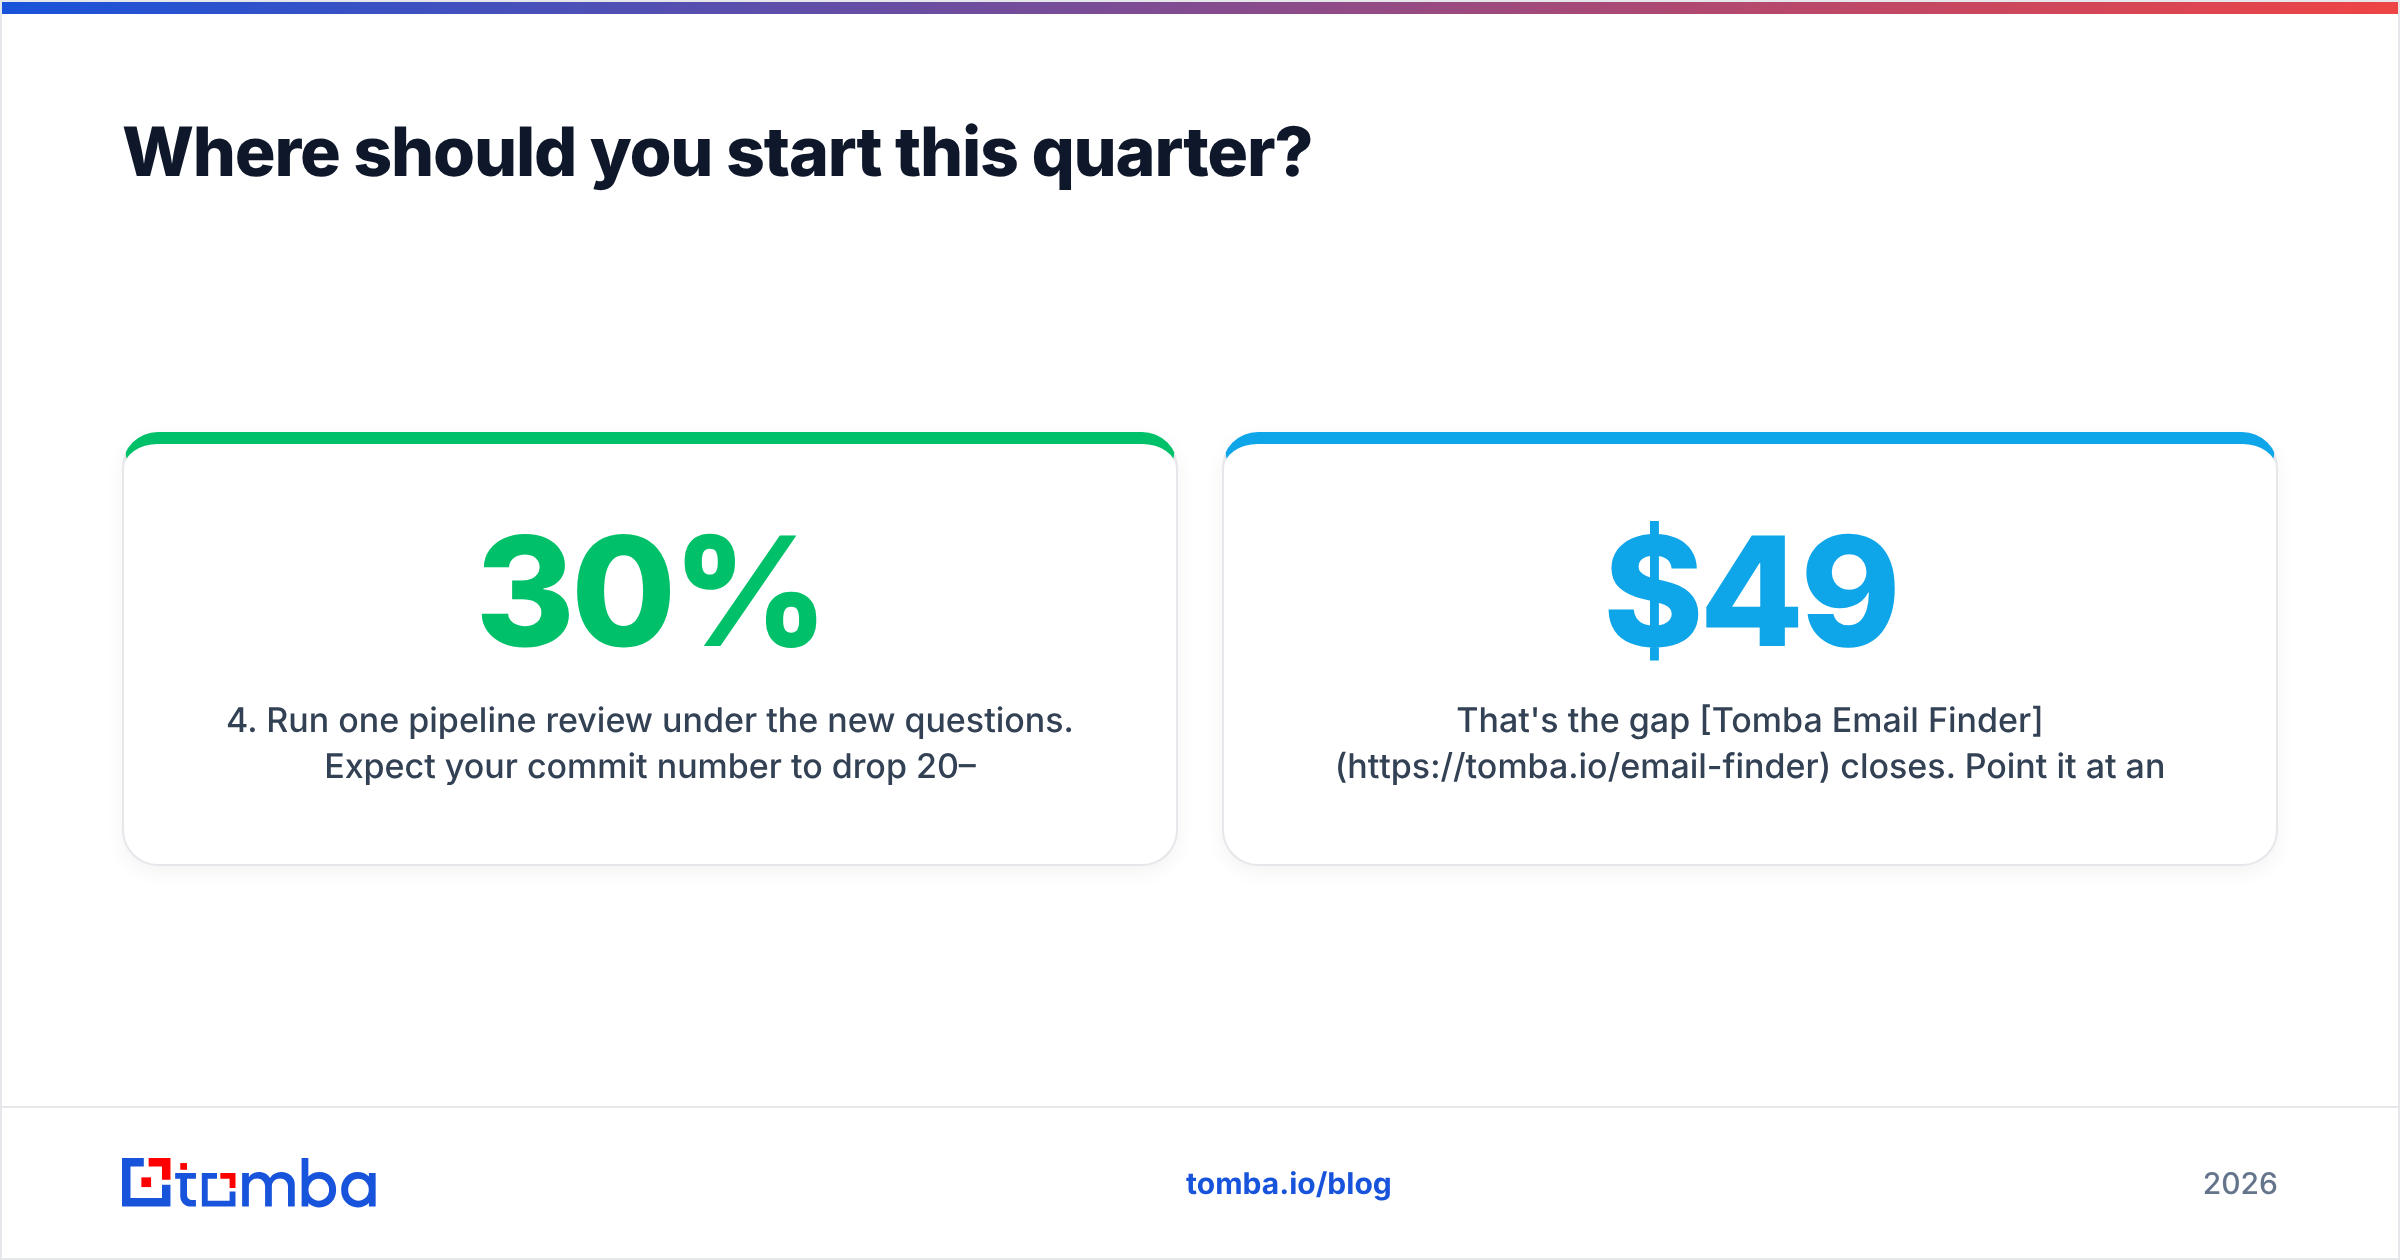
- Run one pipeline review under the new questions. Expect your commit number to drop 20–30% in week one. That drop is the honest number finally surfacing.
- Fix the multithreading gap on every deal scoring below 55 — starting with finding and verifying the contacts you're missing.
Step five is where most models stall, because the data isn't there. If your reps can't name the economic buyer at an account, no scoring framework will save the forecast.
That's the gap Tomba Email Finder closes. Point it at an account domain and get verified, deliverable contacts for the stakeholders your deal is missing — the finance lead, the security reviewer, the second champion — so multithreading becomes a five-minute task instead of a quarter-long excuse. The free tier gives you 25 searches a month to test it against your own weakest deals; paid plans start at $49/mo on Starter, with Growth at $99/mo when your whole team is working the same accounts. Check Tomba pricing for the full breakdown, then go score your commit list honestly.
Related guides#
Ready to find emails that actually work?
Join 150,000+ professionals who stopped guessing and started sending. Free credits on signup — no credit card required.
Get the Tomba newsletter
Practical outbound tactics and product updates — once every two weeks.
About the author