Forecast Management in 2026: A Complete B2B Sales Guide
Most B2B forecasts miss because the pipeline data underneath them is stale, not because the math is wrong. Here's how forecast management actually works: methods, cadence, tooling, and the metrics that prove it.
TL;DR
- Forecast management is the operating system around your pipeline number: how deals get categorized, who commits to what, how often the number is challenged, and how misses get diagnosed.
- Most B2B forecasts miss by 15-30% not because the model is wrong, but because the CRM records feeding it are stale, duplicated, or missing the contacts who actually decide.
- The four common methods (stage-weighted, historical, multivariate/AI, and rep-committed roll-up) all fail differently. Serious teams run at least two in parallel and reconcile the gap.
- A weekly cadence with fixed definitions beats an expensive forecasting tool bolted onto undisciplined data. Fix definitions first, buy software second.
- Track forecast accuracy, commit slippage, and pipeline coverage as first-class metrics. If you don't measure the miss, you'll repeat it every quarter.
What is forecast management?#
Forecast management is the discipline of producing, challenging, and correcting a revenue prediction on a fixed cadence — not the act of typing a number into a spreadsheet at quarter-end.
Think of it like a weather service, not a fortune teller. A fortune teller gives you one confident number. A weather service maintains instruments, runs multiple models, publishes a confidence interval, and — critically — scores yesterday's forecast against what actually happened so tomorrow's gets better. Forecast management is the second thing.
Technically, it spans four moving parts:
- Data layer — the opportunity records, contact data, activity logs, and firmographics that describe each deal. Garbage here poisons everything downstream.
- Categorization rules — what "Commit," "Best Case," and "Pipeline" actually mean, written down, with entry and exit criteria a new rep can apply without asking their manager.
- Cadence and ritual — the weekly forecast call, the deal inspection, the escalation path when a Commit deal goes quiet.
- Accountability loop — post-quarter analysis of where the number was wrong and which behaviors caused it.
Teams that buy forecasting software but skip parts 2 through 4 end up with a very expensive dashboard that displays the same wrong number faster.
Why do most B2B forecasts miss?#
Because the inputs decay faster than anyone updates them. A few specific failure modes show up over and over:
- Stale contact data. The champion changed jobs four months ago, the opportunity still lists them as primary contact, and nobody noticed until the deal went dark. B2B contact records decay roughly 2-3% per month through job changes alone — over a 9-month enterprise cycle, that's a quarter of your buying committee gone.
- Single-threaded deals scored as multi-threaded. A $200K opportunity with one known contact is not a Commit deal, no matter what the rep says. Most CRMs won't stop you from calling it one.
- Happy-ears categorization. "Commit" drifts into meaning "I want this to close" rather than "the customer told me the signature date." Without written criteria, every rep uses a private definition.
- Stage inflation. Deals get pushed to "Negotiation" because the rep had a good call, not because a contract is in redlines. Stage-weighted models then multiply that optimism by a probability percentage and present it as math.
- No penalty for slippage. If a deal can slip from Q1 to Q2 to Q3 with no forecast consequence, reps learn that a Commit is a free option.

Notice that only one of those five is a modeling problem. The rest are data and behavior problems — which is why the fix starts with hygiene, not with a new algorithm.
What are the main forecast management methods?#
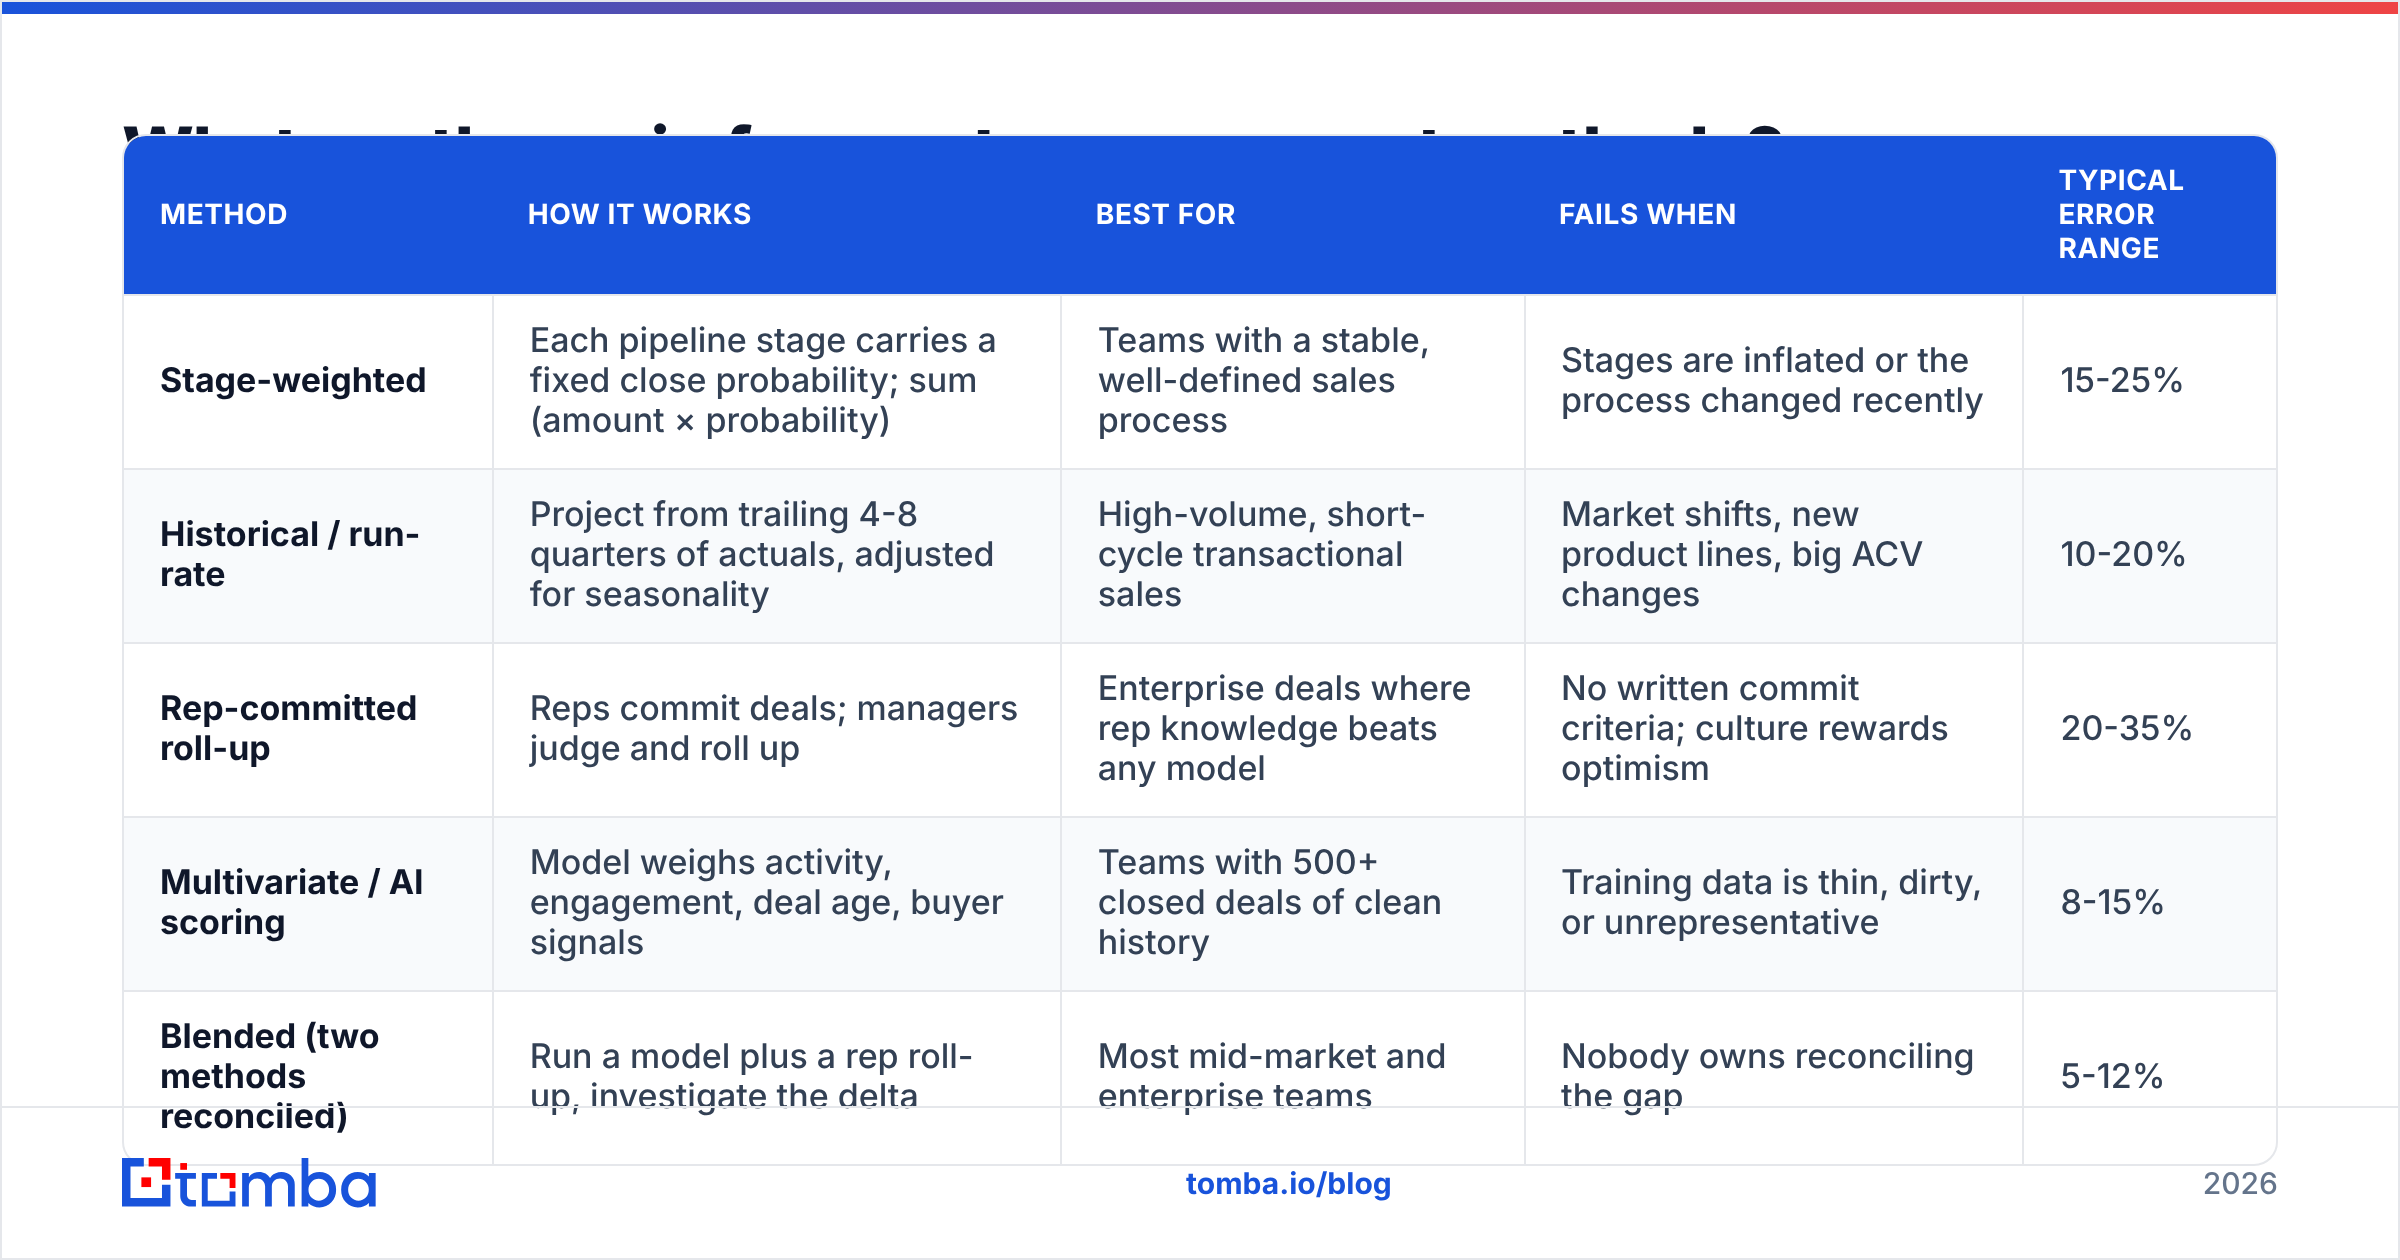
Four approaches dominate B2B. None is universally correct; each has a failure profile you need to know before you pick.
| Method | How it works | Best for | Fails when | Typical error range |
|---|---|---|---|---|
| Stage-weighted | Each pipeline stage carries a fixed close probability; sum (amount × probability) | Teams with a stable, well-defined sales process | Stages are inflated or the process changed recently | 15-25% |
| Historical / run-rate | Project from trailing 4-8 quarters of actuals, adjusted for seasonality | High-volume, short-cycle transactional sales | Market shifts, new product lines, big ACV changes | 10-20% |
| Rep-committed roll-up | Reps commit deals; managers judge and roll up | Enterprise deals where rep knowledge beats any model | No written commit criteria; culture rewards optimism | 20-35% |
| Multivariate / AI scoring | Model weighs activity, engagement, deal age, buyer signals | Teams with 500+ closed deals of clean history | Training data is thin, dirty, or unrepresentative | 8-15% |
| Blended (two methods reconciled) | Run a model plus a rep roll-up, investigate the delta | Most mid-market and enterprise teams | Nobody owns reconciling the gap | 5-12% |
The blended row is the practical answer for most teams. The gap between what your model says and what your reps commit is the single most useful diagnostic signal you have. If the model says $2.1M and reps commit $3.4M, you don't average them — you go find the twelve deals causing the delta and inspect them individually.
How do you build a forecast cadence that actually works?#
Cadence beats sophistication. A weekly 45-minute call run with discipline outperforms a monthly review with better software.
Monday: data hygiene. Before the call, every opportunity closing this quarter needs a next step with a date, a named economic buyer, and a close date the rep would bet on. Deals failing that check drop out of Commit automatically. Make the rule mechanical so it isn't a negotiation.
Tuesday: the forecast call. Not a status recital. Managers inspect the three riskiest Commit deals and the three biggest Best Case deals — roughly 30 minutes of six deals, not two hours of forty. Every other deal is reviewed asynchronously in the CRM.
Mid-quarter: the delta review. Compare the algorithmic forecast against the committed roll-up. Investigate any deal contributing more than 5% of the gap.
Post-quarter: the miss autopsy. For every deal that was Commit and didn't close, record one root cause from a fixed list: no budget, lost to competitor, no decision, champion left, timeline slipped, disqualified late. Six categories, no free text. After two quarters you'll have a pattern that tells you exactly which stage of your process is lying to you.
Salesforce's own guidance on sales forecasting makes a similar point: the ritual matters more than the formula, because the ritual is what forces bad data to surface.
Which forecast management tools should you compare?#
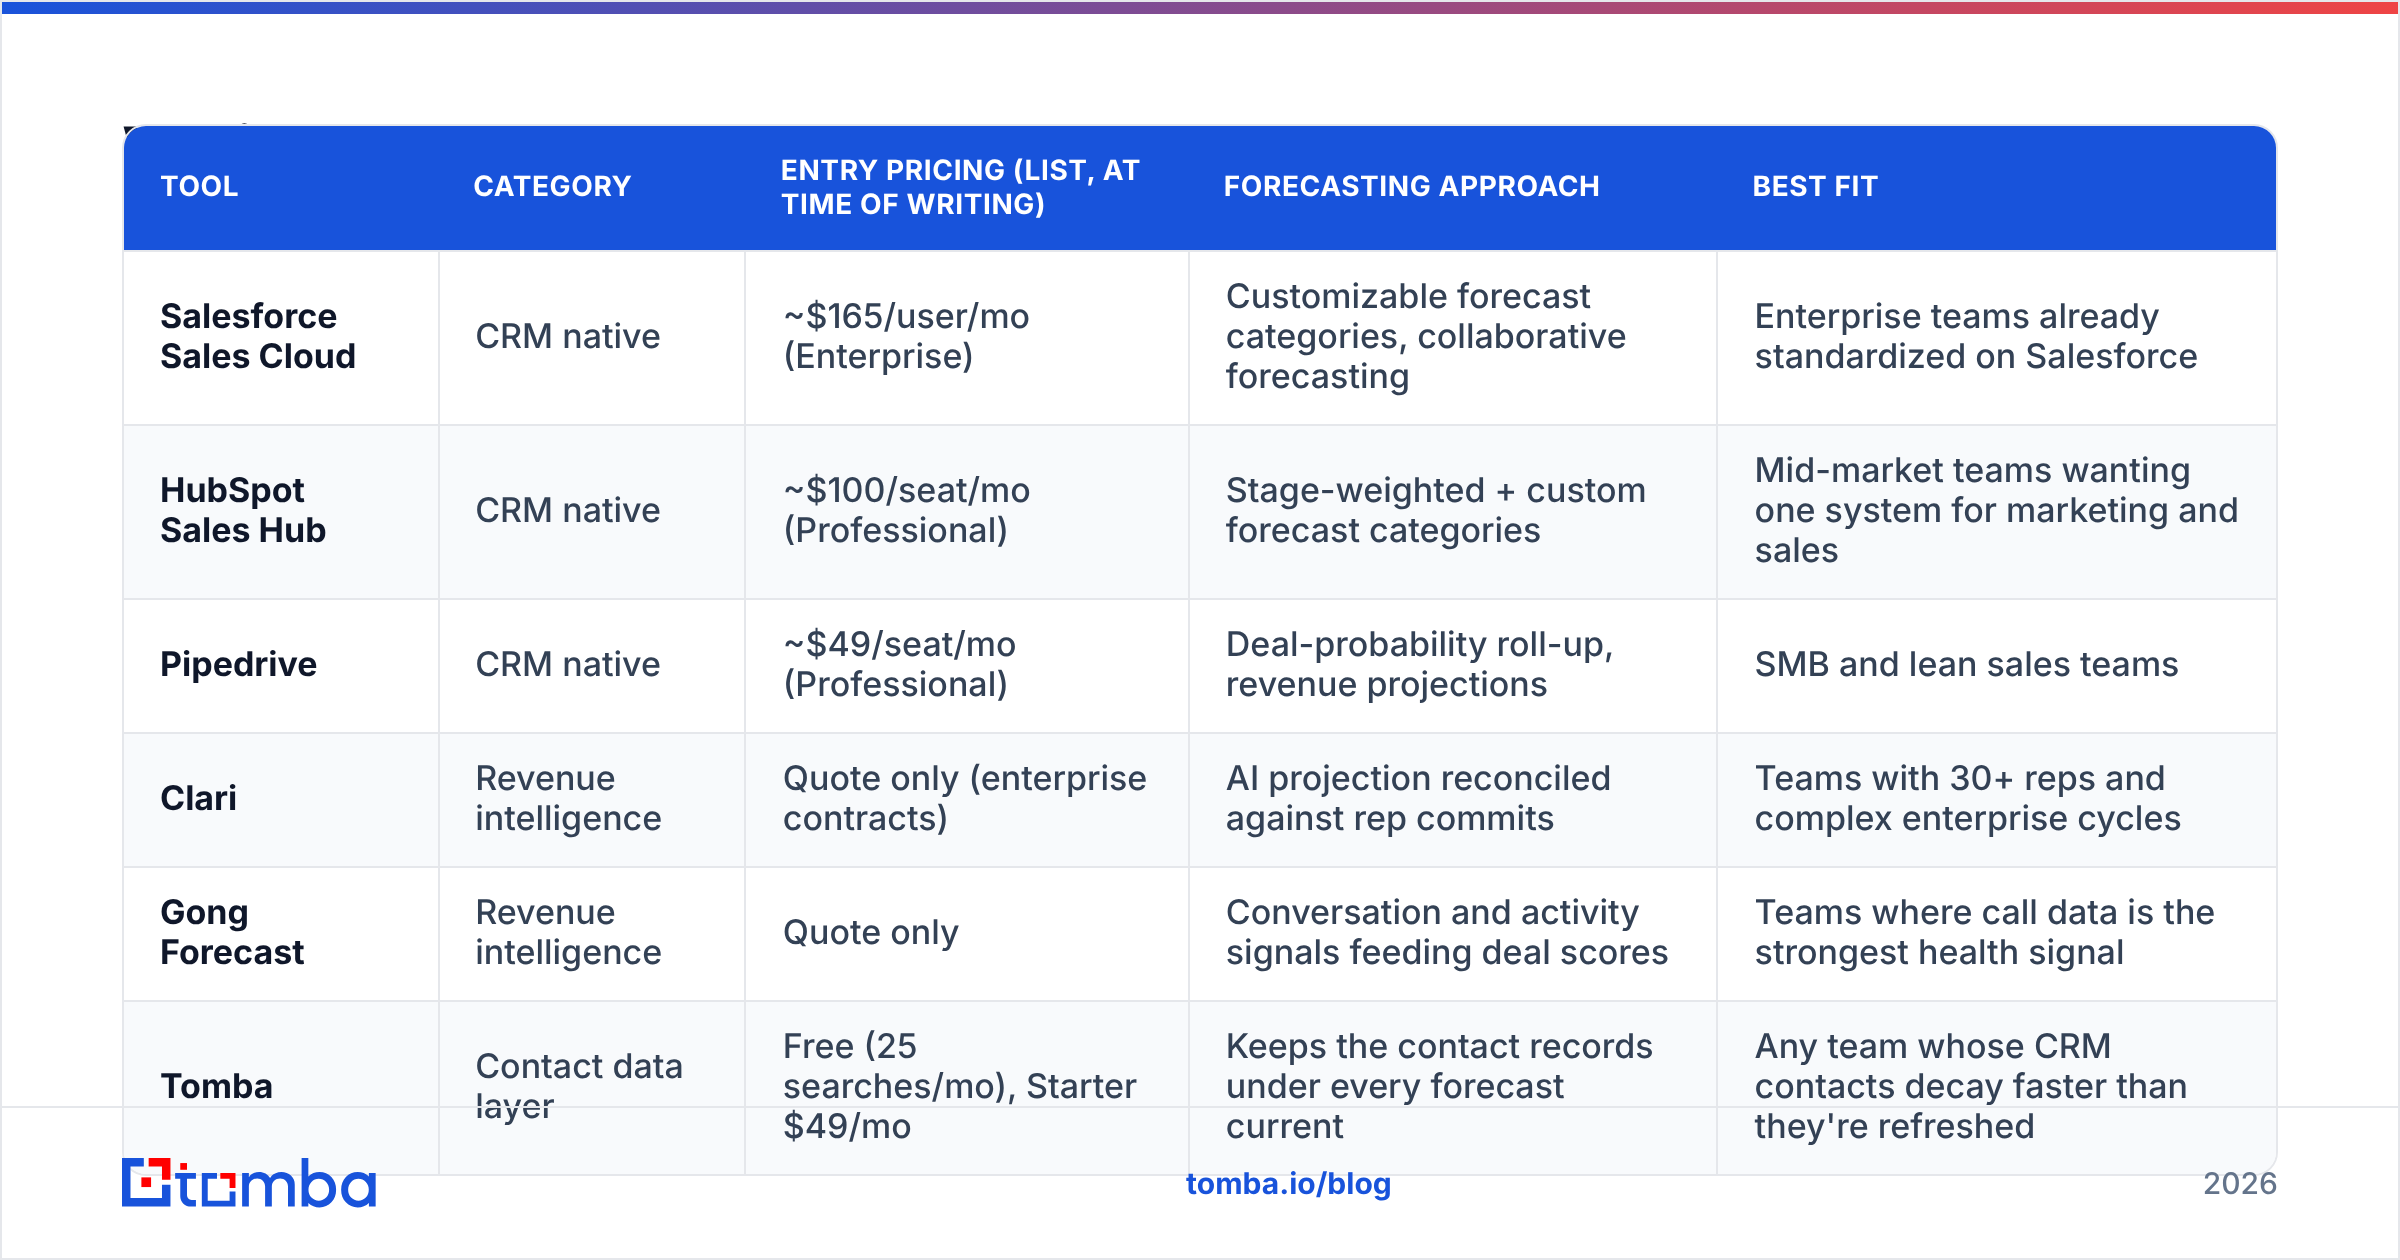
Tooling splits into three tiers: your CRM's native forecasting, a dedicated revenue intelligence layer, and the data providers that keep the underlying records accurate. Most teams need all three, but in that order of priority.
| Tool | Category | Entry pricing (list, at time of writing) | Forecasting approach | Best fit |
|---|---|---|---|---|
| Salesforce Sales Cloud | CRM native | ~$165/user/mo (Enterprise) | Customizable forecast categories, collaborative forecasting | Enterprise teams already standardized on Salesforce |
| HubSpot Sales Hub | CRM native | ~$100/seat/mo (Professional) | Stage-weighted + custom forecast categories | Mid-market teams wanting one system for marketing and sales |
| Pipedrive | CRM native | ~$49/seat/mo (Professional) | Deal-probability roll-up, revenue projections | SMB and lean sales teams |
| Clari | Revenue intelligence | Quote only (enterprise contracts) | AI projection reconciled against rep commits | Teams with 30+ reps and complex enterprise cycles |
| Gong Forecast | Revenue intelligence | Quote only | Conversation and activity signals feeding deal scores | Teams where call data is the strongest health signal |
| Tomba | Contact data layer | Free (25 searches/mo), Starter $49/mo | Keeps the contact records under every forecast current | Any team whose CRM contacts decay faster than they're refreshed |
Two honest caveats. First, revenue intelligence platforms are priced for teams with real headcount — if you have eight reps, the ROI usually isn't there and your CRM's native forecasting will do the job. Second, no tool in the top five rows fixes bad contact data; they all consume whatever your CRM holds. Comparing categories on G2 is useful for feature depth, but read the reviews for implementation time, not just ratings.
How does data quality change forecast accuracy?#
More than any model change you'll ever make. Here's the causal chain, spelled out:
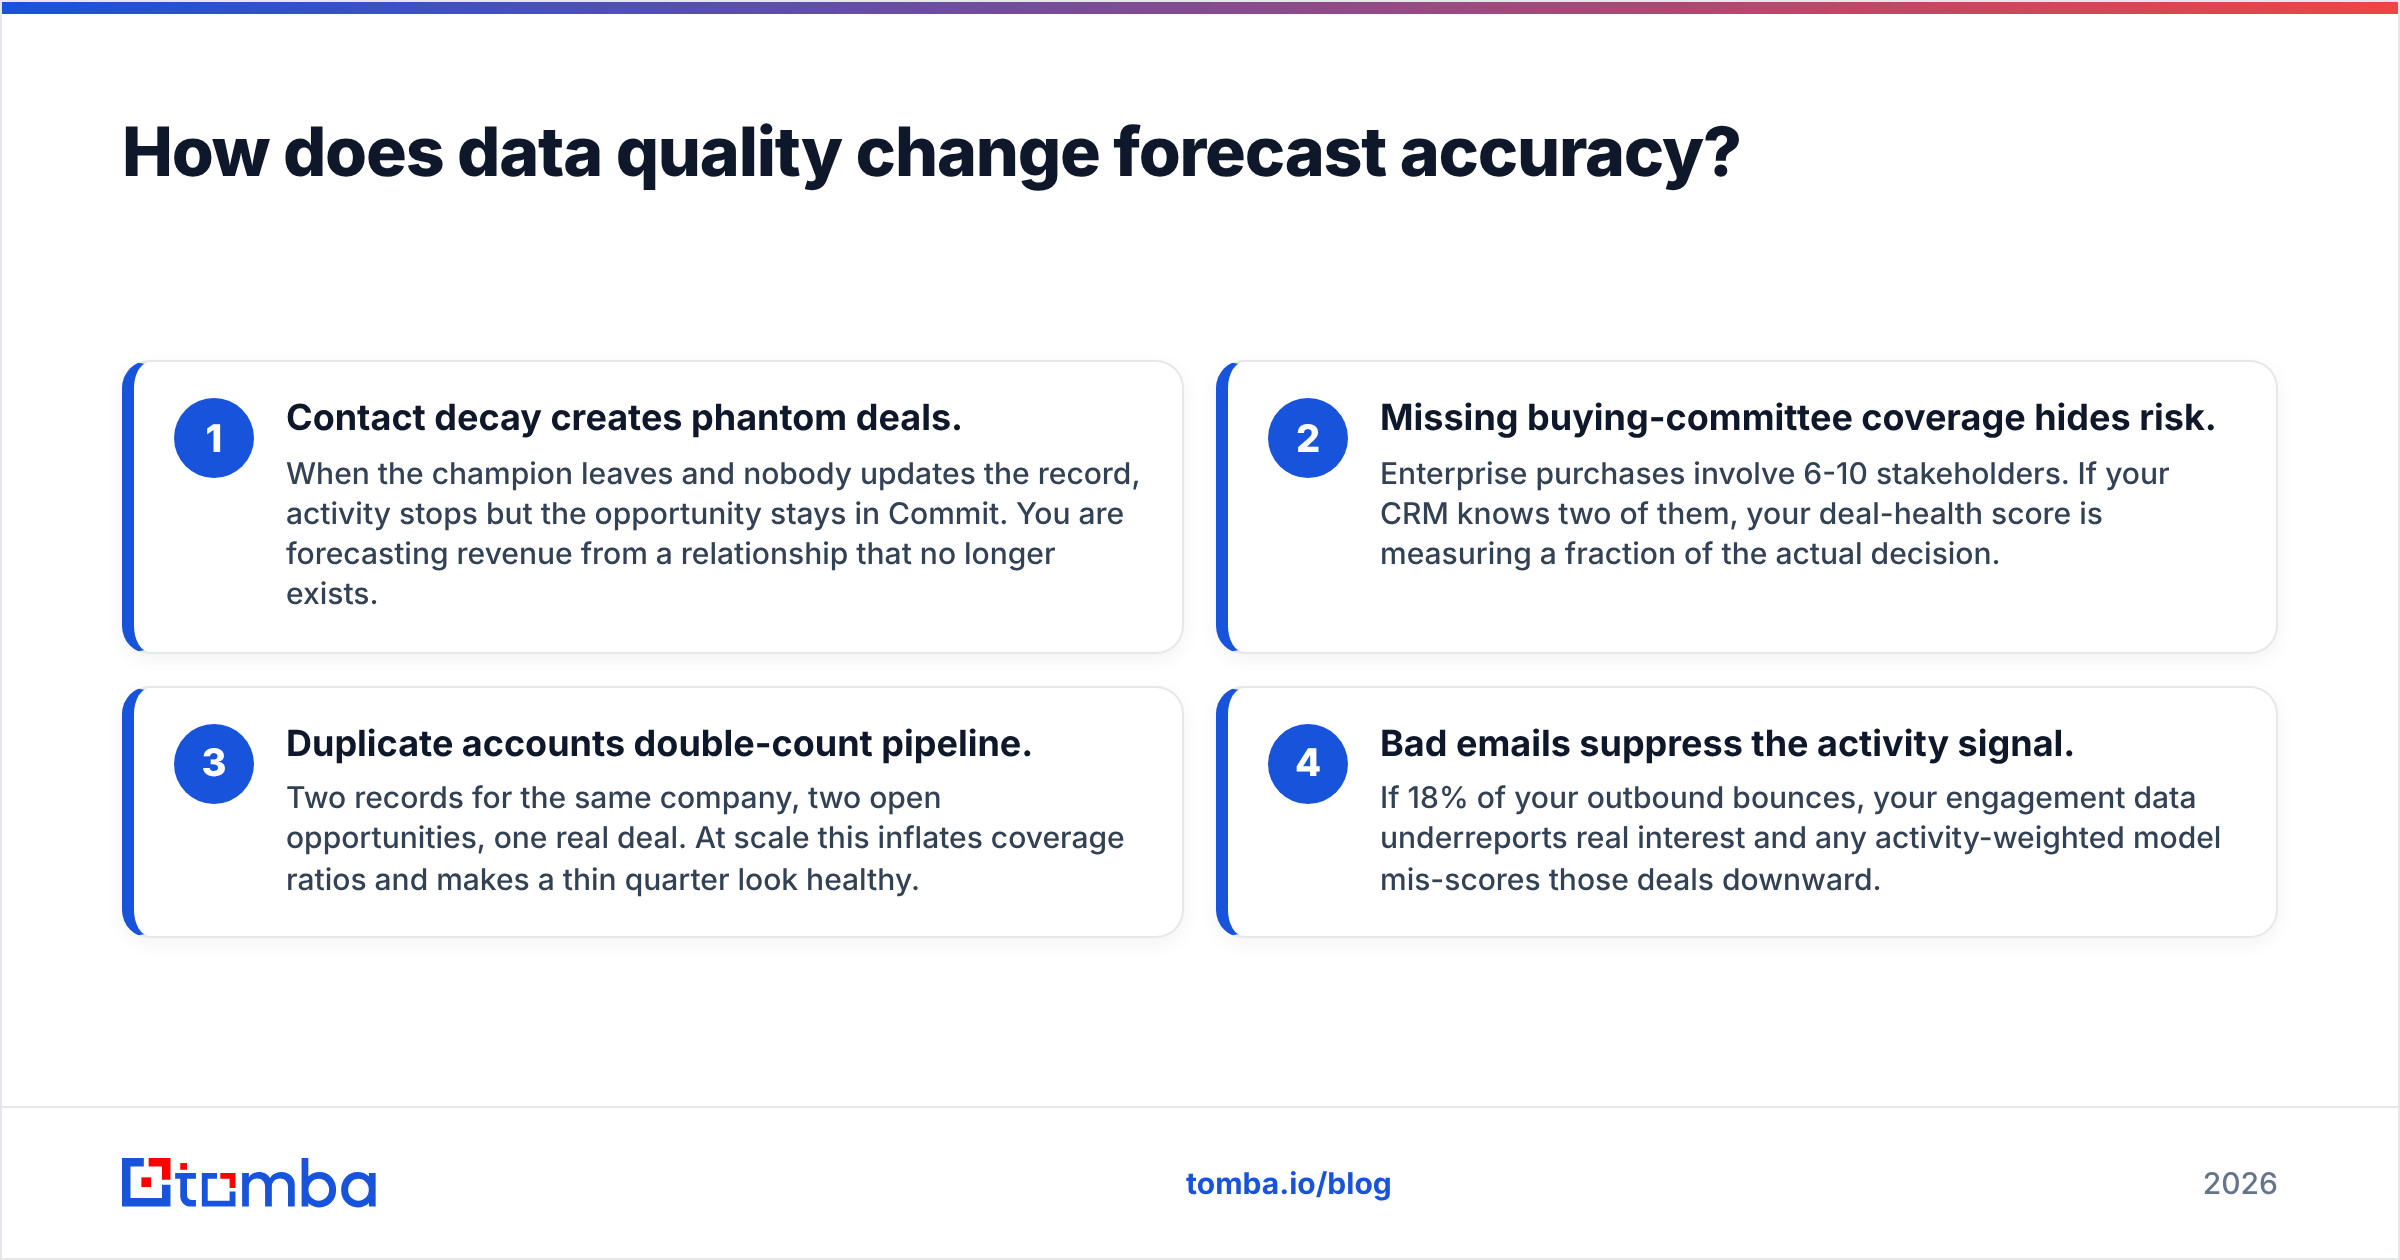
- Contact decay creates phantom deals. When the champion leaves and nobody updates the record, activity stops but the opportunity stays in Commit. You are forecasting revenue from a relationship that no longer exists.
- Missing buying-committee coverage hides risk. Enterprise purchases involve 6-10 stakeholders. If your CRM knows two of them, your deal-health score is measuring a fraction of the actual decision.
- Duplicate accounts double-count pipeline. Two records for the same company, two open opportunities, one real deal. At scale this inflates coverage ratios and makes a thin quarter look healthy.
- Bad emails suppress the activity signal. If 18% of your outbound bounces, your engagement data underreports real interest and any activity-weighted model mis-scores those deals downward.
The remedy is unglamorous: a scheduled refresh of the contact layer on every open opportunity above a dollar threshold. Re-verify the primary contact monthly, enrich the account with additional stakeholders quarterly, and run a bulk verify across the whole open-pipeline contact set before each quarter starts. Teams that do this typically cut forecast error by a third before touching their model at all.
If your stack runs on Salesforce or HubSpot, wire the refresh directly into the CRM through a Salesforce integration or HubSpot integration so enrichment happens on record creation rather than as a quarterly cleanup project nobody volunteers for.
What metrics prove your forecast management is improving?#
Four numbers, tracked every quarter, no exceptions:
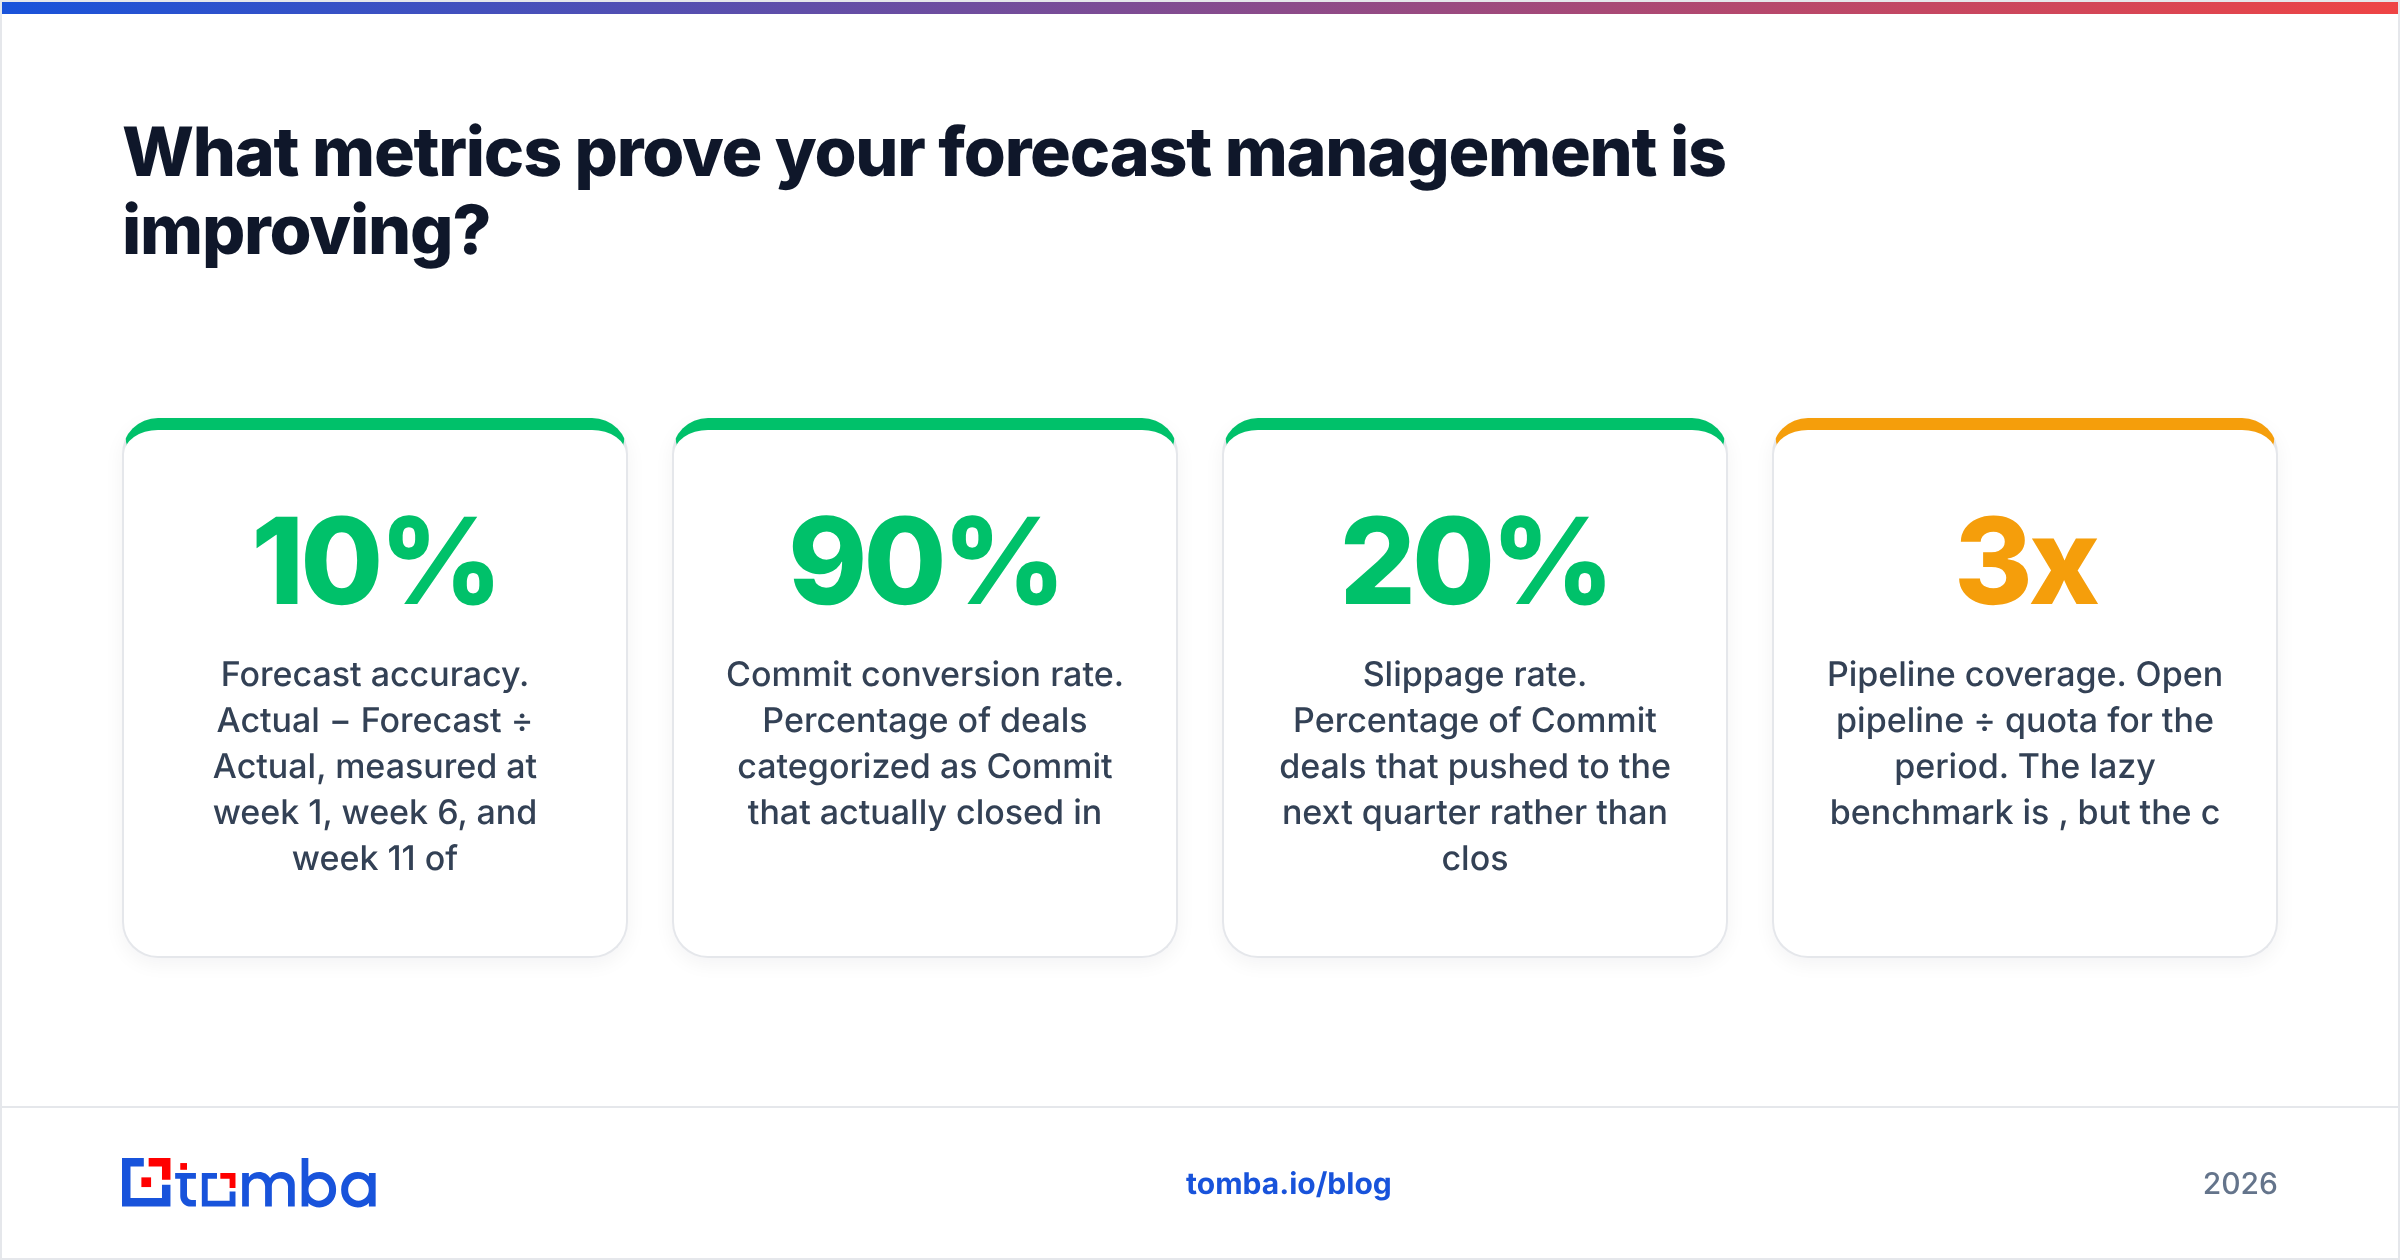
- Forecast accuracy. |Actual − Forecast| ÷ Actual, measured at week 1, week 6, and week 11 of the quarter. Good B2B teams land inside 10% by week 6. Anything above 25% at week 6 means your categorization rules aren't working.
- Commit conversion rate. Percentage of deals categorized as Commit that actually closed in the forecasted period. Target 90%+. Below 75% and "Commit" has become a wish.
- Slippage rate. Percentage of Commit deals that pushed to the next quarter rather than closing or losing. Chronic slippage above 20% usually means close dates are set by rep hope rather than customer procurement timelines.
- Pipeline coverage. Open pipeline ÷ quota for the period. The lazy benchmark is 3x, but the correct number is 1 ÷ your actual win rate. A team closing 33% needs 3x. A team closing 18% needs 5.5x and doesn't know it.
Report all four to the same audience, in the same format, every quarter. Gartner's sales research consistently finds that forecast discipline correlates more strongly with attainment than any individual tool purchase — largely because measurement changes behavior before software does.
What should a 90-day forecast management rollout look like?#
Days 1-30: define and clean. Write the forecast category definitions in one page. Get every manager to sign off. Simultaneously, audit contact data on all open opportunities — verify primary contacts, flag single-threaded deals, dedupe accounts. Expect to find 20-40% of records need work.
Days 31-60: run the cadence. Launch the weekly call with the new definitions. Don't change tools yet. Track forecast accuracy from day one so you have a baseline to improve against. Expect the number to look worse initially — that's honesty replacing optimism, not a regression.
Days 61-90: reconcile and automate. Add a second forecasting method (usually historical run-rate, since it needs no new software) and start reviewing the delta against the rep roll-up. Automate the data refresh so hygiene isn't a manual chore. Only now evaluate whether a revenue intelligence platform earns its cost.
Skip to day 61 and you'll automate a broken process at speed. The order matters.
Where should you start this week?#
Pull your open pipeline for the current quarter and check one thing: how many Commit deals have a primary contact whose email hasn't been verified in the last 90 days. For most teams the answer is uncomfortable, and it explains a meaningful share of last quarter's miss.
Fixing that is the cheapest forecast accuracy gain available to you. Use the Tomba Email Finder to re-establish contact on deals that went quiet, find the additional stakeholders your single-threaded opportunities are missing, and keep the contact layer under your forecast current instead of decaying. The free tier covers 25 searches a month if you want to test it against a handful of at-risk deals first; Tomba pricing starts at $49/mo when you're ready to run it across the whole pipeline.
A forecast is only as honest as the data underneath it. Start there.
Related guides#
Ready to find emails that actually work?
Join 150,000+ professionals who stopped guessing and started sending. Free credits on signup — no credit card required.
Get the Tomba newsletter
Practical outbound tactics and product updates — once every two weeks.
About the author