Forecasting Metrics: The 12 Numbers That Predict Revenue
Most forecast dashboards measure the past and call it prediction. Here are the forecasting metrics that actually move ahead of the number, how to calculate each one, and the three vanity metrics to delete this quarter.
TL;DR
- Forecasting metrics split into three tiers: leading (coverage, new pipeline created, meeting rate), coincident (stage velocity, slip rate, commit-to-close), and lagging (attainment, MAPE, win rate). Most dashboards track only the lagging tier, which is why forecasts break late.
- The single most useful accuracy number is weighted MAPE on the commit category, measured weekly, not one number at quarter end.
- Slip rate and pipeline coverage age predict a miss 4–6 weeks before attainment does.
- Forecast accuracy is capped by data accuracy. Bad contact and account data inflates pipeline you were never going to close.
- Delete three vanity metrics: raw activity counts, unweighted pipeline totals, and rep confidence percentages with no calibration history.
What are forecasting metrics?#
Forecasting metrics are the numbers you use to predict what revenue will close in a defined period, and to measure how wrong your last prediction was. That second half matters more than most teams admit. A forecast without an error history is a guess with a spreadsheet attached.
Think of it like a weather station. Anyone can report yesterday's rainfall — that's attainment. The forecast comes from barometric pressure, wind direction, and humidity readings taken now. Sales works the same way: closed-won is rainfall, pipeline creation rate and stage velocity are the pressure gauges.
Technically, a forecasting metric is any measurement that (a) has a defined formula, (b) is available before the period closes, and (c) has a demonstrated statistical relationship to the final number in your business. If a metric fails test (c), it is reporting, not forecasting.
Three categories are worth separating, because they answer different questions and fail in different ways:
- Leading indicators — measured 30–90 days ahead of revenue. Pipeline created, qualified meeting rate, coverage ratio by segment. These tell you whether the next quarter is at risk.
- Coincident indicators — measured during the period. Stage conversion, deal velocity, slip rate, commit-category movement. These tell you whether this quarter is at risk while you can still act.
- Lagging indicators — measured after close. Attainment, forecast error (MAPE/MPE), average deal size, win rate. These grade your process and calibrate next period's model.
- Diagnostic indicators — not forecasts themselves, but explain the others. Data completeness rate, contact bounce rate, duplicate account rate. When these degrade, every tier above degrades with them.
Which forecasting metrics actually matter in 2026?#
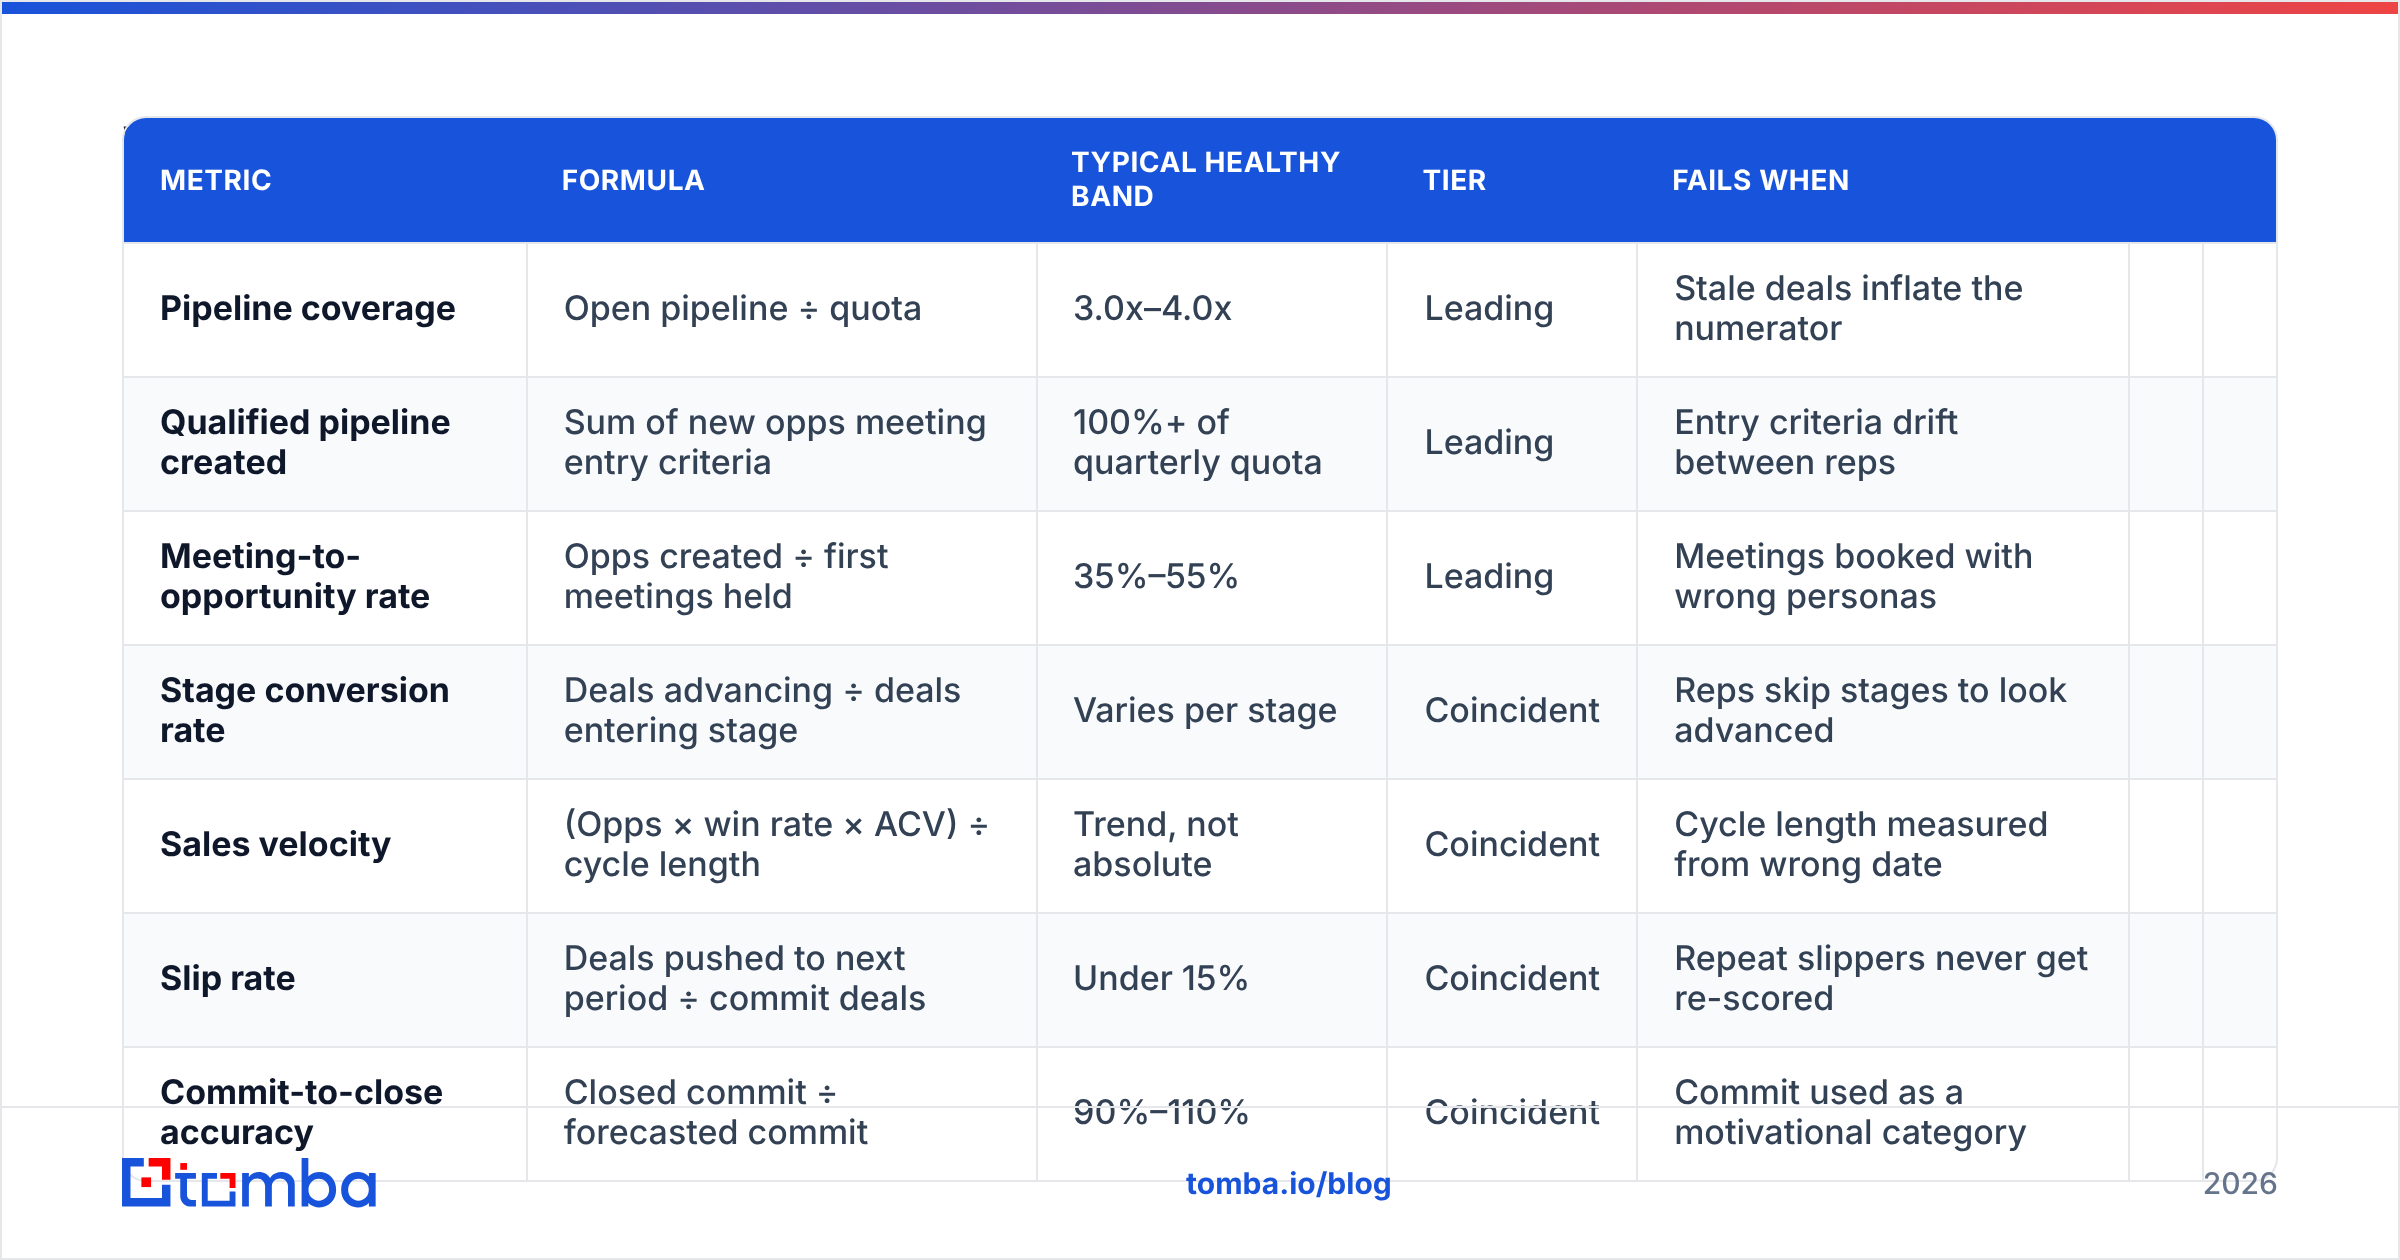
Here are the twelve that survive contact with a real pipeline review. Ranges are common operating bands for B2B SaaS with a 30–120 day cycle — calibrate against your own history before treating any of them as a target.
| Metric | Formula | Typical healthy band | Tier | Fails when | ||
|---|---|---|---|---|---|---|
| Pipeline coverage | Open pipeline ÷ quota | 3.0x–4.0x | Leading | Stale deals inflate the numerator | ||
| Qualified pipeline created | Sum of new opps meeting entry criteria | 100%+ of quarterly quota | Leading | Entry criteria drift between reps | ||
| Meeting-to-opportunity rate | Opps created ÷ first meetings held | 35%–55% | Leading | Meetings booked with wrong personas | ||
| Stage conversion rate | Deals advancing ÷ deals entering stage | Varies per stage | Coincident | Reps skip stages to look advanced | ||
| Sales velocity | (Opps × win rate × ACV) ÷ cycle length | Trend, not absolute | Coincident | Cycle length measured from wrong date | ||
| Slip rate | Deals pushed to next period ÷ commit deals | Under 15% | Coincident | Repeat slippers never get re-scored | ||
| Commit-to-close accuracy | Closed commit ÷ forecasted commit | 90%–110% | Coincident | Commit used as a motivational category | ||
| Weighted forecast (expected value) | Σ (deal value × stage probability) | Within 10% of actual | Coincident | Probabilities never back-tested | ||
| Forecast accuracy (MAPE) | Mean of \ | actual − forecast\ | ÷ actual | Under 10% at week 4 | Lagging | Averaged across segments, hiding outliers |
| Forecast bias (MPE) | Mean of (actual − forecast) ÷ actual | −3% to +3% | Lagging | Consistently positive = sandbagging | ||
| Win rate by source | Won ÷ (won + lost) per source | Segment-specific | Lagging | Source attribution overwritten on update | ||
| Data completeness rate | Records with all required fields ÷ total | Above 95% | Diagnostic | Required fields are optional in practice |
Two things about this table. First, no single row is a forecast — the forecast is the relationship between rows. Coverage of 4.0x means nothing if slip rate is 30%. Second, every band should be replaced by your own trailing four-quarter median within two quarters of tracking. Borrowed benchmarks are a starting point, not a target.
How do you calculate forecast accuracy correctly?#
Use two numbers together: MAPE for magnitude and MPE for direction.
MAPE (mean absolute percentage error) tells you how far off you were, ignoring sign:
MAPE = (1/n) × Σ ( |actual − forecast| ÷ actual ) × 100MPE (mean percentage error) keeps the sign, which exposes systematic bias:
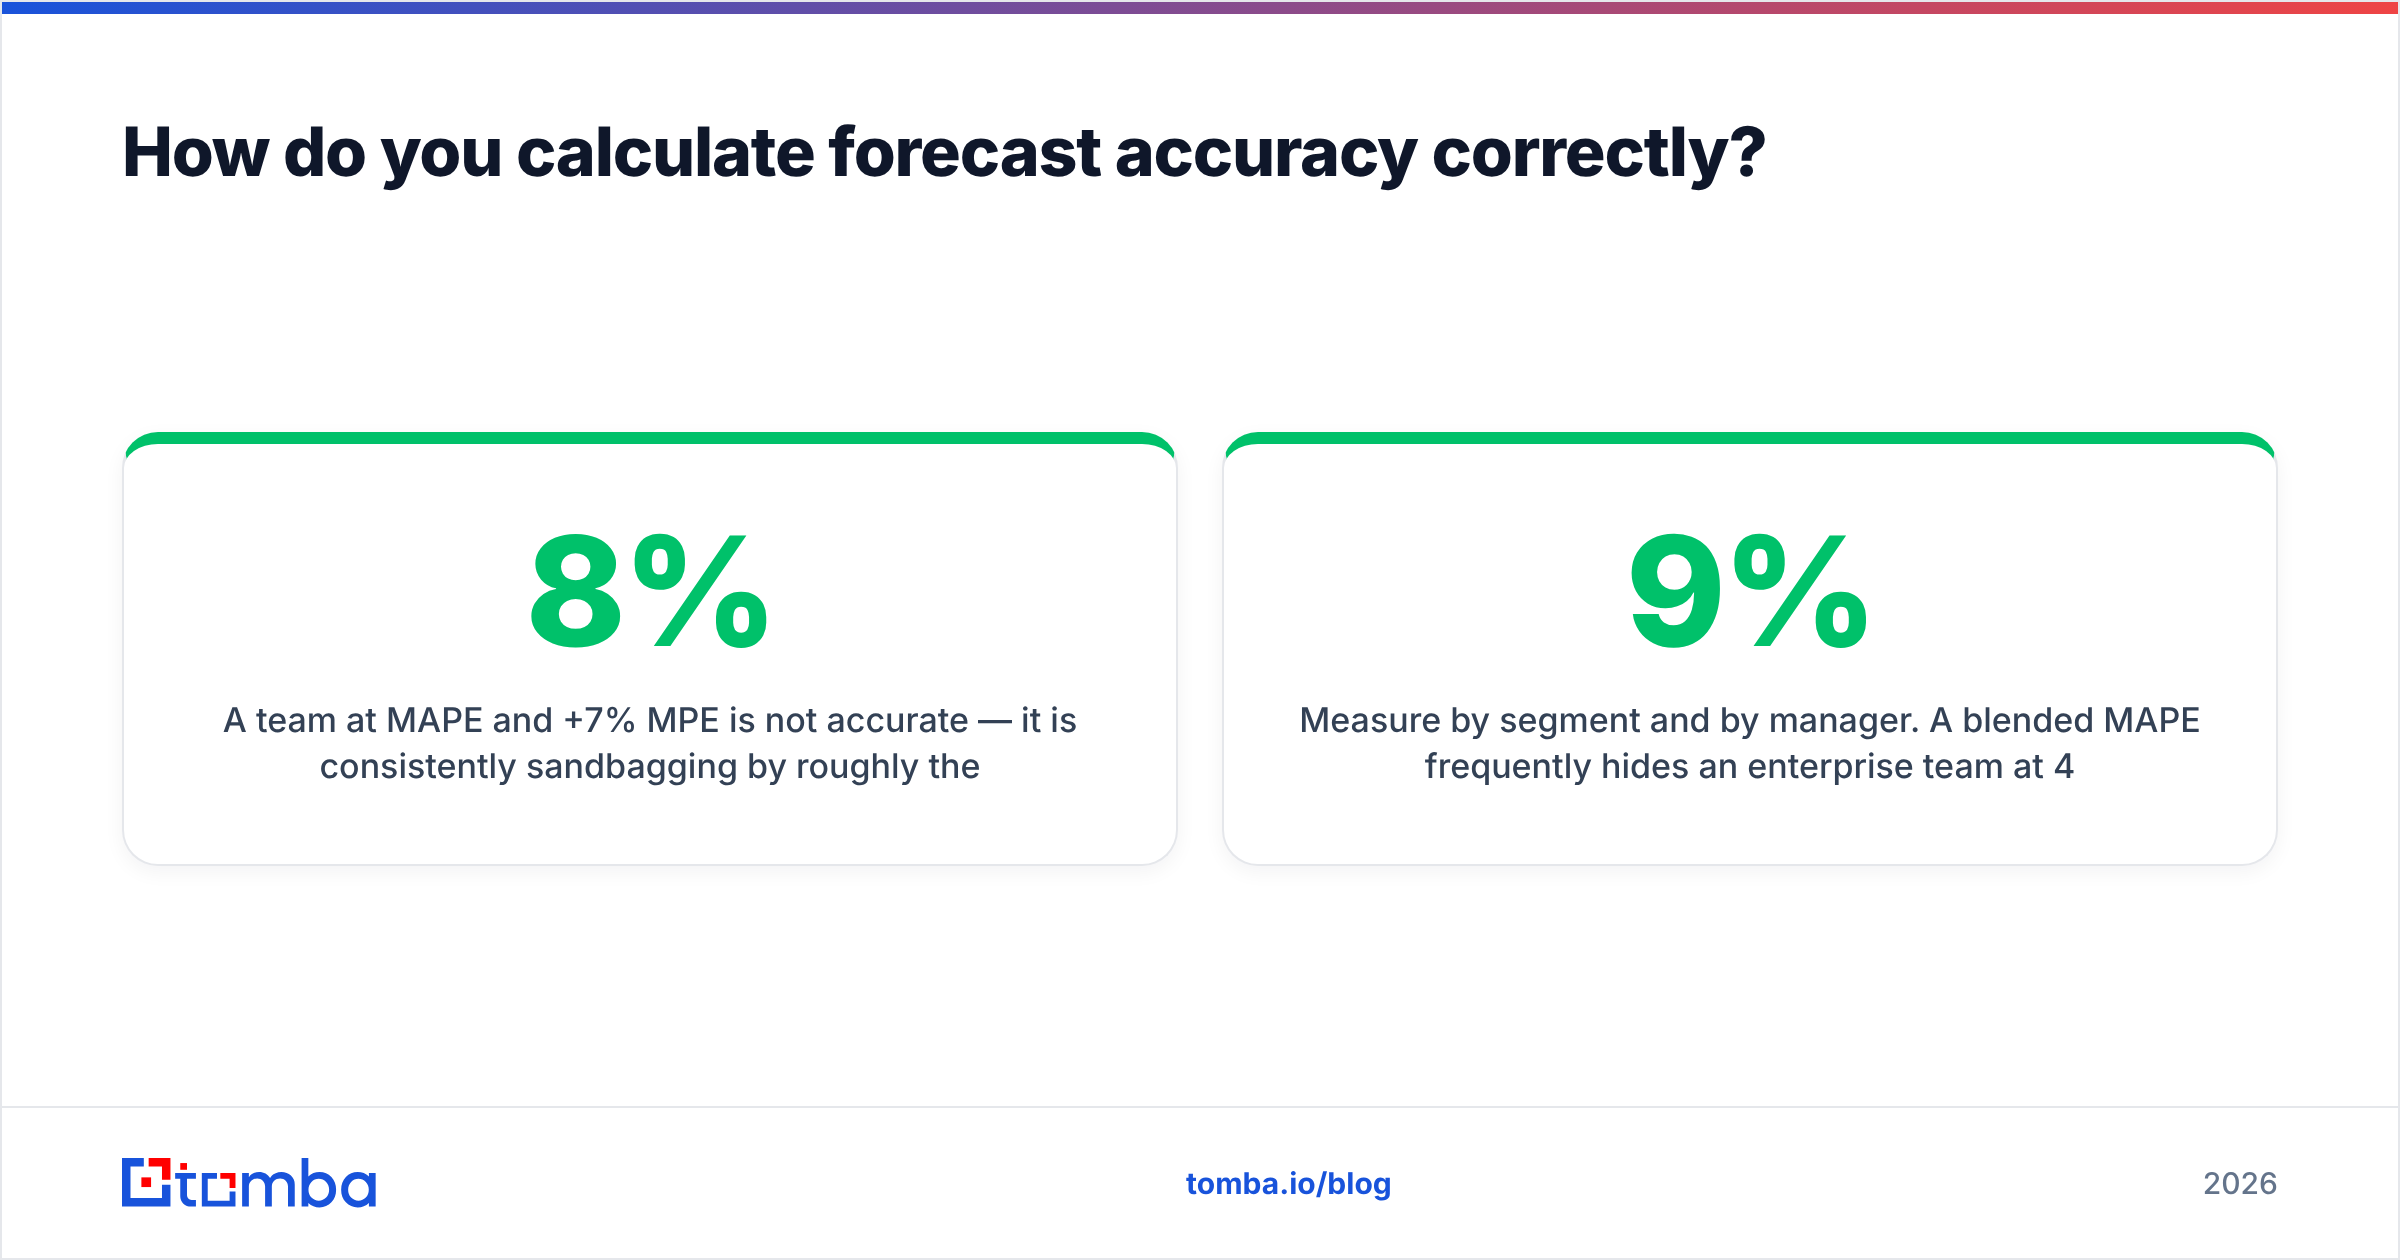
MPE = (1/n) × Σ ( (actual − forecast) ÷ actual ) × 100A team at 8% MAPE and +7% MPE is not accurate — it is consistently sandbagging by roughly the same amount every quarter, which is actually easy to correct with a fixed adjustment. A team at 8% MAPE and 0% MPE is genuinely well-calibrated. The formal definition of MAPE is worth reading if you plan to compare error across segments with very different deal sizes, because the metric distorts badly when actuals approach zero.
Three rules that fix most accuracy measurement:
- Snapshot weekly, not at close. Store the forecast every Monday. Your accuracy curve — week 1 error vs. week 12 error — is more actionable than a single end-of-quarter number.
- Measure by segment and by manager. A blended 9% MAPE frequently hides an enterprise team at 4% and a mid-market team at 22%.
- Score categories separately. Commit, best case, and pipeline should each have their own error history. If commit and best case have the same accuracy, your categories aren't doing any work.

What's the difference between leading and lagging forecast metrics?#
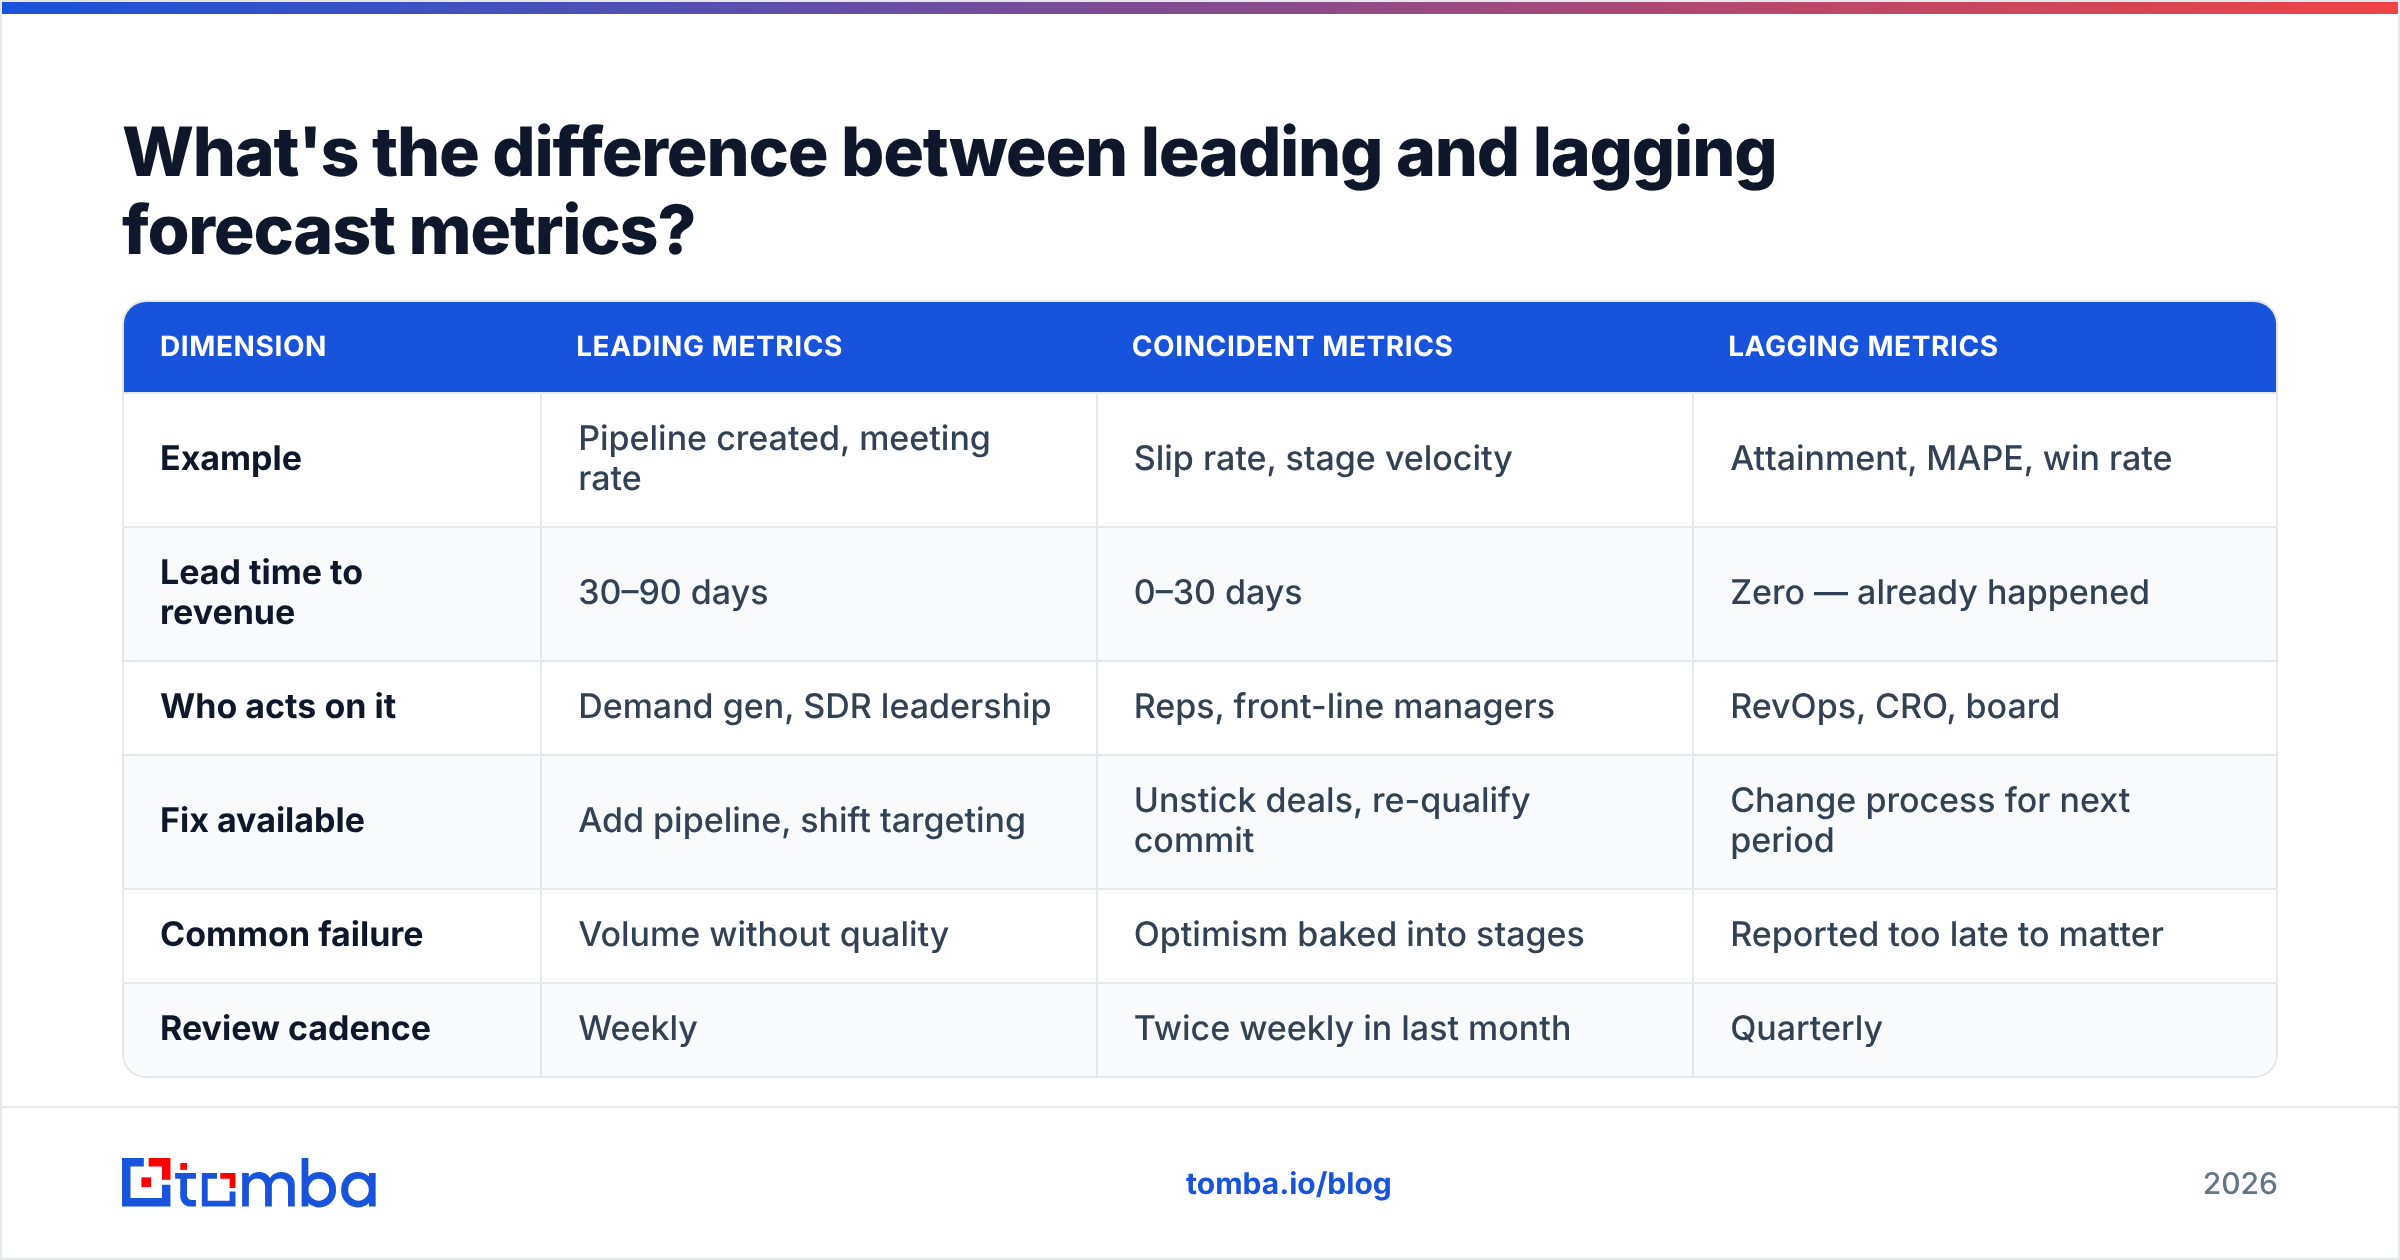
The practical difference is how much time you have to react.
| Dimension | Leading metrics | Coincident metrics | Lagging metrics |
|---|---|---|---|
| Example | Pipeline created, meeting rate | Slip rate, stage velocity | Attainment, MAPE, win rate |
| Lead time to revenue | 30–90 days | 0–30 days | Zero — already happened |
| Who acts on it | Demand gen, SDR leadership | Reps, front-line managers | RevOps, CRO, board |
| Fix available | Add pipeline, shift targeting | Unstick deals, re-qualify commit | Change process for next period |
| Common failure | Volume without quality | Optimism baked into stages | Reported too late to matter |
| Review cadence | Weekly | Twice weekly in last month | Quarterly |
Most forecast post-mortems conclude "we didn't have enough pipeline." That is a leading-metric failure discovered through a lagging metric — 90 days too late. The fix is not a better post-mortem. It is putting pipeline creation and coverage age on the same weekly review as commit, with equal seriousness.
Coverage age is underrated. A 3.5x coverage ratio built from deals created in the last 45 days behaves completely differently from 3.5x where a third of the pipeline is 200+ days old. Split coverage by opportunity age band and the ratio starts telling the truth.
Why do forecasts miss even when every metric looks green?#
Because the metrics inherit whatever quality your underlying data has, and CRM data decays continuously. Contacts change jobs, companies get acquired, email addresses stop resolving, and duplicate accounts split a single deal into two forecastable records.
Here is how bad data corrupts each tier:
- Leading metrics inflate. Pipeline created counts opportunities attached to accounts that no longer have a buying committee you can reach. Coverage looks like 4.2x; reachable coverage is 3.1x.
- Coincident metrics lag. Stage velocity stalls because the champion left six weeks ago and nobody updated the record. The deal looks "in negotiation" while it is functionally dead.
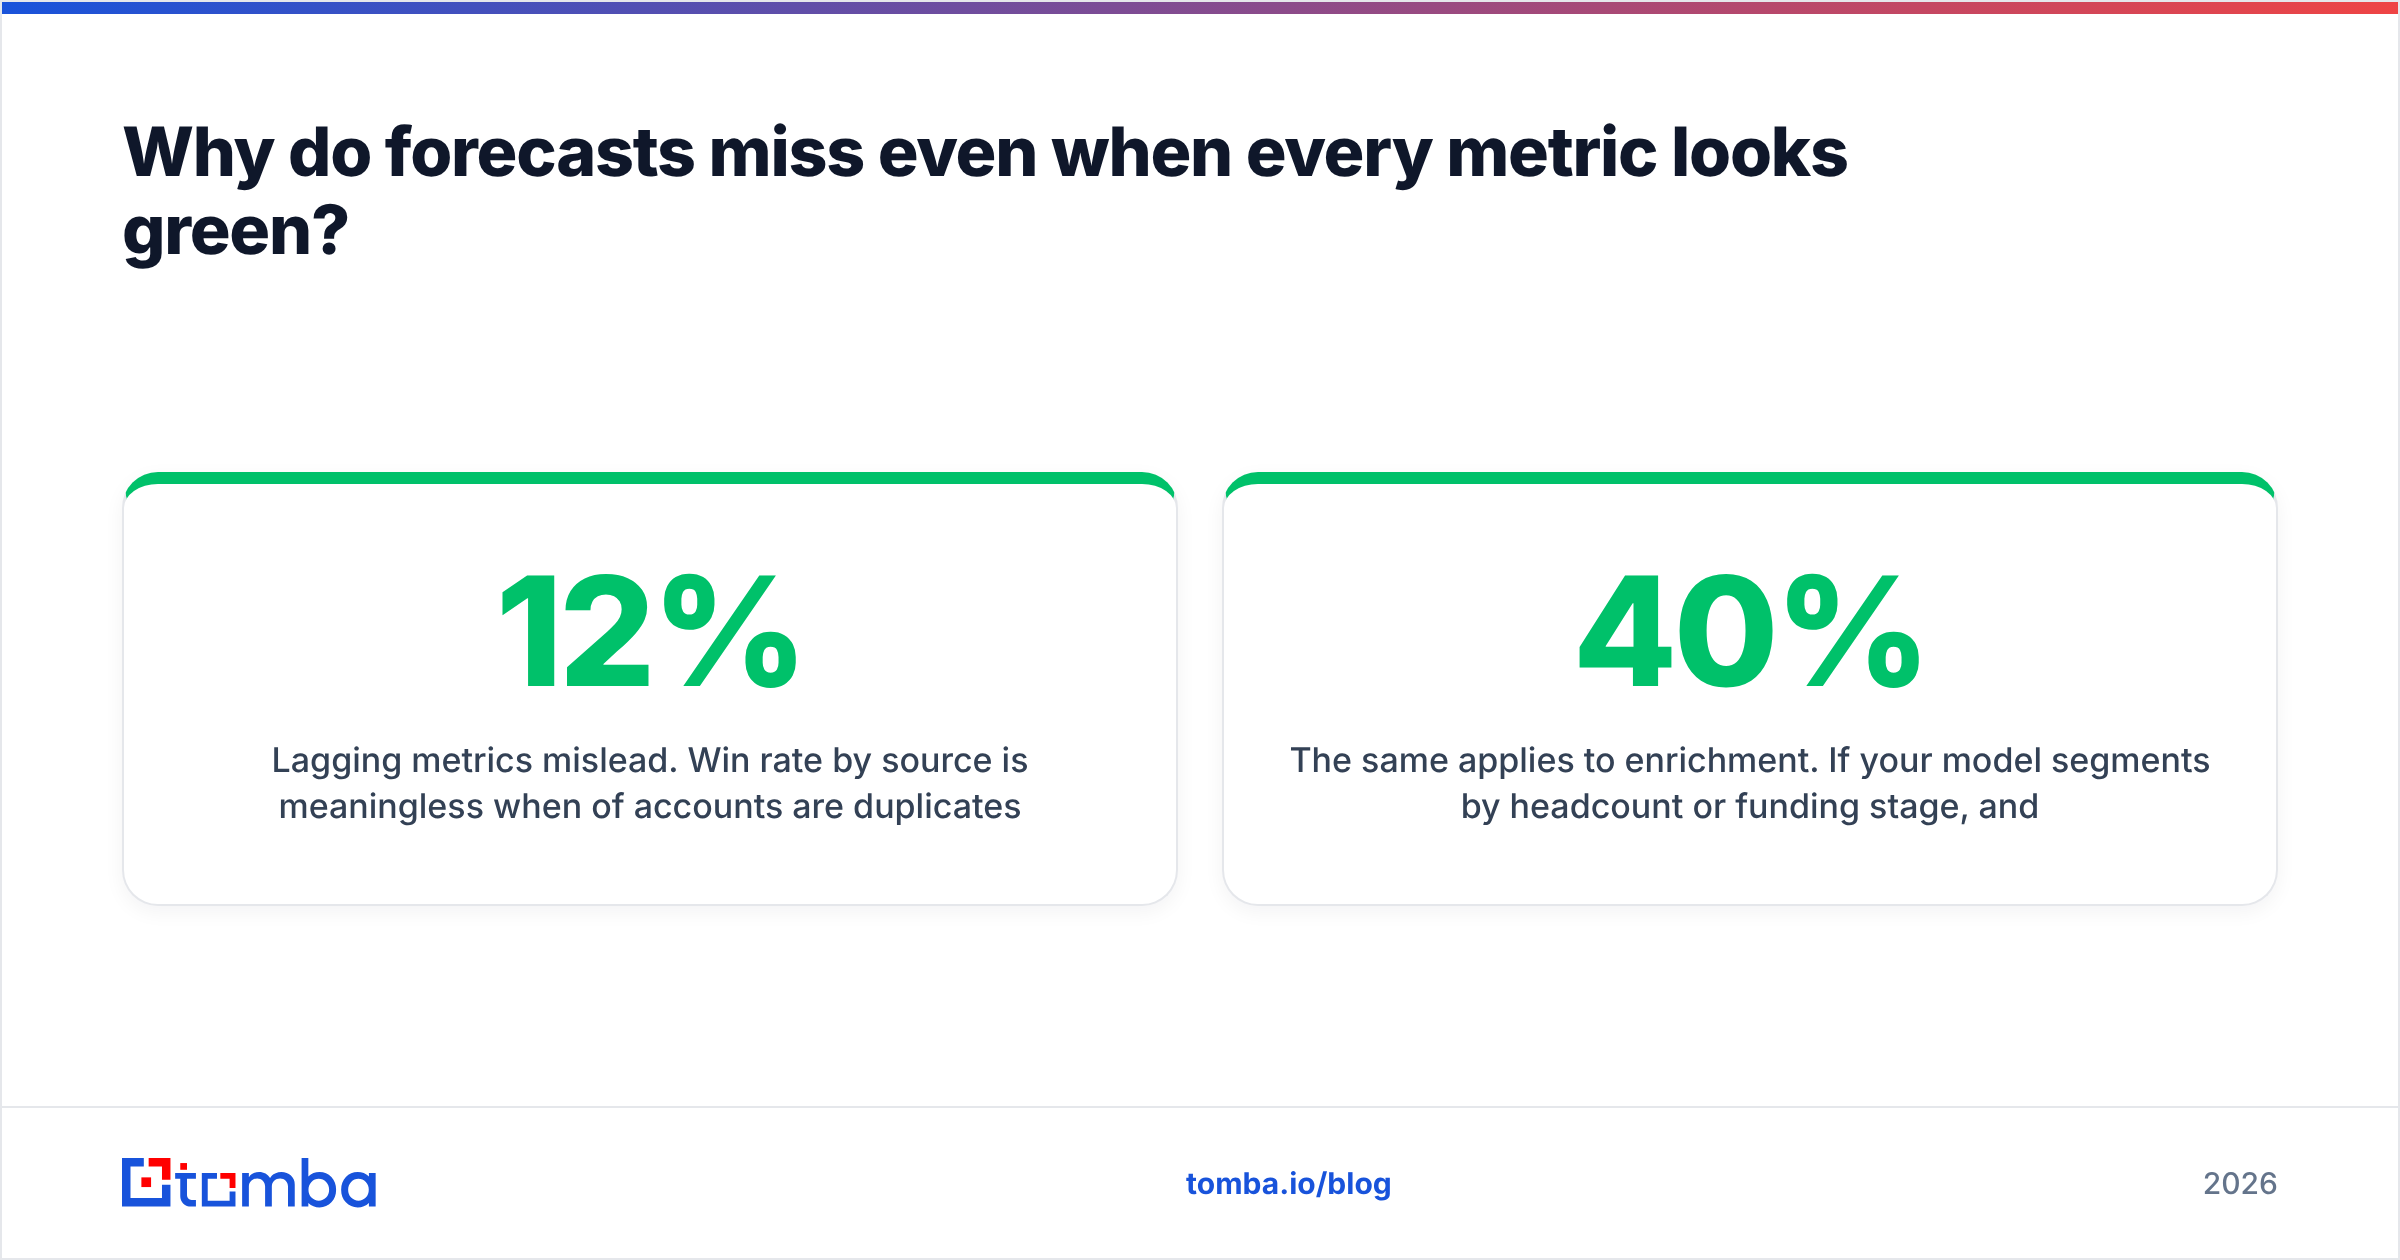
- Lagging metrics mislead. Win rate by source is meaningless when 12% of accounts are duplicates and attribution splits across both records.
This is where forecast hygiene and data hygiene converge. Before the quarterly forecast model gets another regression coefficient, run three checks: verify that decision-maker contacts on every commit deal still resolve, deduplicate accounts, and refresh firmographics on anything older than two quarters. Running commit-stage contacts through an email verifier is a fast proxy for "is this buying committee still real" — a hard bounce on a VP-level contact on a deal forecast to close in three weeks is a signal, not a nuisance.
The same applies to enrichment. If your model segments by headcount or funding stage, and 40% of accounts carry values captured 18 months ago, your segment-level win rates are fiction. Scheduled data enrichment on open pipeline keeps the model's inputs honest. Both Salesforce and HubSpot surface forecast categories natively, but neither validates whether the humans attached to those deals are still reachable — that part is on you.
Which forecasting metrics should you stop tracking?#
Three candidates for deletion, in order of how much time they waste:
1. Raw activity counts. Calls dialed and emails sent correlate with effort, not revenue. They become forecast-relevant only when converted into an outcome rate — meetings held per 100 targeted contacts, for example. Track the rate, drop the raw count.
2. Unweighted total pipeline. A single number combining a $400K deal at stage 1 with a $40K deal at verbal commit is not a prediction of anything. Report pipeline by stage and by category, or report expected value. Never the raw sum on a leadership slide.
3. Uncalibrated rep confidence. "I'm 90% on this one" is useful only if you store it and score it. After two quarters you'll know that Rep A's 90% closes at 88% and Rep B's 90% closes at 52% — and then confidence becomes a real input. Until then it's noise with a percentage sign.
Also be careful with any metric that only exists at the aggregate level. Analyst frameworks from Gartner and similar research shops consistently point to segment-level modeling over blended company-wide accuracy, and the practical reason is simple: blended numbers can look stable while two segments move violently in opposite directions.
How do you build a forecast dashboard that people actually use?#
Six components, in build order:
- A weekly snapshot table. Every Monday, write forecast by category, by segment, by rep. This is the foundation — without history you cannot compute error, bias, or calibration.
- An accuracy curve. Plot MAPE by week-of-quarter across the last four quarters. If week 6 error is still above 20%, your qualification criteria are the problem, not the model.
- A coverage panel split by age. Coverage ratio broken into 0–30, 31–90, 91–180, and 180+ day opportunity age. Old pipeline should be visibly discounted.
- A slip tracker. Named deals that moved close date, with count of previous pushes. Two pushes should trigger automatic re-qualification, not a third push.
- A data-health strip. Completeness rate, contact verification pass rate, duplicate account count. Put it on the same screen as the forecast so degradation is impossible to ignore.
- A single "delta vs. last week" line. What changed and why. Most forecast meetings should be about the delta, not a re-reading of the whole board.
If you run revenue operations for a team of any size, items 1 and 5 deliver the most value per hour of setup. Everything else is refinement.
What's the fastest way to improve forecast accuracy this quarter?#
Pick the cheapest lever first: clean the inputs. Re-verify decision-maker contacts on every commit-category deal, backfill missing contacts on accounts where you only have one relationship, and remove duplicate accounts inflating coverage. That work typically moves week-6 forecast error more than any model change, because it eliminates deals that were never closeable and surfaces deals that were understated.
Tomba's Email Finder is built for exactly that gap-filling pass — find the missing VP, director, or procurement contact on accounts your forecast already depends on, so single-threaded deals stop quietly becoming slips. The free tier covers 25 searches a month, Starter is $49/mo, and Growth at $99/mo handles most mid-market pipeline cleanups; full Tomba pricing is on the site. Verify your commit list before the next pipeline review, and let the forecast metrics measure a pipeline that actually exists.
Related guides#
Ready to find emails that actually work?
Join 150,000+ professionals who stopped guessing and started sending. Free credits on signup — no credit card required.
Get the Tomba newsletter
Practical outbound tactics and product updates — once every two weeks.
About the author