The Formula for Sales Revenue: How to Model It in 2026
Revenue is not one formula — it is four, and picking the wrong one hides the real bottleneck. Here is how to model sales revenue by business type, with worked numbers and the inputs that actually move it.
TL;DR
- The basic formula for sales revenue is
Units Sold x Average Price, but that version is nearly useless for planning a B2B team. It tells you what happened, not what to change. - There are four models worth knowing: the simple product formula, the pipeline/capacity formula, the recurring-revenue (ARR bridge) formula, and the activity-driven outbound formula. Each exposes a different bottleneck.
- The single input most teams get wrong is not conversion rate — it is deliverable contact volume. If 22% of your list bounces, your "meetings booked" input was fiction before the first call.
- Work the formula backward from the number, not forward from optimism. Backward math tells you how many verified contacts you need this month; forward math tells you a story.
- Model at the segment level. A blended win rate across SMB and enterprise produces a forecast that is wrong in both directions at once.
What is the formula for sales revenue?#
The textbook formula for sales revenue is:
Sales Revenue = Units Sold x Average Selling PriceThat is accurate and, for a B2B sales team, almost entirely unhelpful. It is like saying a restaurant's revenue equals plates served times price per plate — true, but it tells you nothing about whether the problem is the kitchen, the menu, or the empty sidewalk outside.
The useful version decomposes "units sold" into the things a sales leader can actually pull on: how many qualified opportunities entered the pipeline, what percentage closed, how long they took, and what each one was worth. That expanded formula looks like this:
Sales Revenue = Opportunities Created x Win Rate x Average Deal SizeAnd for subscription businesses, revenue is not a single-period event at all — it is a running balance:
Ending ARR = Starting ARR + New + Expansion - Contraction - ChurnFour different equations, four different answers to "why did we miss." Choosing the right one is most of the work.
Which revenue formula fits your business model?#
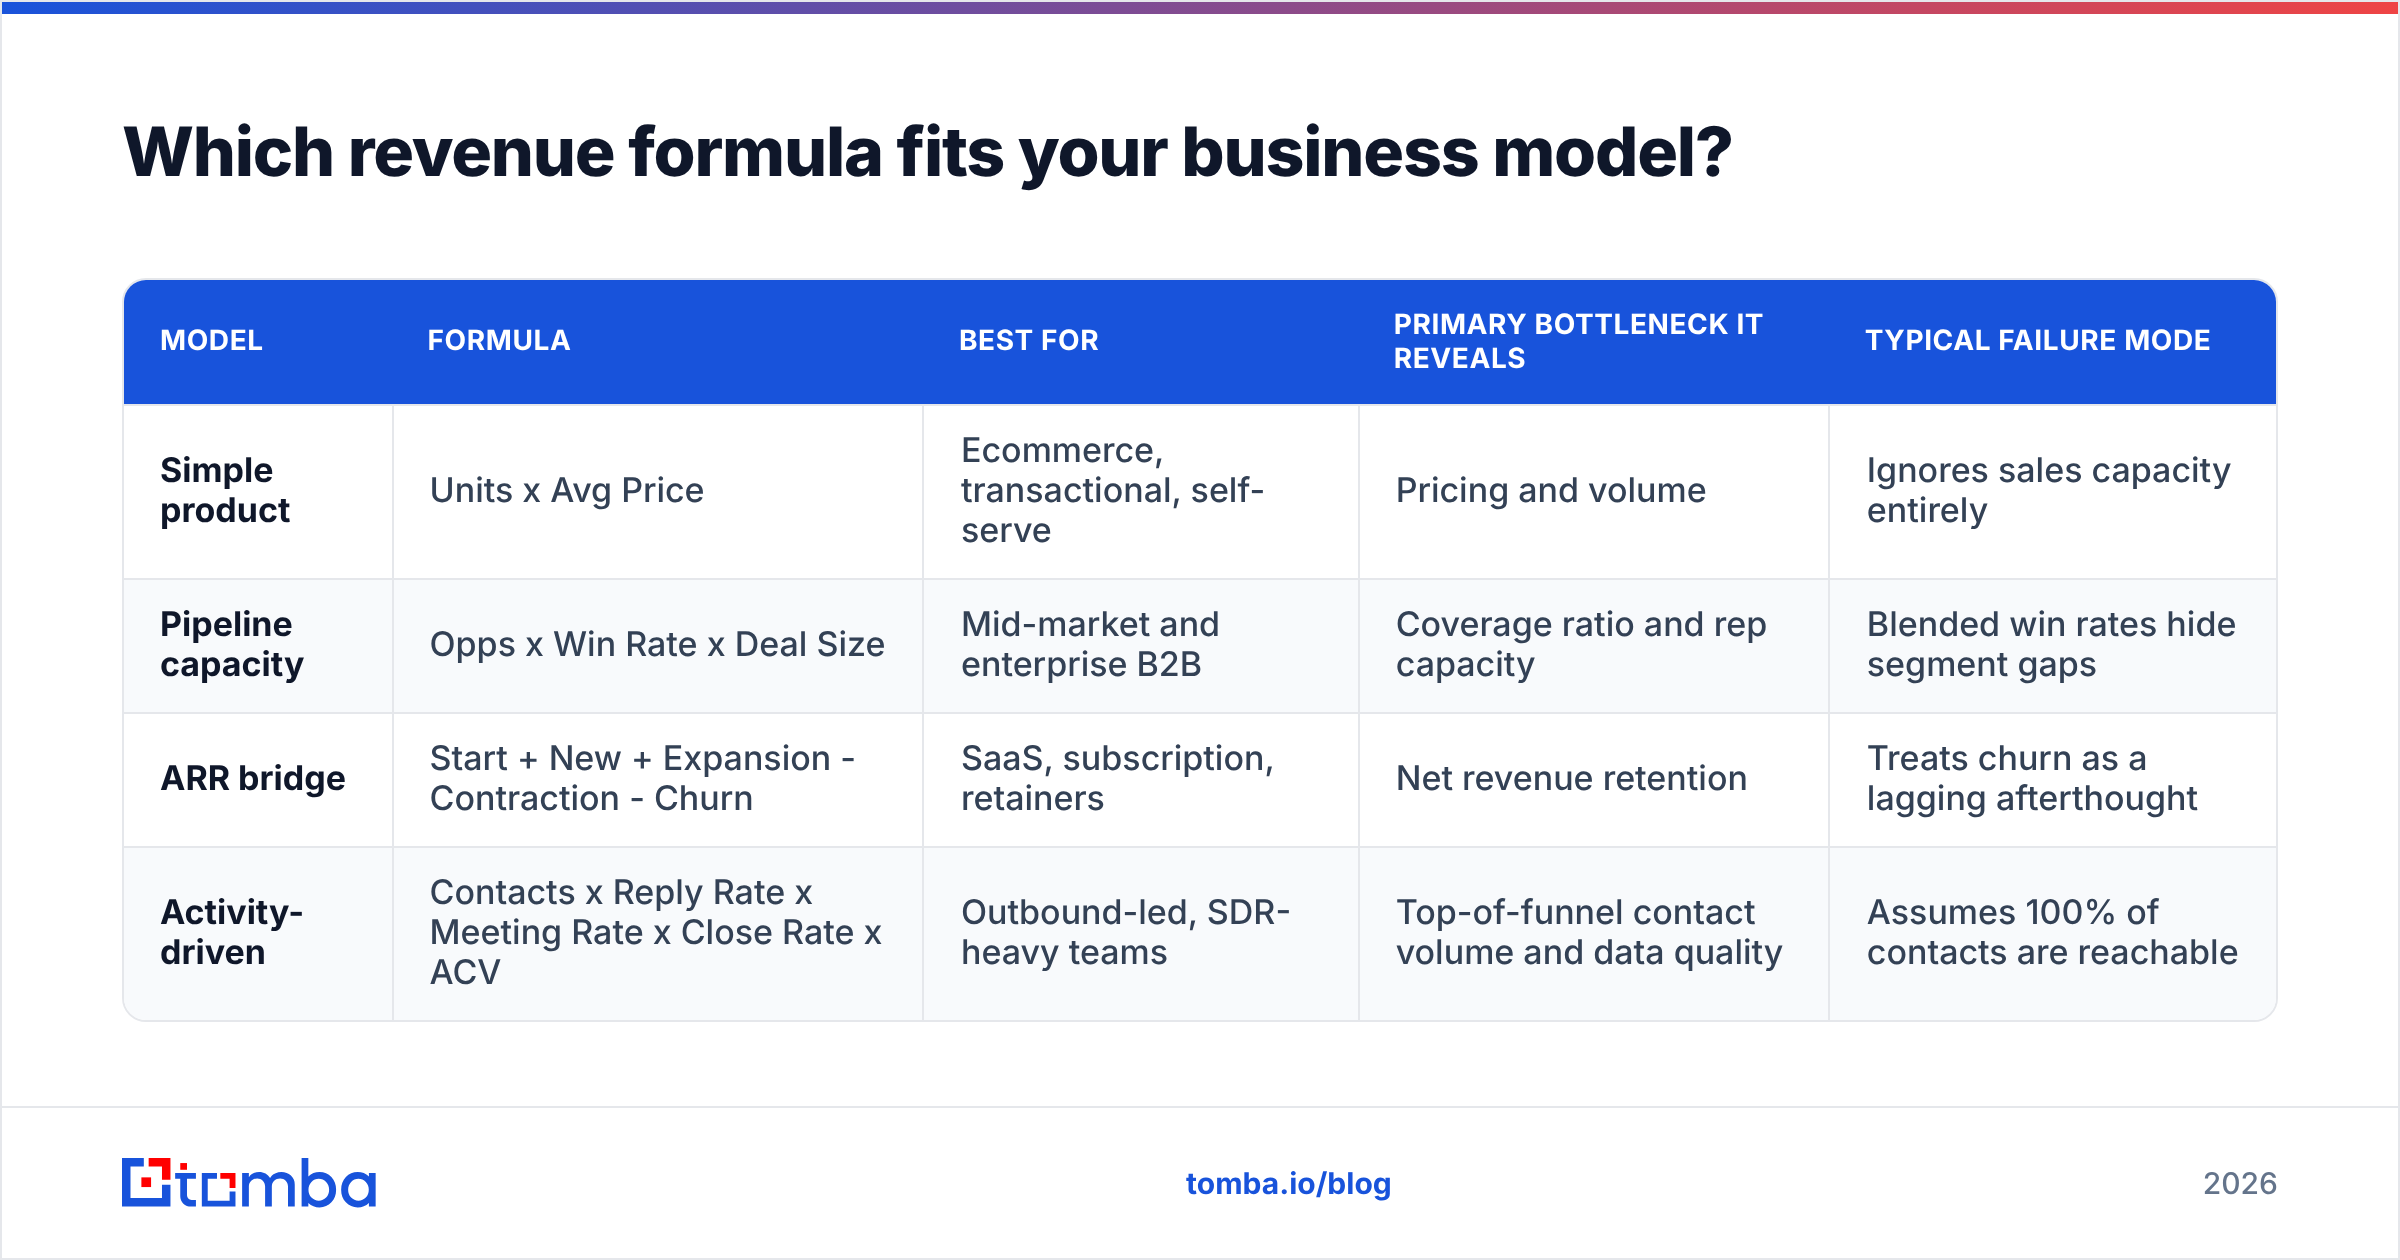
Here is the comparison that matters. Find the row that matches how you actually sell, then use that formula as your planning primitive.
| Model | Formula | Best for | Primary bottleneck it reveals | Typical failure mode |
|---|---|---|---|---|
| Simple product | Units x Avg Price | Ecommerce, transactional, self-serve | Pricing and volume | Ignores sales capacity entirely |
| Pipeline capacity | Opps x Win Rate x Deal Size | Mid-market and enterprise B2B | Coverage ratio and rep capacity | Blended win rates hide segment gaps |
| ARR bridge | Start + New + Expansion - Contraction - Churn | SaaS, subscription, retainers | Net revenue retention | Treats churn as a lagging afterthought |
| Activity-driven | Contacts x Reply Rate x Meeting Rate x Close Rate x ACV | Outbound-led, SDR-heavy teams | Top-of-funnel contact volume and data quality | Assumes 100% of contacts are reachable |
Most B2B companies need two of these running side by side: the ARR bridge for the board, and the activity-driven model for the SDR team. They should reconcile. When they do not, the gap is almost always sitting in data quality at the top of the funnel.

How do you calculate sales revenue step by step?#
Work backward. Always backward. Start with the number you must hit and derive the inputs, because forward math lets you round every assumption in your favor until the plan closes on paper and fails in reality.
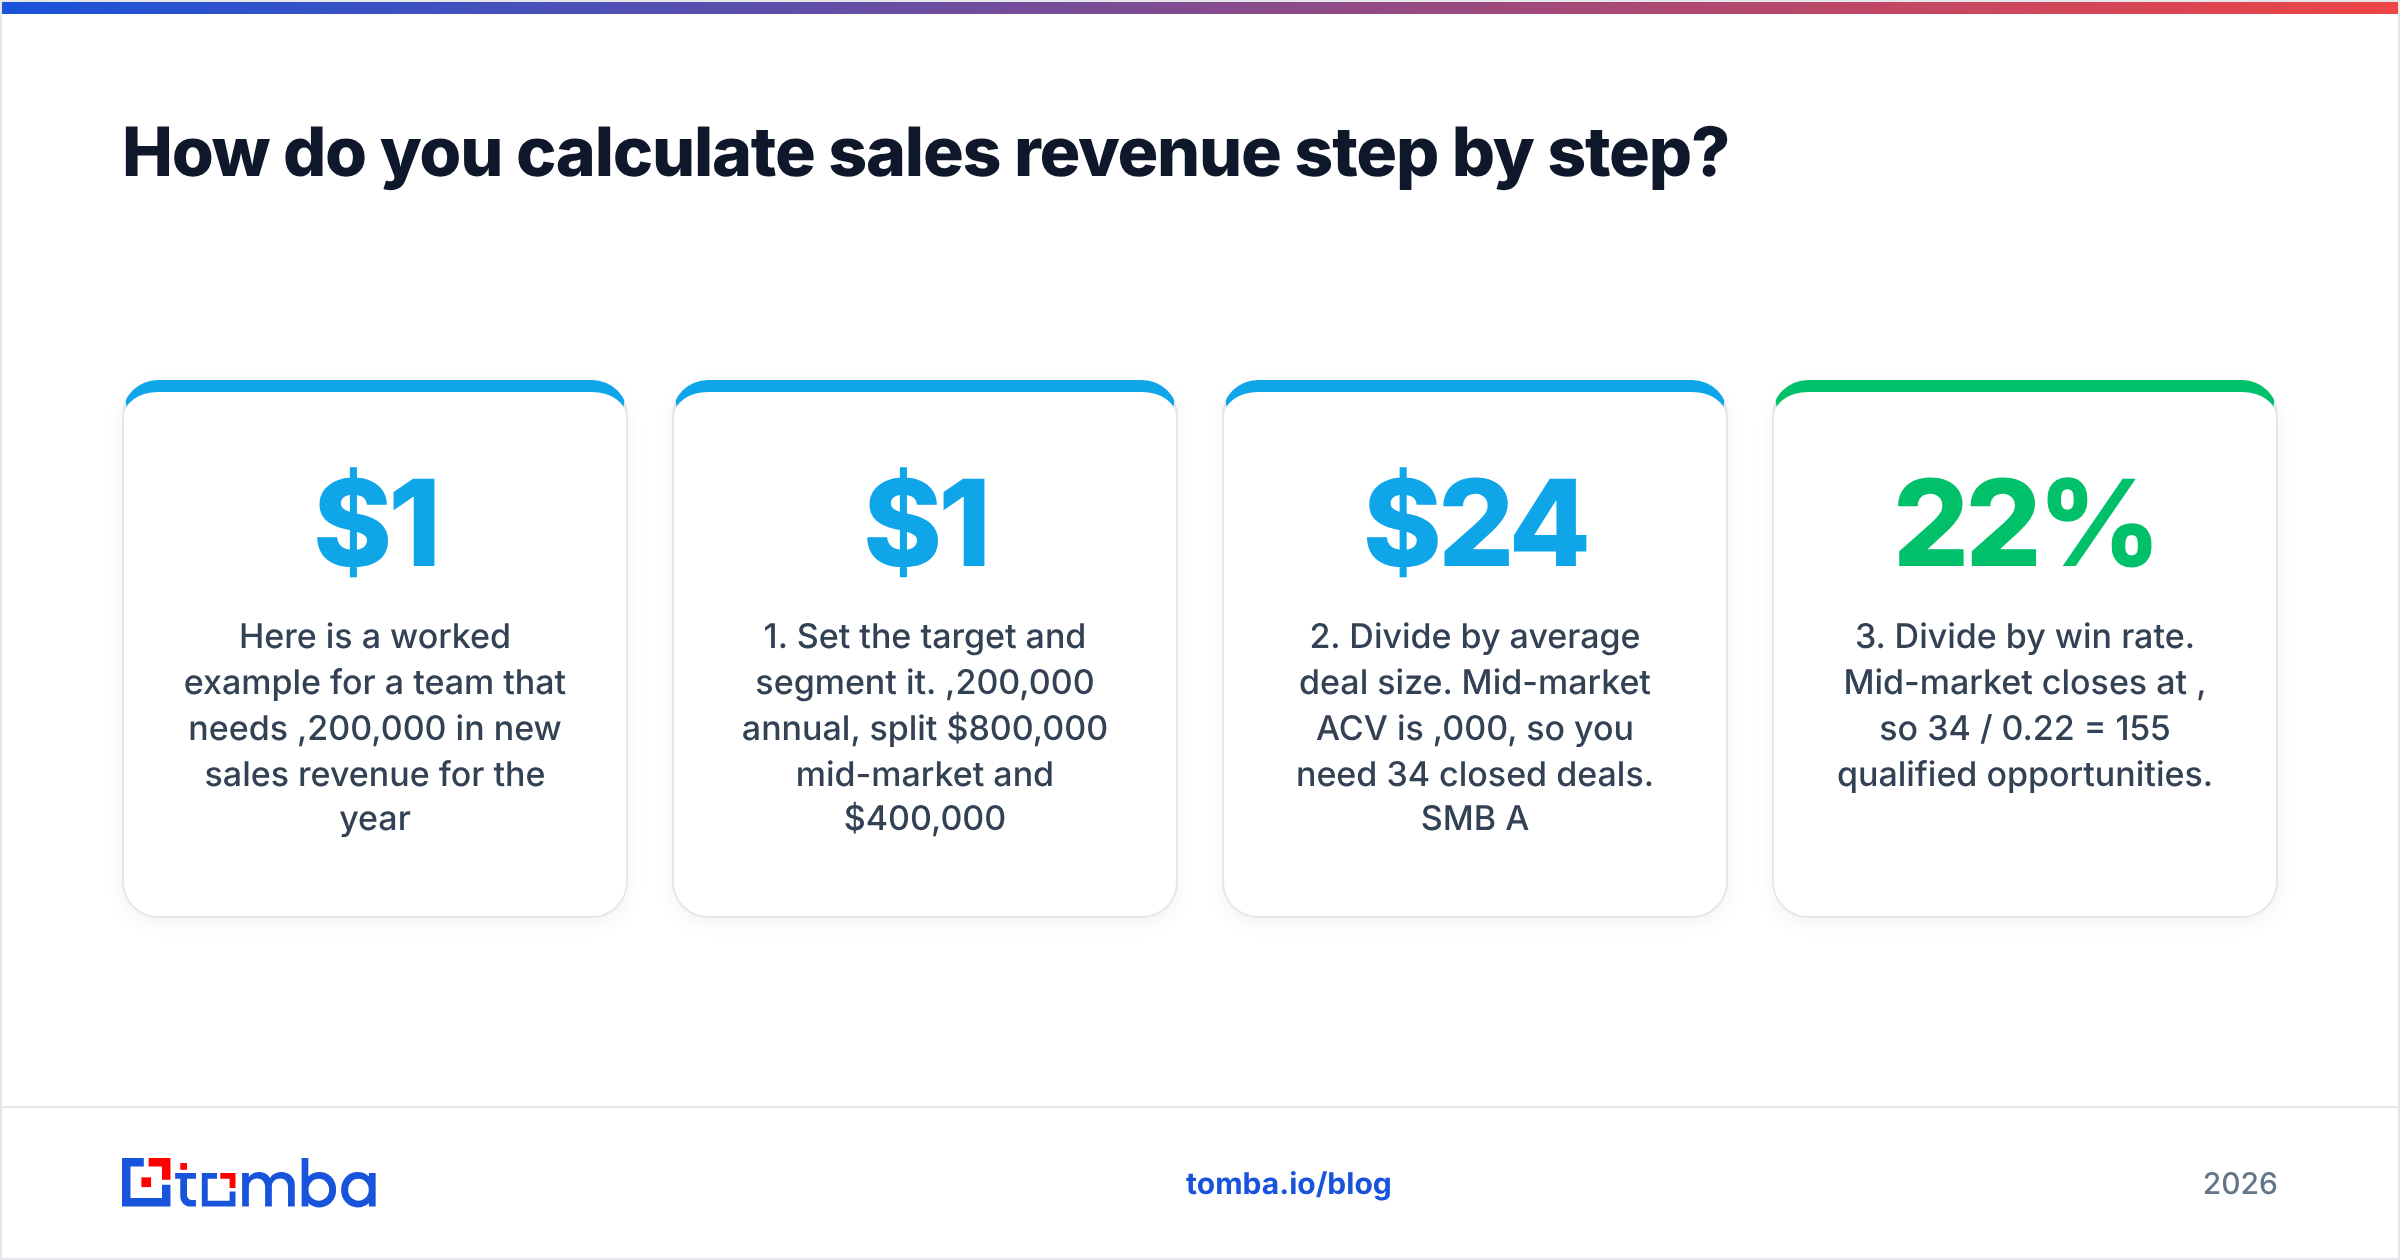
Here is a worked example for a team that needs $1,200,000 in new sales revenue for the year.
- Set the target and segment it. $1,200,000 annual, split $800,000 mid-market and $400,000 SMB. Do not blend. The two segments have different deal sizes and different win rates, and averaging them produces a plan that is wrong for both.
- Divide by average deal size. Mid-market ACV is $24,000, so you need 34 closed deals. SMB ACV is $6,000, so you need 67 closed deals. Round up, never down.
- Divide by win rate. Mid-market closes at 22%, so 34 / 0.22 = 155 qualified opportunities. SMB closes at 31%, so 67 / 0.31 = 216 opportunities. Combined: 371 opportunities for the year, roughly 31 per month.
- Divide by meeting-to-opportunity rate. If 55% of discovery calls become qualified opportunities, you need 675 meetings, or about 56 per month.
- Divide by outreach conversion. At a 4% meeting-booked rate per contacted prospect (a realistic blended cold-email-plus-call figure for 2026), you need roughly 16,900 contacted prospects.
- Adjust for data quality — the step almost everyone skips. If 18% of your sourced contacts bounce, are role-mismatched, or are unreachable, you do not need 16,900 records. You need about 20,600 sourced records to yield 16,900 deliverable ones.
That last step is where most annual plans quietly break. The formula did not fail; the input did. A response rate calculated against a list that is 18% garbage is not a performance metric — it is a measurement error being logged as strategy.
Why does contact data quality change the revenue math?#
Because every conversion rate downstream is multiplied by the size of your deliverable list, not your purchased list. Bad data does not cost you 18% at one step — it compounds through every subsequent multiplication and it damages email deliverability, which quietly suppresses the reply rate on the good addresses too.
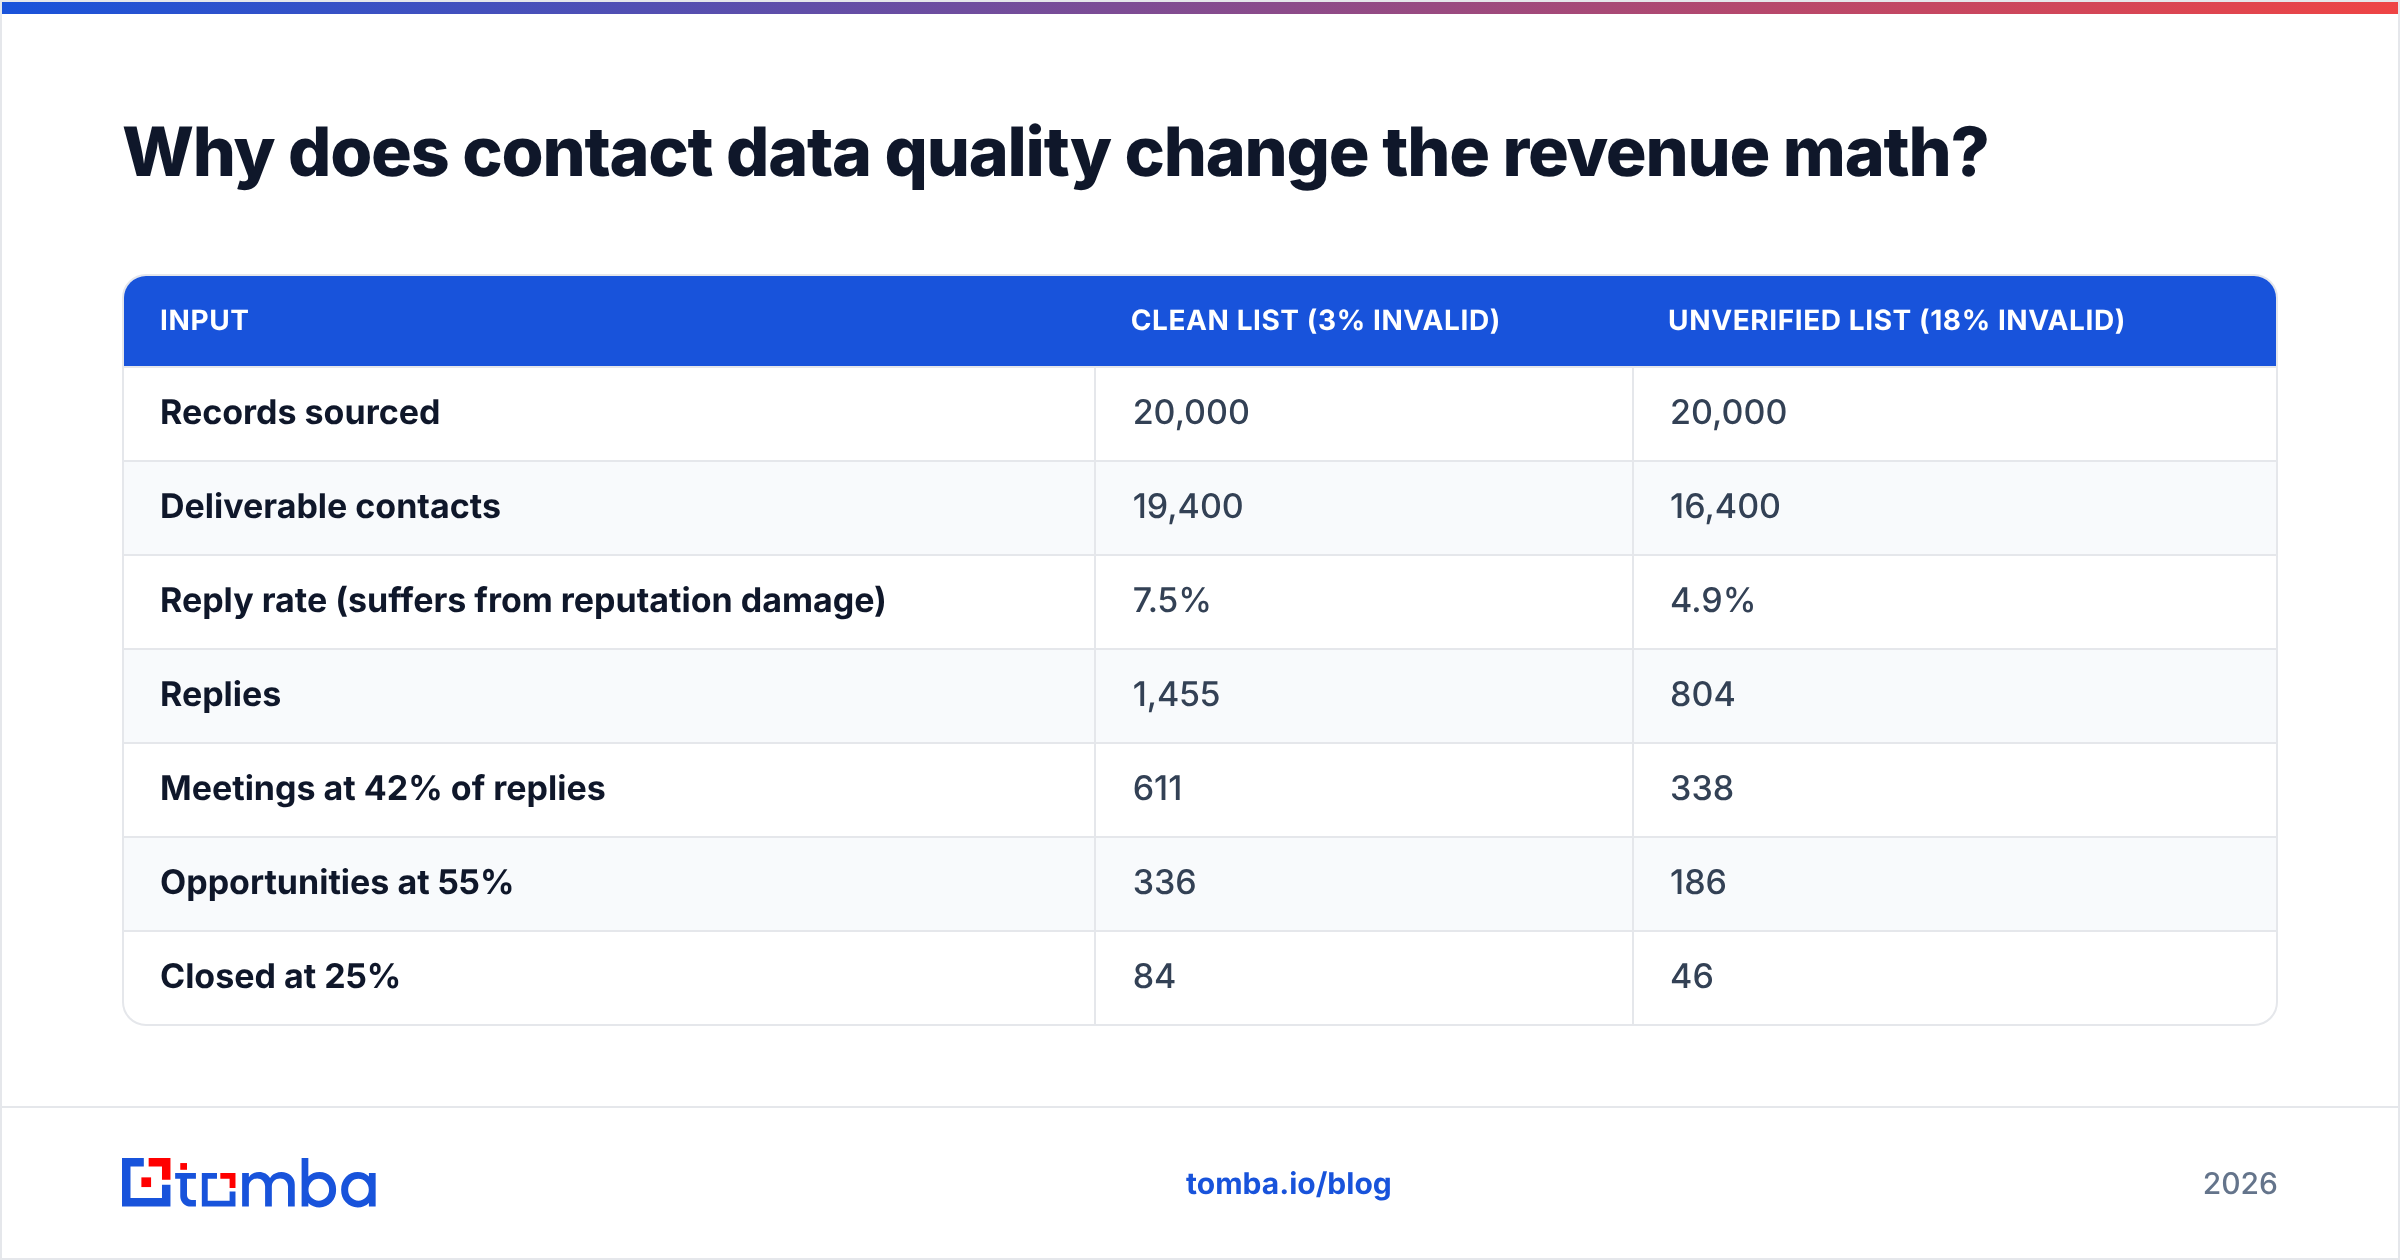
Run the same model twice, changing only the bounce rate:
| Input | Clean list (3% invalid) | Unverified list (18% invalid) |
|---|---|---|
| Records sourced | 20,000 | 20,000 |
| Deliverable contacts | 19,400 | 16,400 |
| Reply rate (suffers from reputation damage) | 7.5% | 4.9% |
| Replies | 1,455 | 804 |
| Meetings at 42% of replies | 611 | 338 |
| Opportunities at 55% | 336 | 186 |
| Closed at 25% | 84 | 46 |
| Revenue at $14,000 ACV | $1,176,000 | $644,000 |
Same headcount, same messaging, same 20,000 records. A 15-point difference in list hygiene produced a 45% difference in revenue, because the invalid addresses also dragged down sender reputation and therefore inbox placement for the valid ones. This is why running your list through an email verifier before a campaign is not a hygiene chore — it is a revenue input with a measurable coefficient.
Google and Yahoo's bulk-sender requirements, which have been enforced since 2024 and tightened since, put a hard 0.3% spam-complaint ceiling on senders — see the Google Postmaster sender guidelines for the current thresholds. Cross it and your deliverable-contact input collapses regardless of how good your formula is.
How does the recurring revenue formula differ?#
The ARR bridge is a balance-sheet-style formula, not a flow formula. It tracks revenue as a stock that gains and loses over a period:
Ending ARR = Starting ARR + New ARR + Expansion ARR - Contraction ARR - Churned ARRThe derived metric that actually governs your growth is Net Revenue Retention:
NRR = (Starting ARR + Expansion - Contraction - Churn) / Starting ARRAt 100% NRR, you keep what you have and every dollar of growth must be hunted. At 120%, your existing base grows 20% before a single new logo signs, which means your new-business target drops by exactly that amount. Public benchmarks compiled by analysts such as Gartner and reported across SaaS peer groups put median NRR for B2B SaaS in the 100-110% range, with top quartile above 120%.
The practical implication for planning: calculate your new-business target after retention, not before. A team carrying $5,000,000 ARR at 112% NRR starts the year with $600,000 of growth already banked. If the board wants $1,600,000 of net growth, the new-logo formula needs to deliver $1,000,000 — not $1,600,000. Teams that skip this step over-hire SDRs and under-invest in customer success, then wonder why CAC payback stretched out.
What inputs actually move sales revenue?#
Only five things change the output of any of these formulas. Everything else is a proxy for one of them.
- Deliverable contact volume — how many real, reachable, correctly-titled humans you can put a message in front of this month. This is the input with the highest ceiling and the one most teams treat as fixed. Sourcing more accounts via domain search or enriching an existing account list moves this directly.
- Message-to-reply conversion — a function of relevance and timing far more than of clever copy. Segment-specific messaging typically outperforms a general template by 2-3x on reply rate.
- Win rate — improved by qualification discipline, not by persuasion. Raising the bar on what counts as an opportunity lowers opportunity count and raises revenue at the same time, which is counterintuitive until you have watched it happen.
- Average deal size — the fastest lever in the short term, because it requires no new pipeline. Packaging, multi-year terms, and seat expansion all pull it.
- Sales cycle length — does not appear in the formula but governs how many times per year you get to run it. Cutting a 90-day cycle to 70 days adds roughly one extra full cycle per rep per year.
Rank them by effort-to-impact for your own team, and be honest: if your reply rate is 1.2%, no amount of win-rate coaching will fix the number. The constraint is upstream.

How do you avoid the most common modeling mistakes?#
Five errors account for most broken revenue models.
Blending segments. A 26% blended win rate across a 40% SMB rate and a 14% enterprise rate describes no deal you have ever run. Model each motion separately, then sum.
Using lagging conversion rates as forward assumptions. Last year's 6% meeting rate was earned in last year's inbox conditions. Filtering has tightened. Discount historical top-of-funnel rates by 10-20% when planning forward, or validate them with a small live test before committing headcount to them.
Ignoring ramp time. A rep hired in March is not productive in March. With a typical 3-4 month ramp in mid-market B2B, a March hire contributes roughly two-thirds of a rep-year, not ten months of one. Build ramp curves into capacity math or you will overstate the plan by 15-25%.
Treating pipeline coverage as a constant. The old "3x coverage" heuristic assumes a 33% win rate. If you close at 18%, you need closer to 5.5x. Derive coverage from your own win rate instead of inheriting a number from a conference talk.
Forgetting that data decays. B2B contact records degrade roughly 22-30% per year through job changes and company moves — a figure HubSpot and other CRM vendors have documented repeatedly. A list you built in January is measurably worse by July. If your model assumes a static database, it is overstating deliverable contacts every month after the first. Scheduled re-enrichment through data enrichment or a periodic bulk verify pass keeps the input honest.
How do you build this into a working spreadsheet?#
Keep it to three tabs and resist the urge to make it beautiful.
Tab 1 — Inputs. One column per segment. Rows: ACV, win rate, opp-to-close days, meeting-to-opp rate, reply-to-meeting rate, contact-to-reply rate, bounce rate, reps, ramp months. Every one of these is a number you can defend with data from the last two quarters. If you cannot defend it, mark the cell and note the source as "assumption" so future-you knows which numbers are load-bearing guesses.
Tab 2 — Backward model. Target revenue at the top, each division step from the walkthrough above as its own row, ending in "sourced contacts required per month." This is the number you hand to whoever owns list building.
Tab 3 — Actuals vs. model. Weekly. Two columns: what the model said, what happened. The gap column is your entire management agenda. When actuals miss, the discipline is to identify which input broke, not to restate the output target more loudly.
The single most valuable habit is reconciling tab 3 against tab 1 monthly. If your assumed 5% contact-to-reply rate has run at 2.8% for three months, the input is wrong, and every downstream number built on it is fiction. Update the input. Re-derive the plan. Tell the board early.
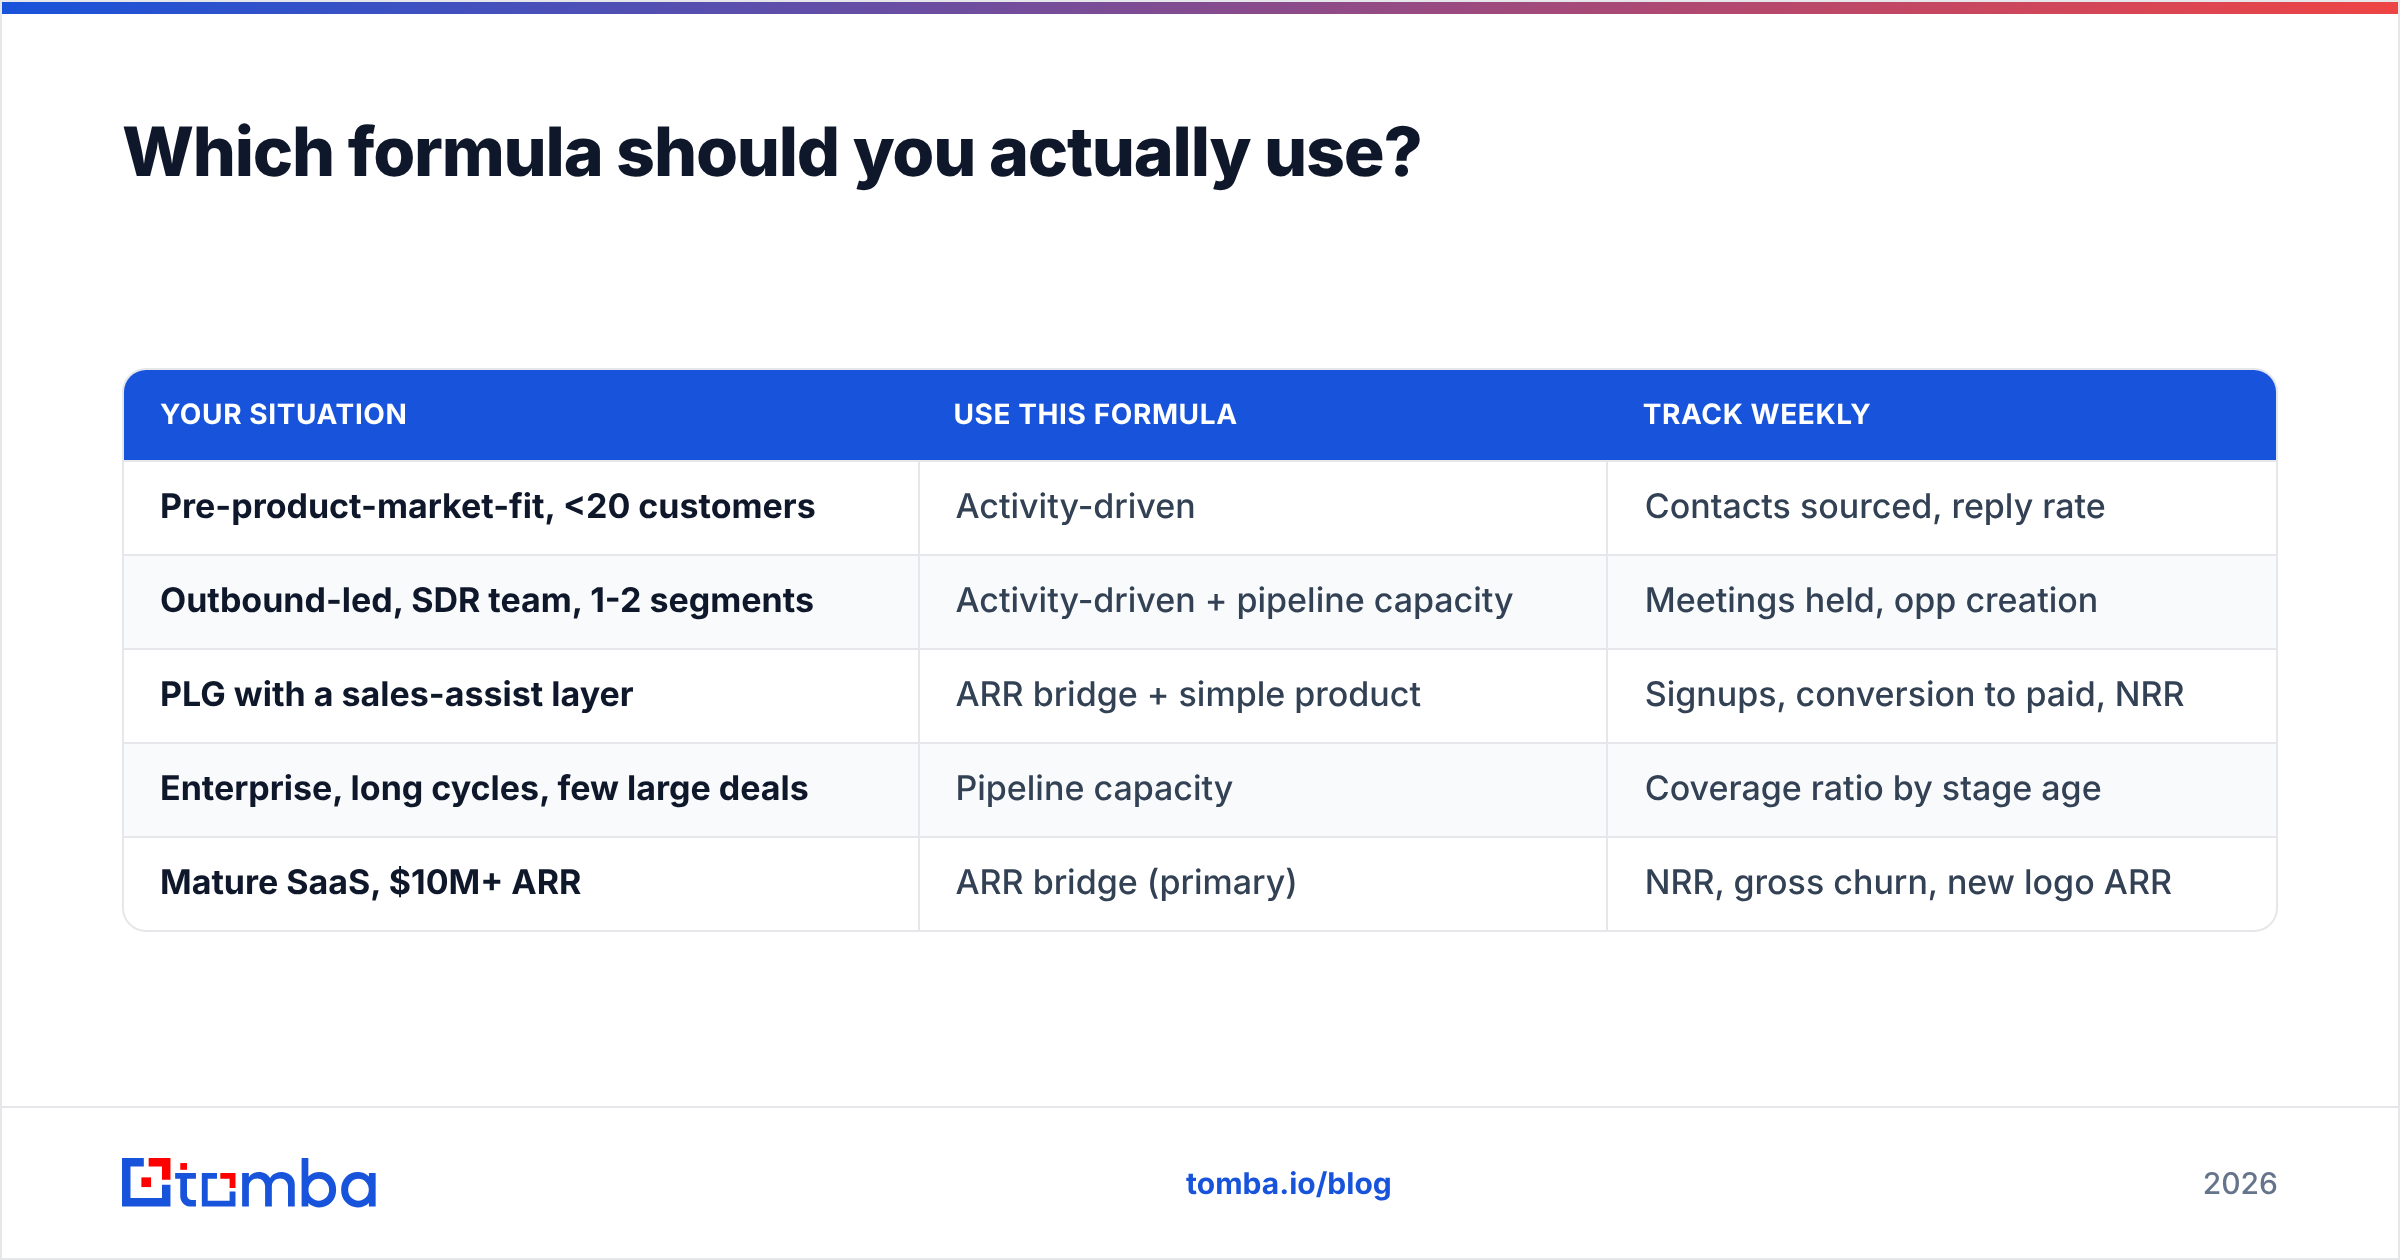
Which formula should you actually use?#
| Your situation | Use this formula | Track weekly |
|---|---|---|
| Pre-product-market-fit, <20 customers | Activity-driven | Contacts sourced, reply rate |
| Outbound-led, SDR team, 1-2 segments | Activity-driven + pipeline capacity | Meetings held, opp creation |
| PLG with a sales-assist layer | ARR bridge + simple product | Signups, conversion to paid, NRR |
| Enterprise, long cycles, few large deals | Pipeline capacity | Coverage ratio by stage age |
| Mature SaaS, $10M+ ARR | ARR bridge (primary) | NRR, gross churn, new logo ARR |
If you are running more than one motion, run more than one model. They should reconcile at the revenue line; where they diverge, you have found a measurement problem worth an afternoon.
Put the formula to work#
Every revenue model above bottoms out at the same input: how many real, reachable, correctly-targeted contacts you can put in front of your team this month. That number is not fixed and it is not free — it is sourced, verified, and refreshed.
Tomba's Email Finder builds that input directly, finding professional email addresses by domain, name, or company, with verification built into the same workflow so your deliverable-contact count and your sourced-contact count stay close together. Start on the free tier at 25 searches a month to sanity-check the accuracy against a list you already trust, then scale to Starter at $49/mo or Growth at $99/mo when the model tells you how many contacts a month you actually need. Full Tomba pricing is public, so you can put the cost per sourced contact straight into tab 1 of your spreadsheet where it belongs.
Related guides#
Ready to find emails that actually work?
Join 150,000+ professionals who stopped guessing and started sending. Free credits on signup — no credit card required.
Get the Tomba newsletter
Practical outbound tactics and product updates — once every two weeks.
About the author