Forrester Wave Sales Engagement 2026: How to Read It Right
The Forrester Wave is the analyst report every sales engagement vendor quotes in its deck. Here is what the scoring actually measures, what it leaves out, and how to run a 30-day evaluation that beats any grid.
TL;DR
- The Forrester Wave sales engagement report scores vendors. It does not make your buying decision. It ranks tools against criteria Forrester picked, not yours.
- Leader placement tracks company size and roadmap depth. It does not track how fast your reps book meetings.
- The Wave scores the sending layer. It does not score the contact data you feed that layer. That data is where most outbound breaks.
- A 30-day paid pilot beats any analyst grid. Use your own list, your own reps, and one control group.
- Budget for the whole stack, not one line item: seats, data credits, verification, and inbox setup.
What is the Forrester Wave sales engagement report?#
The Forrester Wave is Forrester Research's vendor-comparison format. Analysts pick a market. They set the scoring criteria. They invite vendors that qualify. Then they score each one on dozens of weighted line items. Results go on a two-axis chart: current offering across, strategy up. Bubble size shows market presence. The four bands are Leaders, Strong Performers, Contenders, and Challengers.
Sales engagement covers sequencing, dialers, email cadences, task queues, and rep analytics. For that market, the Wave is the report a CRO forwards to RevOps with one line: "let's shortlist from this." Salesloft, Outreach, Groove, and Salesforce have all shown up over the years. Each one put a Wave badge on its homepage within a week.
Check one thing first: which report you are reading. Forrester keeps reshaping this market. Standalone sales engagement coverage now sits inside broader "revenue orchestration" and "revenue enablement" reports. Vendors grew from cadence tools into forecasting, call analysis, and deal management. So a 2022 Wave and a 2024 Wave score different things under similar names. Confirm the title, quarter, and criteria on Forrester's own site. The vendor-hosted PDF is usually the edition that flattered them most.
How does Forrester actually score vendors?#
The Wave method is more open than most. The criteria and weights sit inside the report. Vendors get a 0-5 score per line item. Three buckets drive the chart:
- Current offering — what the product does today. Sequencing, dialer quality, CRM sync, AI features, reporting, admin controls, security. Scored from demos, briefings, and reference calls.
- Strategy — where the vendor says it is going. Vision, roadmap, partners, pricing, and community. This bucket rewards vendors with polished product marketing.
- Market presence — revenue, customers, headcount. It does not move the dot. It only makes the dot bigger.
Two facts matter when you read the chart:
- Taking part is optional. Some vendors skip the briefing. Others sit below the size cutoff. Either way, they never appear. A missing vendor is not a weak vendor. It is often a smaller or more focused one.
- The weights are Forrester's, not yours. Say the report leans hard on call analysis. If your team runs email and LinkedIn only, a Leader's edge there buys you nothing. Re-score the vendors with your own weights. The raw line-item scores make that about an hour of spreadsheet work.
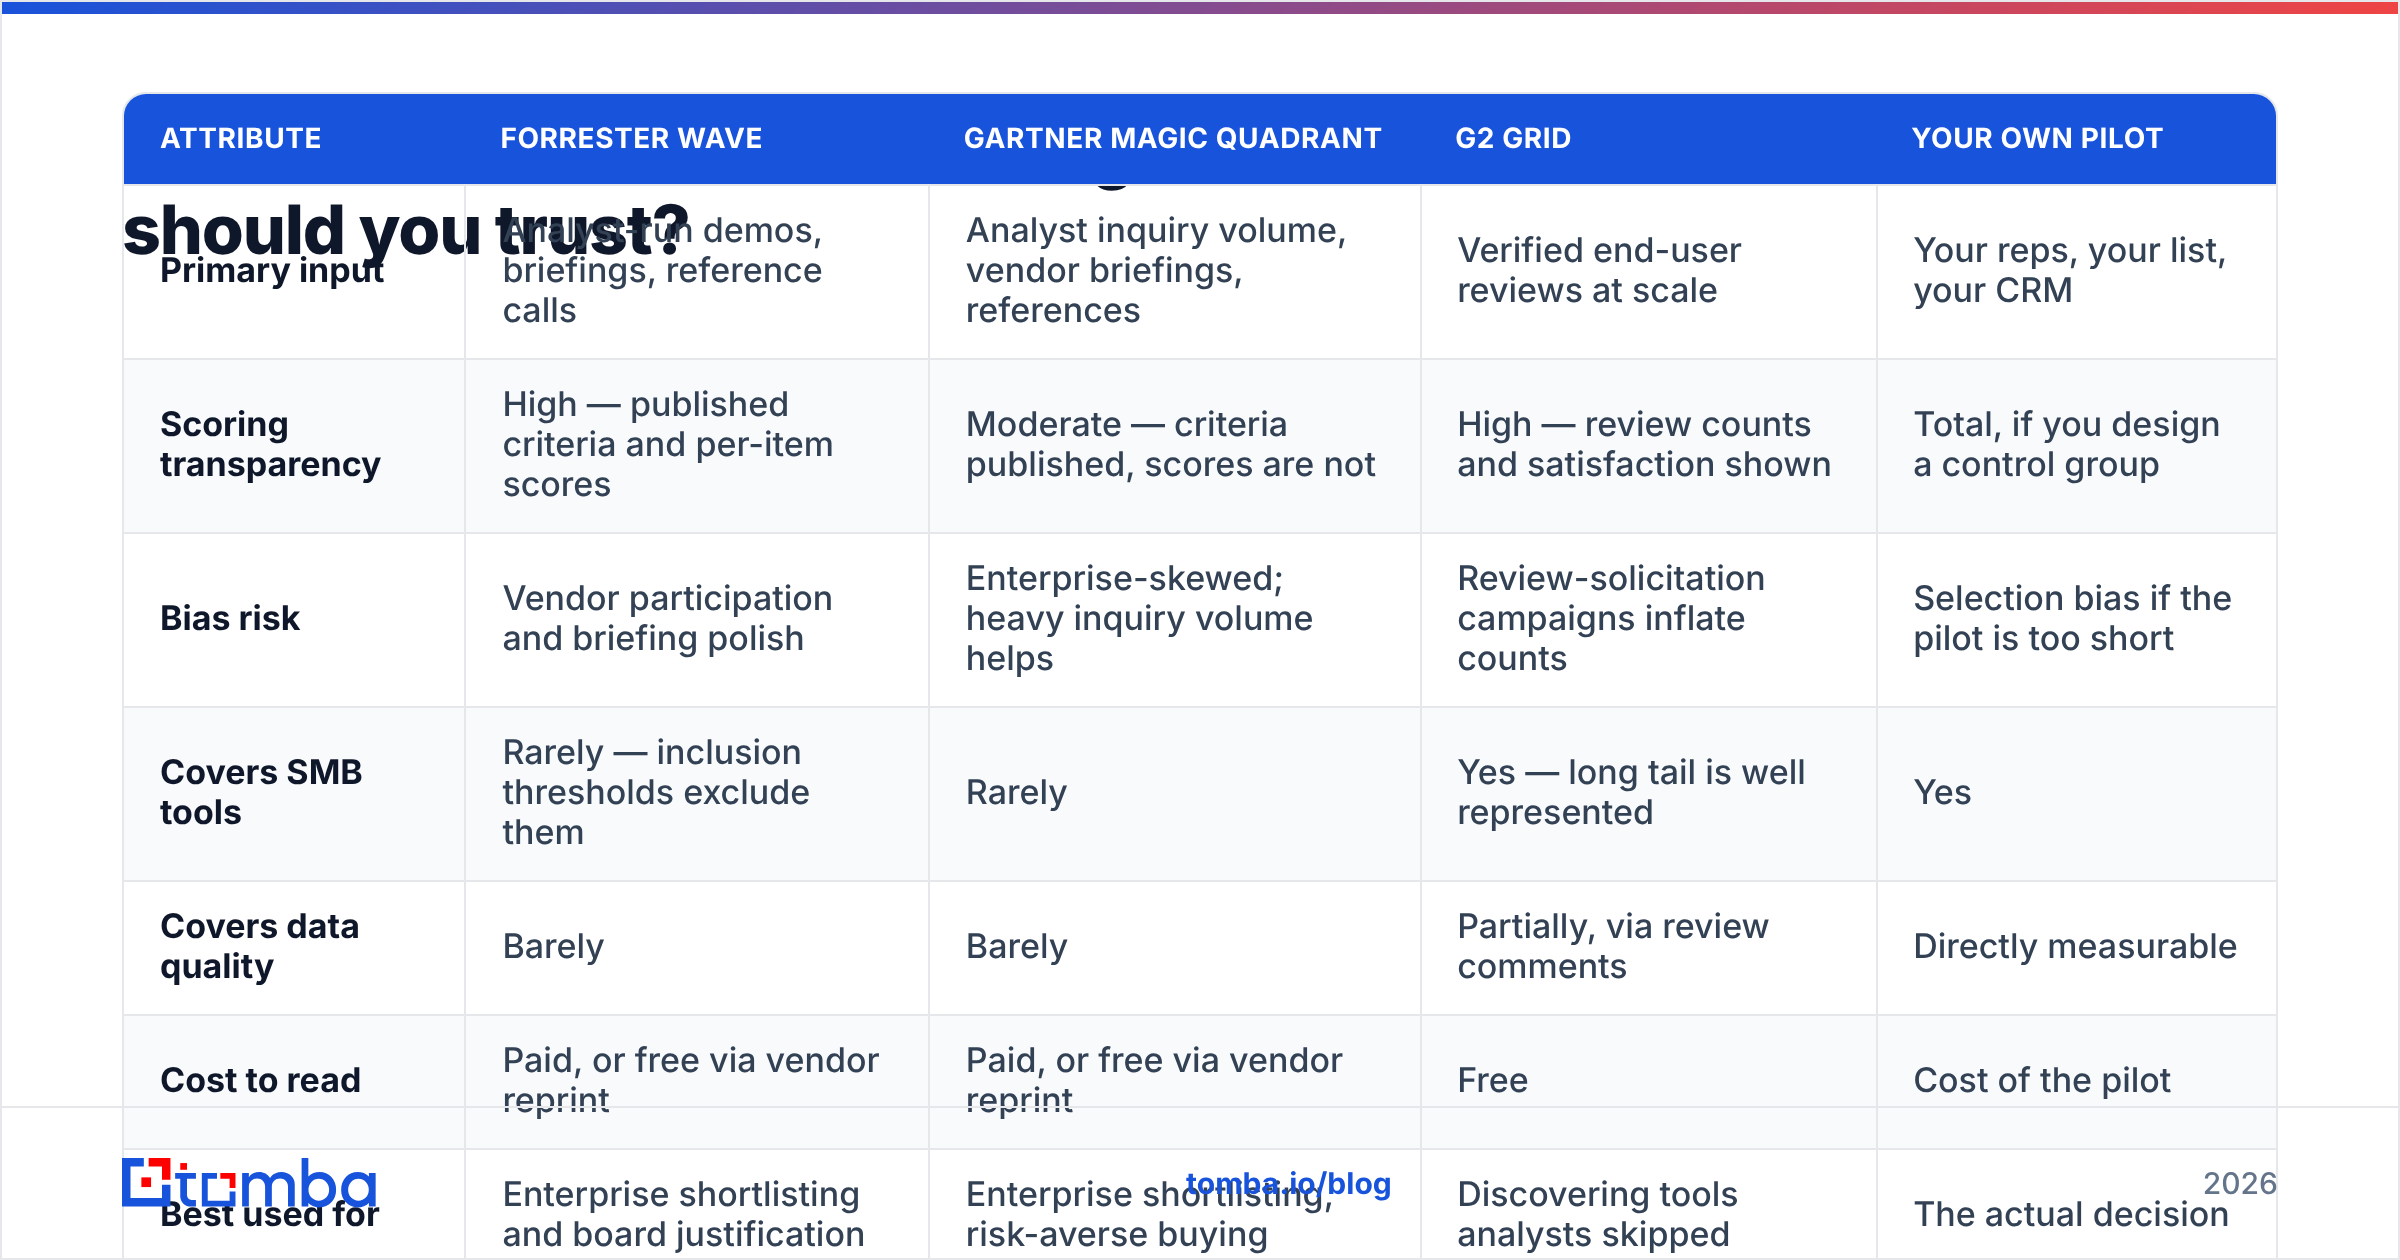
Forrester Wave vs Gartner Magic Quadrant vs G2: which should you trust?#
None of them alone. They answer different questions. The honest move is to read all three.
| Attribute | Forrester Wave | Gartner Magic Quadrant | G2 Grid | Your own pilot |
|---|---|---|---|---|
| Primary input | Analyst-run demos, briefings, reference calls | Analyst inquiry volume, vendor briefings, references | Verified end-user reviews at scale | Your reps, your list, your CRM |
| Scoring transparency | High — published criteria and per-item scores | Moderate — criteria published, scores are not | High — review counts and satisfaction shown | Total, if you design a control group |
| Bias risk | Vendor participation and briefing polish | Enterprise-skewed; heavy inquiry volume helps | Review-solicitation campaigns inflate counts | Selection bias if the pilot is too short |
| Covers SMB tools | Rarely — inclusion thresholds exclude them | Rarely | Yes — long tail is well represented | Yes |
| Covers data quality | Barely | Barely | Partially, via review comments | Directly measurable |
| Cost to read | Paid, or free via vendor reprint | Paid, or free via vendor reprint | Free | Cost of the pilot |
| Best used for | Enterprise shortlisting and board justification | Enterprise shortlisting, risk-averse buying | Discovering tools analysts skipped | The actual decision |
Here is the pattern that works. Use the Wave and the Gartner grid to pick three to five vendors. Use G2's sales engagement category to catch the small tools the analysts left out on size alone. Then run a pilot. The reports filter. They do not decide.
Which vendors typically appear in this category?#
Editions go stale fast. Archetypes do not. And the archetype predicts fit better than the dot position does:
- Enterprise suites — Outreach, Salesloft, Salesforce Sales Engagement. Deep CRM sync, admin controls, forecasting attached. Seats run into the high hundreds per rep per year. They win Leader slots because the Wave rewards breadth. They are also the hardest to rip out.
- CRM-native layers — tools that live inside Salesforce or HubSpot. Easy to adopt, weaker standalone reporting, excellent activity capture.
- Data-plus-sending bundles — Apollo and similar. One bill covers the database and the sequencer. The price looks good. But you inherit whatever that database knows about your segment.
- Specialist senders — Instantly, Smartlead, Lemlist. Built for high-volume cold email, with inbox rotation and warmup included. Usually too small for the Wave. Often the right pick for a 5-person team.
- LinkedIn-first tools — Waalaxy, Dripify, Expandi. Social touches first, email second.
Under 20 reps? The Leaders band is probably the wrong place to shop. Leader status comes from enterprise admin controls, global compliance, and roadmap breadth. You will never use those. You still pay for them in the seat price.
What does the Wave not measure?#
Data quality. That gap costs the most money and gets the least analyst attention.
A sales engagement platform is a delivery layer. It decides when a message goes out, on which channel, and what the rep sees next. It does not know if the address is real. It does not know if the person still owns the budget. That input comes from somewhere else — a database, a scraper, a bought list, or an email finder. The Wave criteria treat it as out of scope.
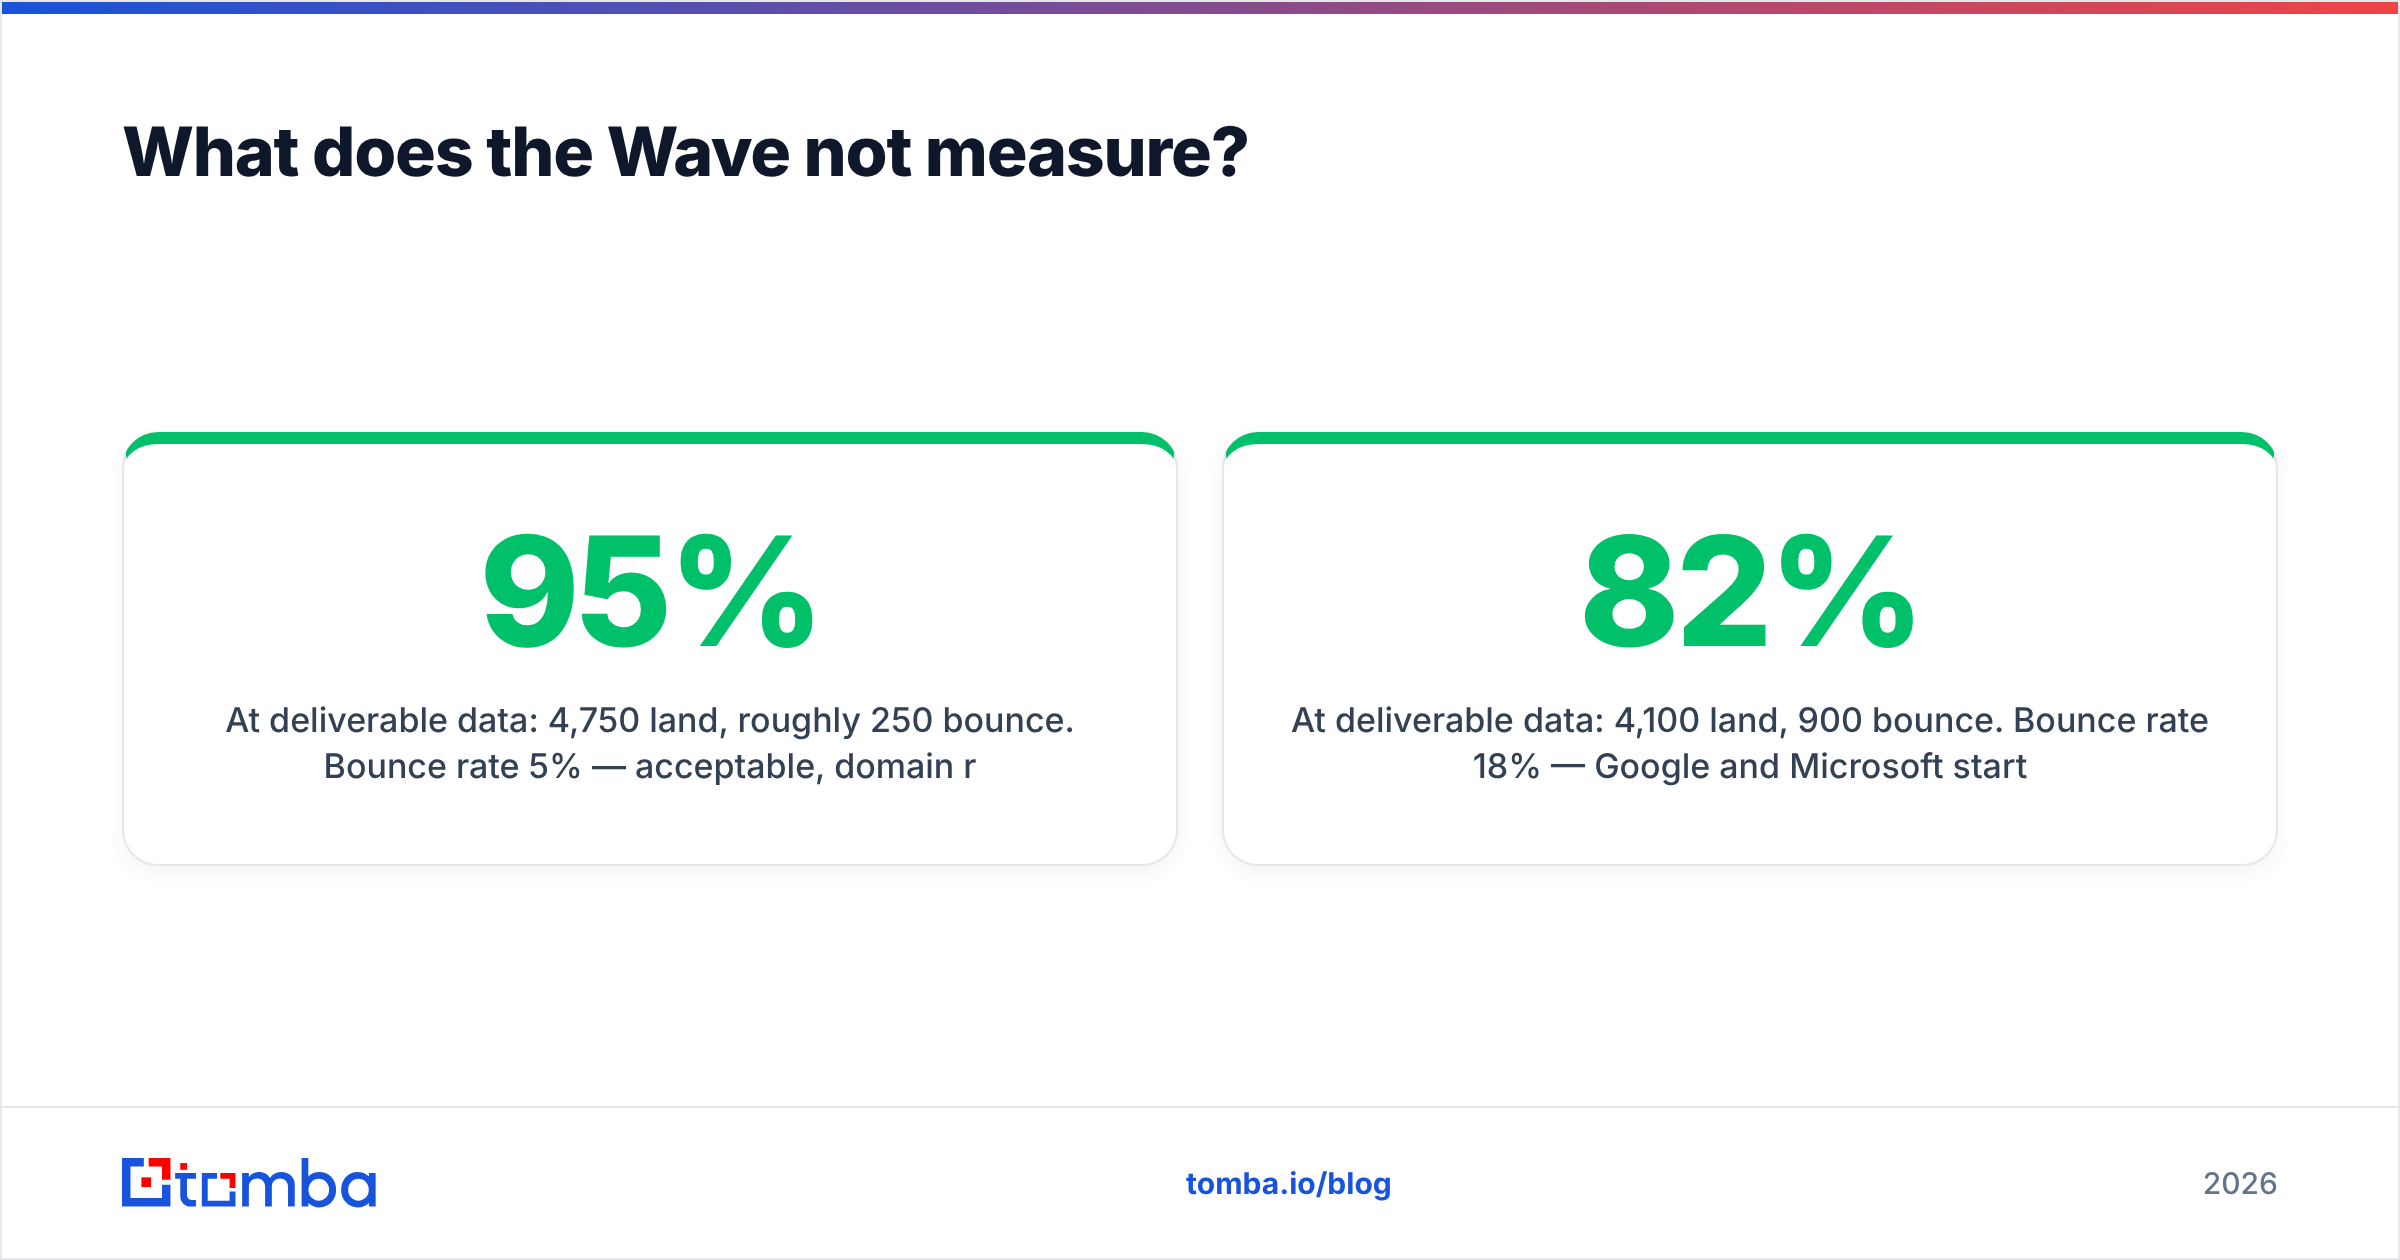
Here is the math no quadrant shows you. Take 5,000 contacts in a quarter:
- At 95% deliverable data: 4,750 land and about 250 bounce. A 5% bounce rate is fine. Your domain reputation holds.
- At 82% deliverable data: 4,100 land and 900 bounce. An 18% bounce rate is not fine. Google and Microsoft start filtering your domain within days. Even the good addresses stop reaching the inbox.
The second case looks like a platform failure. Reply rates fall. Reps blame the sequencer. Someone opens a conversation about switching vendors. But the sequencer was fine. The list was not. Run every import through an email verifier before it touches your sending platform. That prevents a problem no Leader-quadrant tool can fix downstream.
Catch-all domains behave the same way. The server accepts every address at SMTP time, then quietly drops the bad ones. Standard checks mark these "unknown." Most teams then delete them all and lose real contacts, or send to them all and inflate bounces. A catch-all verifier settles the question instead of guessing.
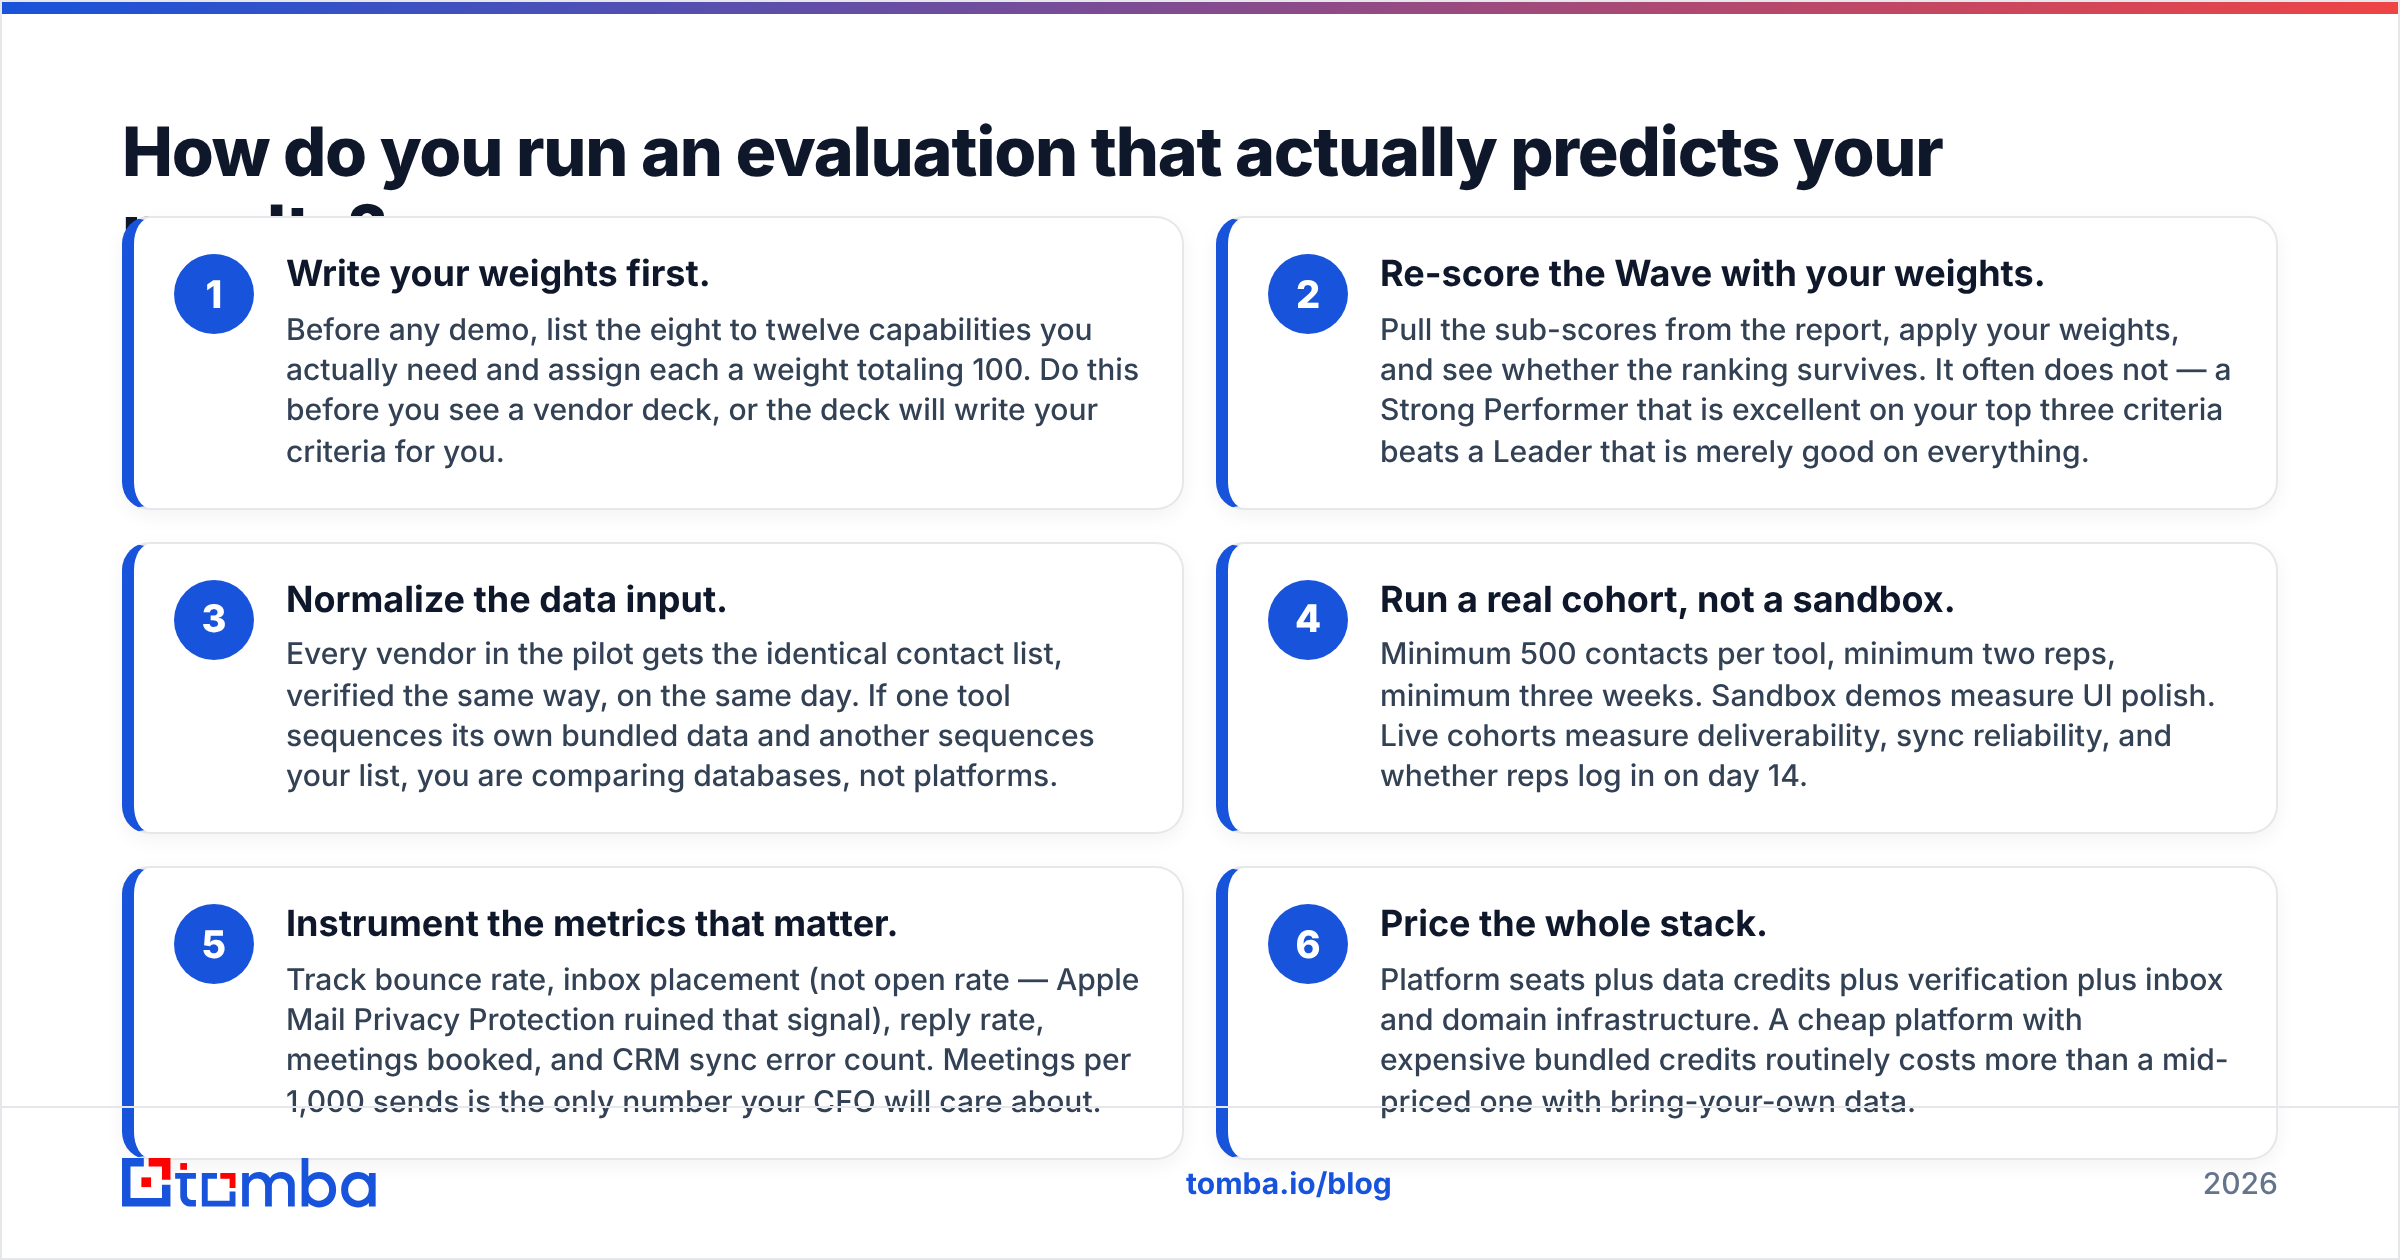
How do you run an evaluation that actually predicts your results?#
An analyst report ends in a chart. Your evaluation should end in a decision. Six steps, about 30 days.
- Write your weights first. List the eight to twelve things you truly need. Give each a weight that adds up to 100. Do this before you see a vendor deck. Otherwise the deck writes your criteria for you.
- Re-score the Wave with your weights. Pull the line-item scores. Apply your weights. See if the ranking holds. Often it does not. A Strong Performer that nails your top three beats a Leader that is merely good at everything.
- Use the same data for every tool. Each vendor gets the same list, verified the same way, on the same day. Otherwise you are comparing databases, not platforms.
The first three steps happen before a single email goes out. The last three are the pilot itself.
- Run a real cohort, not a sandbox. At least 500 contacts per tool, two reps, and three weeks. A demo shows you UI polish. A live cohort shows you deliverability, sync errors, and whether reps still log in on day 14.
- Track the numbers that matter. Bounce rate, inbox placement, reply rate, meetings booked, and CRM sync errors. Skip open rate — Apple Mail Privacy Protection broke that signal. Meetings per 1,000 sends is the number your CFO cares about.
- Price the whole stack. Seats, data credits, verification, inbox and domain setup. A cheap platform with pricey bundled credits often costs more than a mid-priced one where you bring your own data.
What does a realistic sales engagement stack cost?#
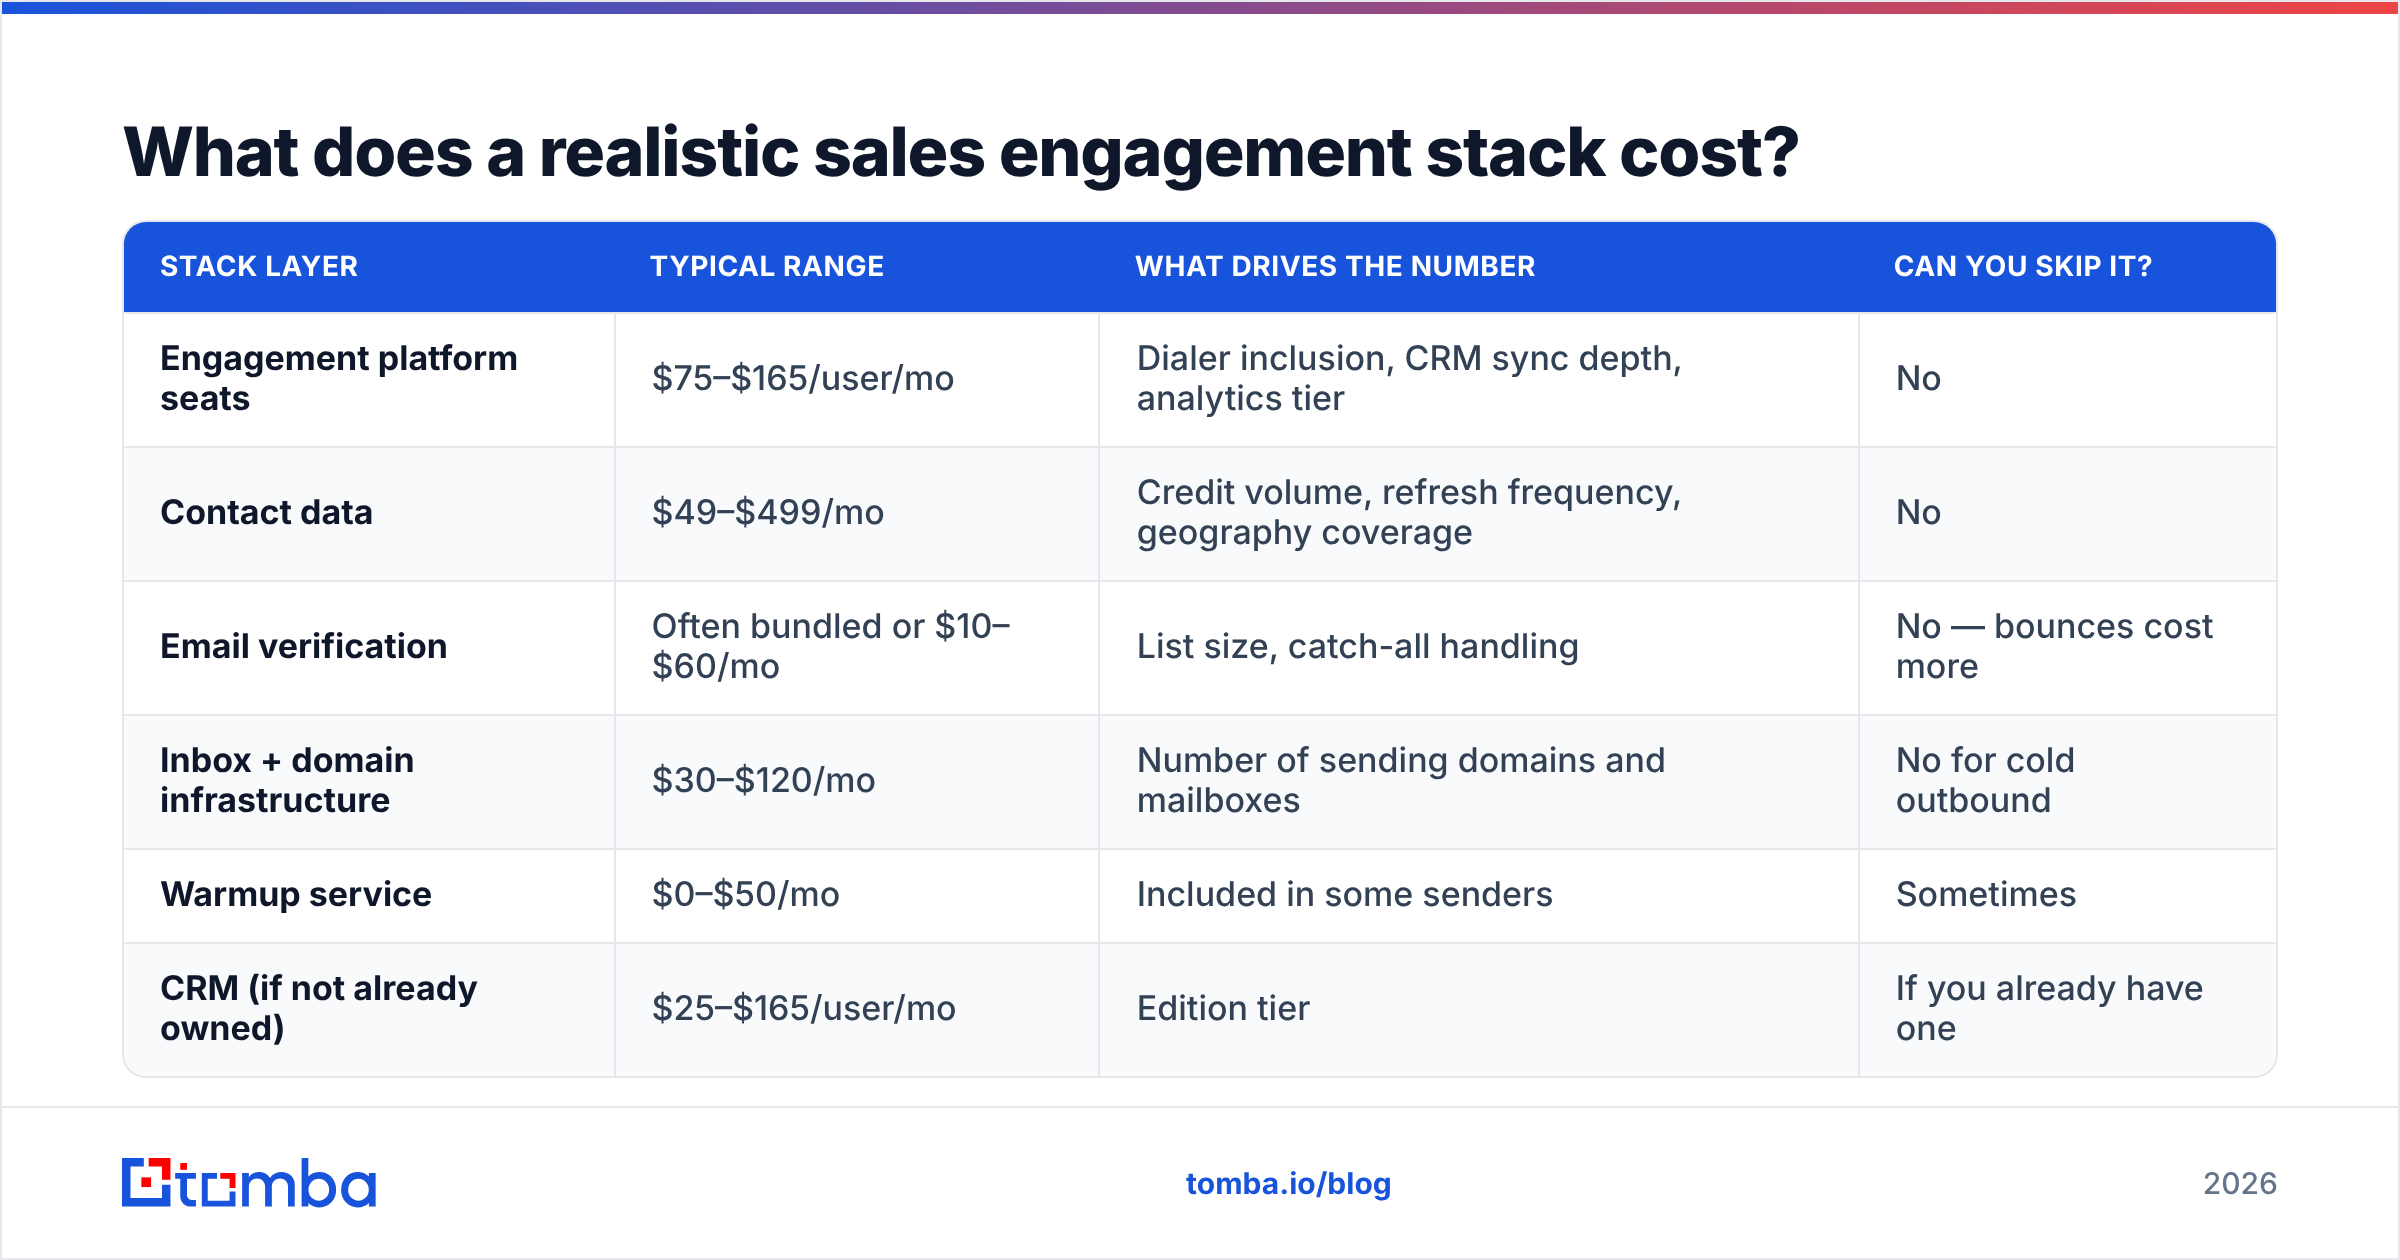
Analyst reports rarely publish prices. Vendor sites rarely publish them honestly. Here is the shape of the real bill for a 5-rep team, before you negotiate:
| Stack layer | Typical range | What drives the number | Can you skip it? |
|---|---|---|---|
| Engagement platform seats | $75–$165/user/mo | Dialer inclusion, CRM sync depth, analytics tier | No |
| Contact data | $49–$499/mo | Credit volume, refresh frequency, geography coverage | No |
| Email verification | Often bundled or $10–$60/mo | List size, catch-all handling | No — bounces cost more |
| Inbox + domain infrastructure | $30–$120/mo | Number of sending domains and mailboxes | No for cold outbound |
| Warmup service | $0–$50/mo | Included in some senders | Sometimes |
| CRM (if not already owned) | $25–$165/user/mo | Edition tier | If you already have one |
For the data layer, Tomba pricing starts free at 25 searches a month. Starter is $49/mo, Growth is $99/mo, and Pro is $249/mo. Enterprise is negotiated. The point is not that one line item is cheap. The point is that you should be able to swap the data layer on its own. If your data is bundled into your sending tool, you cannot change one without changing both. That is how three-year contracts renew by default. Price any Forrester Wave sales engagement shortlist this way, line by line.
If you automate the handoff between data and sending, the Tomba API covers find, verify, and enrich in one call pattern. The pipeline stays in your own stack, not in a vendor's export queue.
Should you buy a Leader?#
Buy a Leader when three things are true. You have more than 100 reps. Procurement wants SOC 2 and regional data residency on paper. And someone on your board will ask which analyst report backs the call. In that case the Wave earns its keep. It lowers risk on a big purchase and gives you language to defend it.
Buy outside the Leaders if you have fewer than 50 reps. Same if your motion is email and LinkedIn heavy, or if your real bottleneck is list quality. Leader placement comes from enterprise governance features. Paying for those at 12 reps is like insuring a car you do not own.
Either way, treat the report as one input of four: the analyst grid, peer reviews, reference calls with companies your size, and a paid pilot with a control group. The Wave tells you what analysts scored last cycle. Your pilot tells you what your reps will do next quarter. Only one of those shows up in the forecast.
Where to start this week#
Pick two finalists from the Forrester Wave sales engagement grid. Then fix the input before you test the output. Pull a clean 500-contact list for each one with Tomba Email Finder. Search by domain, name, or company. Verify every result before it enters the sequencer. Run both pilots on the same data. Start on the free tier at 25 searches to check coverage in your segment. Move to Starter at $49/mo once the list is ready. When the results come back, you will know if the difference was the platform or the list. That is the one question no analyst report can answer for you.
Related guides#
Ready to find emails that actually work?
Join 150,000+ professionals who stopped guessing and started sending. Free credits on signup — no credit card required.
Get the Tomba newsletter
Practical outbound tactics and product updates — once every two weeks.
About the author