Funnel Metrics: The 9 Numbers That Predict Pipeline in 2026
Most funnel dashboards are full of numbers nobody acts on. This guide breaks down the nine funnel metrics that actually forecast revenue, how to calculate each one correctly, and the benchmarks worth measuring against.
TL;DR
- Most funnel dashboards measure activity (emails sent, MQLs created) instead of the nine funnel metrics that actually move a forecast: stage conversion, velocity, speed-to-lead, win rate, ACV, cycle length, pipeline coverage, CAC payback, and net revenue retention.
- Snapshot conversion rates lie. Cohort-based conversion — tracking the same set of leads forward through time — is the only version that survives a board meeting.
- Bad contact data corrupts every downstream funnel metric. If 18% of your list bounces, your reply rate, MQL rate, and stage-1 conversion are all inflated or deflated in ways nobody can untangle.
- Benchmarks are directional, not diagnostic. The useful comparison is your funnel this quarter vs. your funnel last quarter, segmented by source.
- Pick five metrics, define them in writing, and review them weekly. A 40-tile dashboard nobody reads is worse than a five-line spreadsheet everybody does.
What are funnel metrics, and which ones actually matter?#
Funnel metrics are the quantitative checkpoints that describe how prospects move from first touch to closed revenue — and how fast, how expensively, and how reliably they do it.
The problem is not that teams lack metrics. It's that most teams track 30 and act on zero. A metric earns its place on your dashboard only if a bad number triggers a specific action by a specific person within a specific week. Everything else is decoration.
Here are the nine that pass that test:
- Stage-to-stage conversion rate — the percentage of opportunities that advance from one defined stage to the next. This is the load-bearing metric. Every other funnel number is downstream of it.
- Funnel velocity — how many days a deal spends in each stage. Slowing velocity in a single stage is the earliest reliable warning sign of a quarter going sideways.
- Speed-to-lead — minutes between an inbound signal and the first human reply. It correlates more tightly with conversion than almost any messaging variable you can tune.
- Win rate — closed-won divided by all closed opportunities (won plus lost). Excluding losses is the single most common way teams accidentally inflate this.
- Average contract value (ACV) — the revenue per closed deal, segmented by source. Cheap leads that close small are not cheap.
- Sales cycle length — median (not mean) days from opportunity creation to close. One 400-day enterprise deal will wreck your average and your planning.
- Pipeline coverage — open pipeline divided by quota for the period. Below 3x for most B2B motions and you're forecasting a miss regardless of how good the deals look.
- CAC payback period — months of gross margin required to recover the fully loaded cost of acquiring a customer. This is where funnel efficiency meets the P&L.
- Net revenue retention (NRR) — expansion minus churn on the existing base. The funnel doesn't end at closed-won, and pretending it does is why so many "healthy funnel" companies stall at flat growth.

Why do most funnel dashboards measure the wrong things?#
Because activity is easy to count and outcomes are hard to attribute.
Emails sent, calls dialed, demos booked, and content downloads all produce clean, fast-moving numbers. They feel like progress. But none of them are causally linked to revenue without a conversion rate sitting underneath them. A rep who sends 400 emails a week at a 0.4% reply rate is generating less pipeline than a rep who sends 90 at 4% — while looking twice as productive on every activity dashboard.
Three specific failure modes show up in nearly every funnel review:
Snapshot conversion instead of cohort conversion. Dividing this month's opportunities by this month's leads mixes populations. Those opportunities largely came from last quarter's leads. When lead volume changes month to month, snapshot conversion swings wildly for reasons that have nothing to do with performance. Track a cohort — all leads created in March — and follow that same group forward.
Averages instead of medians and distributions. Sales cycle length is almost always right-skewed. Report the median plus the 25th and 75th percentiles, or you'll plan your quarter around a number that describes no actual deal.
Unsegmented aggregates. A blended 22% stage-2 conversion rate can hide inbound converting at 41% and outbound converting at 6%. The blend tells you nothing actionable. Segment by source, segment by segment size, segment by ICP fit — then look again.
Research summarized in HubSpot's State of Marketing report has consistently found that teams reporting on revenue impact rather than activity volume are far more likely to hit targets — not because the reporting causes the result, but because it changes which conversations happen in the pipeline review.
Which funnel metrics should you track at each stage?#
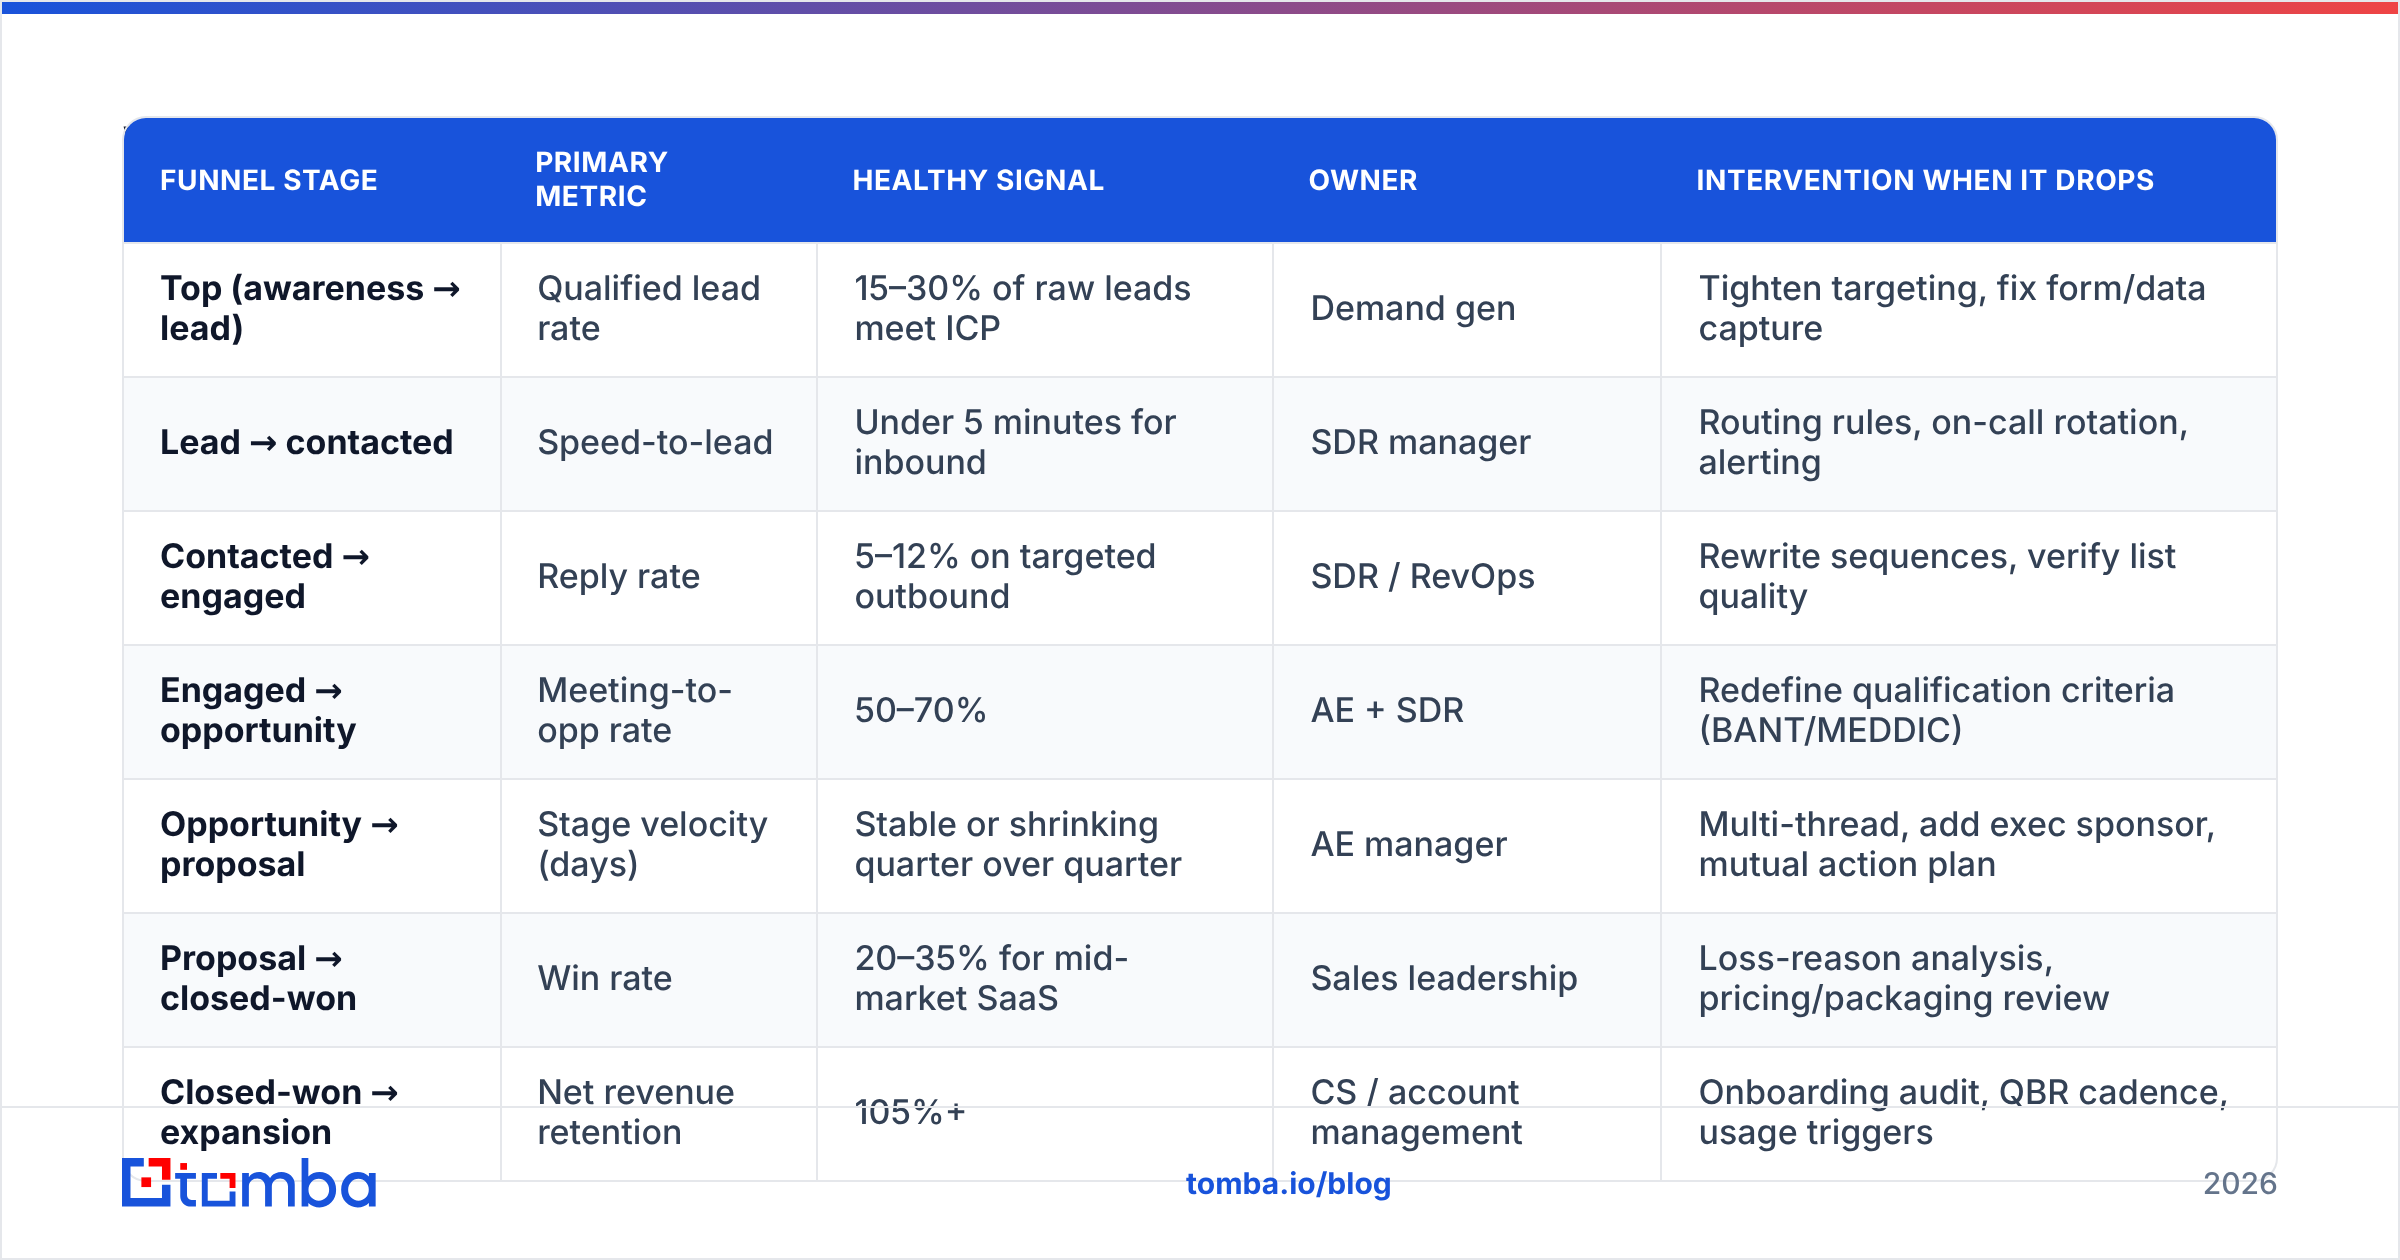
Assign every metric an owner and an intervention. If a metric drops and nobody knows whose problem it is, it isn't a metric — it's trivia.
| Funnel stage | Primary metric | Healthy signal | Owner | Intervention when it drops |
|---|---|---|---|---|
| Top (awareness → lead) | Qualified lead rate | 15–30% of raw leads meet ICP | Demand gen | Tighten targeting, fix form/data capture |
| Lead → contacted | Speed-to-lead | Under 5 minutes for inbound | SDR manager | Routing rules, on-call rotation, alerting |
| Contacted → engaged | Reply rate | 5–12% on targeted outbound | SDR / RevOps | Rewrite sequences, verify list quality |
| Engaged → opportunity | Meeting-to-opp rate | 50–70% | AE + SDR | Redefine qualification criteria (BANT/MEDDIC) |
| Opportunity → proposal | Stage velocity (days) | Stable or shrinking quarter over quarter | AE manager | Multi-thread, add exec sponsor, mutual action plan |
| Proposal → closed-won | Win rate | 20–35% for mid-market SaaS | Sales leadership | Loss-reason analysis, pricing/packaging review |
| Closed-won → expansion | Net revenue retention | 105%+ | CS / account management | Onboarding audit, QBR cadence, usage triggers |
Note what's missing: there's no row for "emails sent." Volume is an input you tune, not a result you report.
What are realistic funnel metric benchmarks in 2026?#
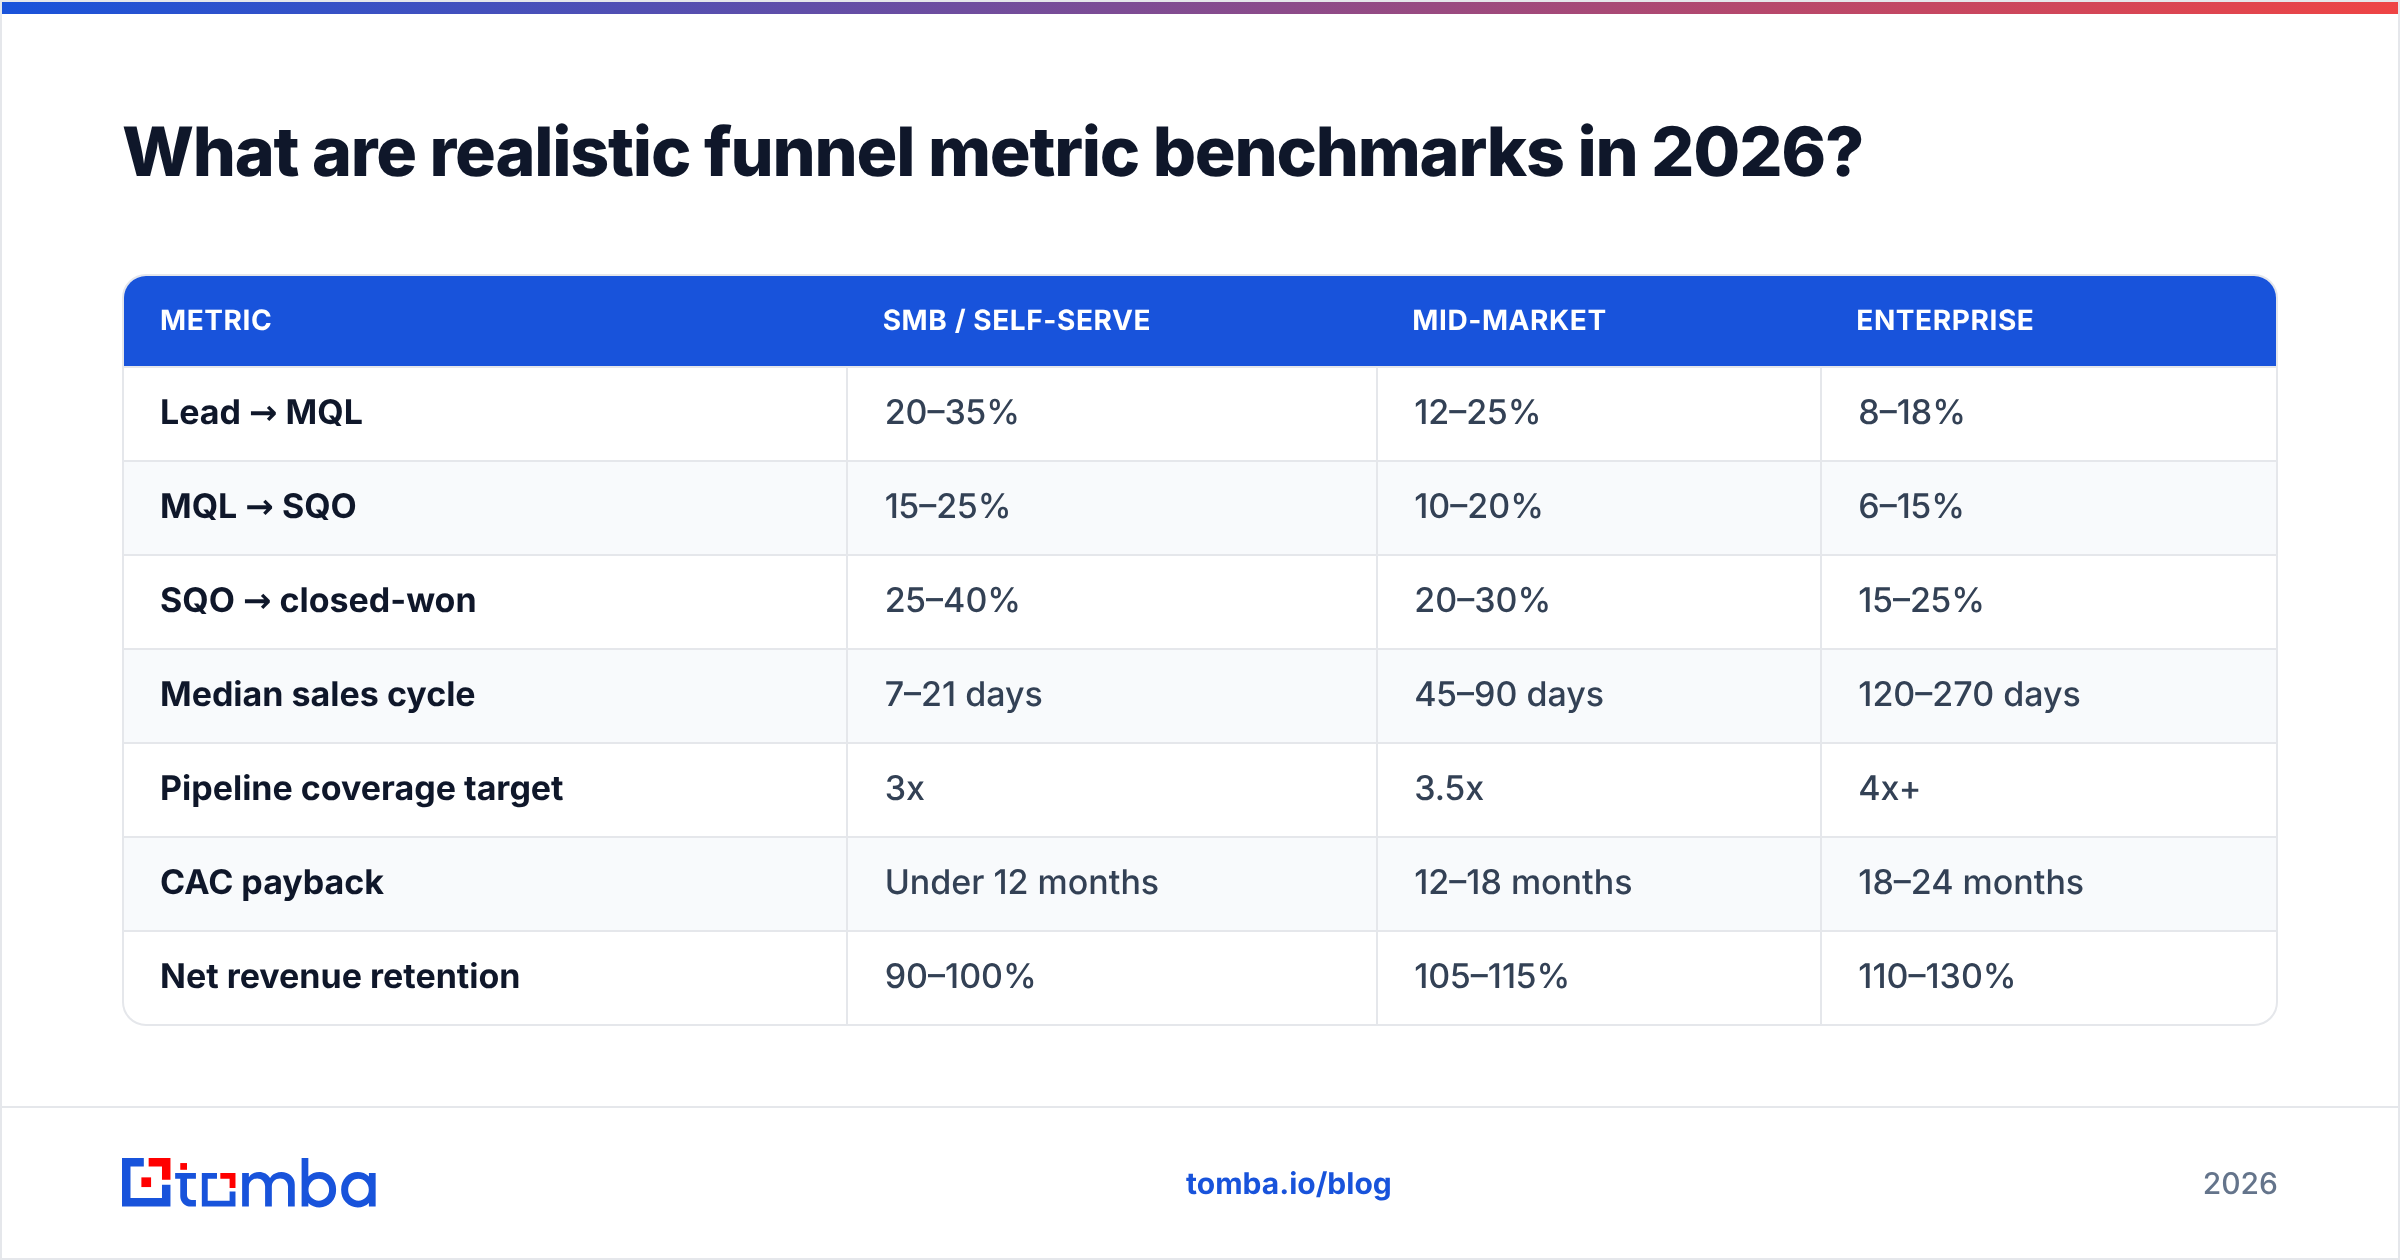
Benchmarks are a sanity check, not a target. Your motion, price point, and market maturity move every one of these numbers by double digits. Use them to spot outliers — a 2% win rate or a 90% meeting-to-opp rate both mean something is defined wrong — then throw them away and compare yourself to yourself.
| Metric | SMB / self-serve | Mid-market | Enterprise |
|---|---|---|---|
| Lead → MQL | 20–35% | 12–25% | 8–18% |
| MQL → SQO | 15–25% | 10–20% | 6–15% |
| SQO → closed-won | 25–40% | 20–30% | 15–25% |
| Median sales cycle | 7–21 days | 45–90 days | 120–270 days |
| Pipeline coverage target | 3x | 3.5x | 4x+ |
| CAC payback | Under 12 months | 12–18 months | 18–24 months |
| Net revenue retention | 90–100% | 105–115% | 110–130% |
Two caveats worth internalizing. First, Gartner's sales research has repeatedly documented that buying groups in complex B2B deals now involve 10 or more stakeholders — which means a "single-threaded" opportunity is statistically a stalled one no matter how good the stage conversion looks. Second, Salesforce's State of Sales research shows reps spend a minority of their week actually selling; if your funnel metrics don't account for capacity, your coverage math is fiction.
How do you calculate stage conversion rate without fooling yourself?#
Use a cohort, count losses, and freeze your stage definitions.
The cohort method in practice:
- Define the cohort by creation date. All opportunities created between March 1 and March 31. Never re-open the cohort.
- Wait one full sales cycle. If your median cycle is 60 days, March's cohort isn't readable until late May. Reporting it in April guarantees an artificially low conversion rate.
- Count every outcome. Won, lost, and still-open. Report all three. A 30% win rate with 55% still open at 2x median cycle is not a 30% win rate — it's a stalled funnel wearing a disguise.
- Segment before you conclude. Split by source, ICP tier, and rep tenure. The aggregate almost always hides the finding.
- Log the definition change. When you redefine "SQO" in Q3, annotate the chart. Half of all "conversion rate improvements" in B2B are stage-definition drift, not performance.
On the MQL question specifically: the marketing qualified lead is not dead, but it's demoted. Treating an MQL as a handoff artifact — a scored contact that marketing throws over a wall — produces the classic argument where sales says the leads are garbage and marketing says sales doesn't work them. Treating MQL as a diagnostic metric on the way to SQO, with a shared definition both teams signed, makes it useful again.
How does bad contact data distort your funnel metrics?#
More than anything else on this list, and it's the failure nobody instruments.
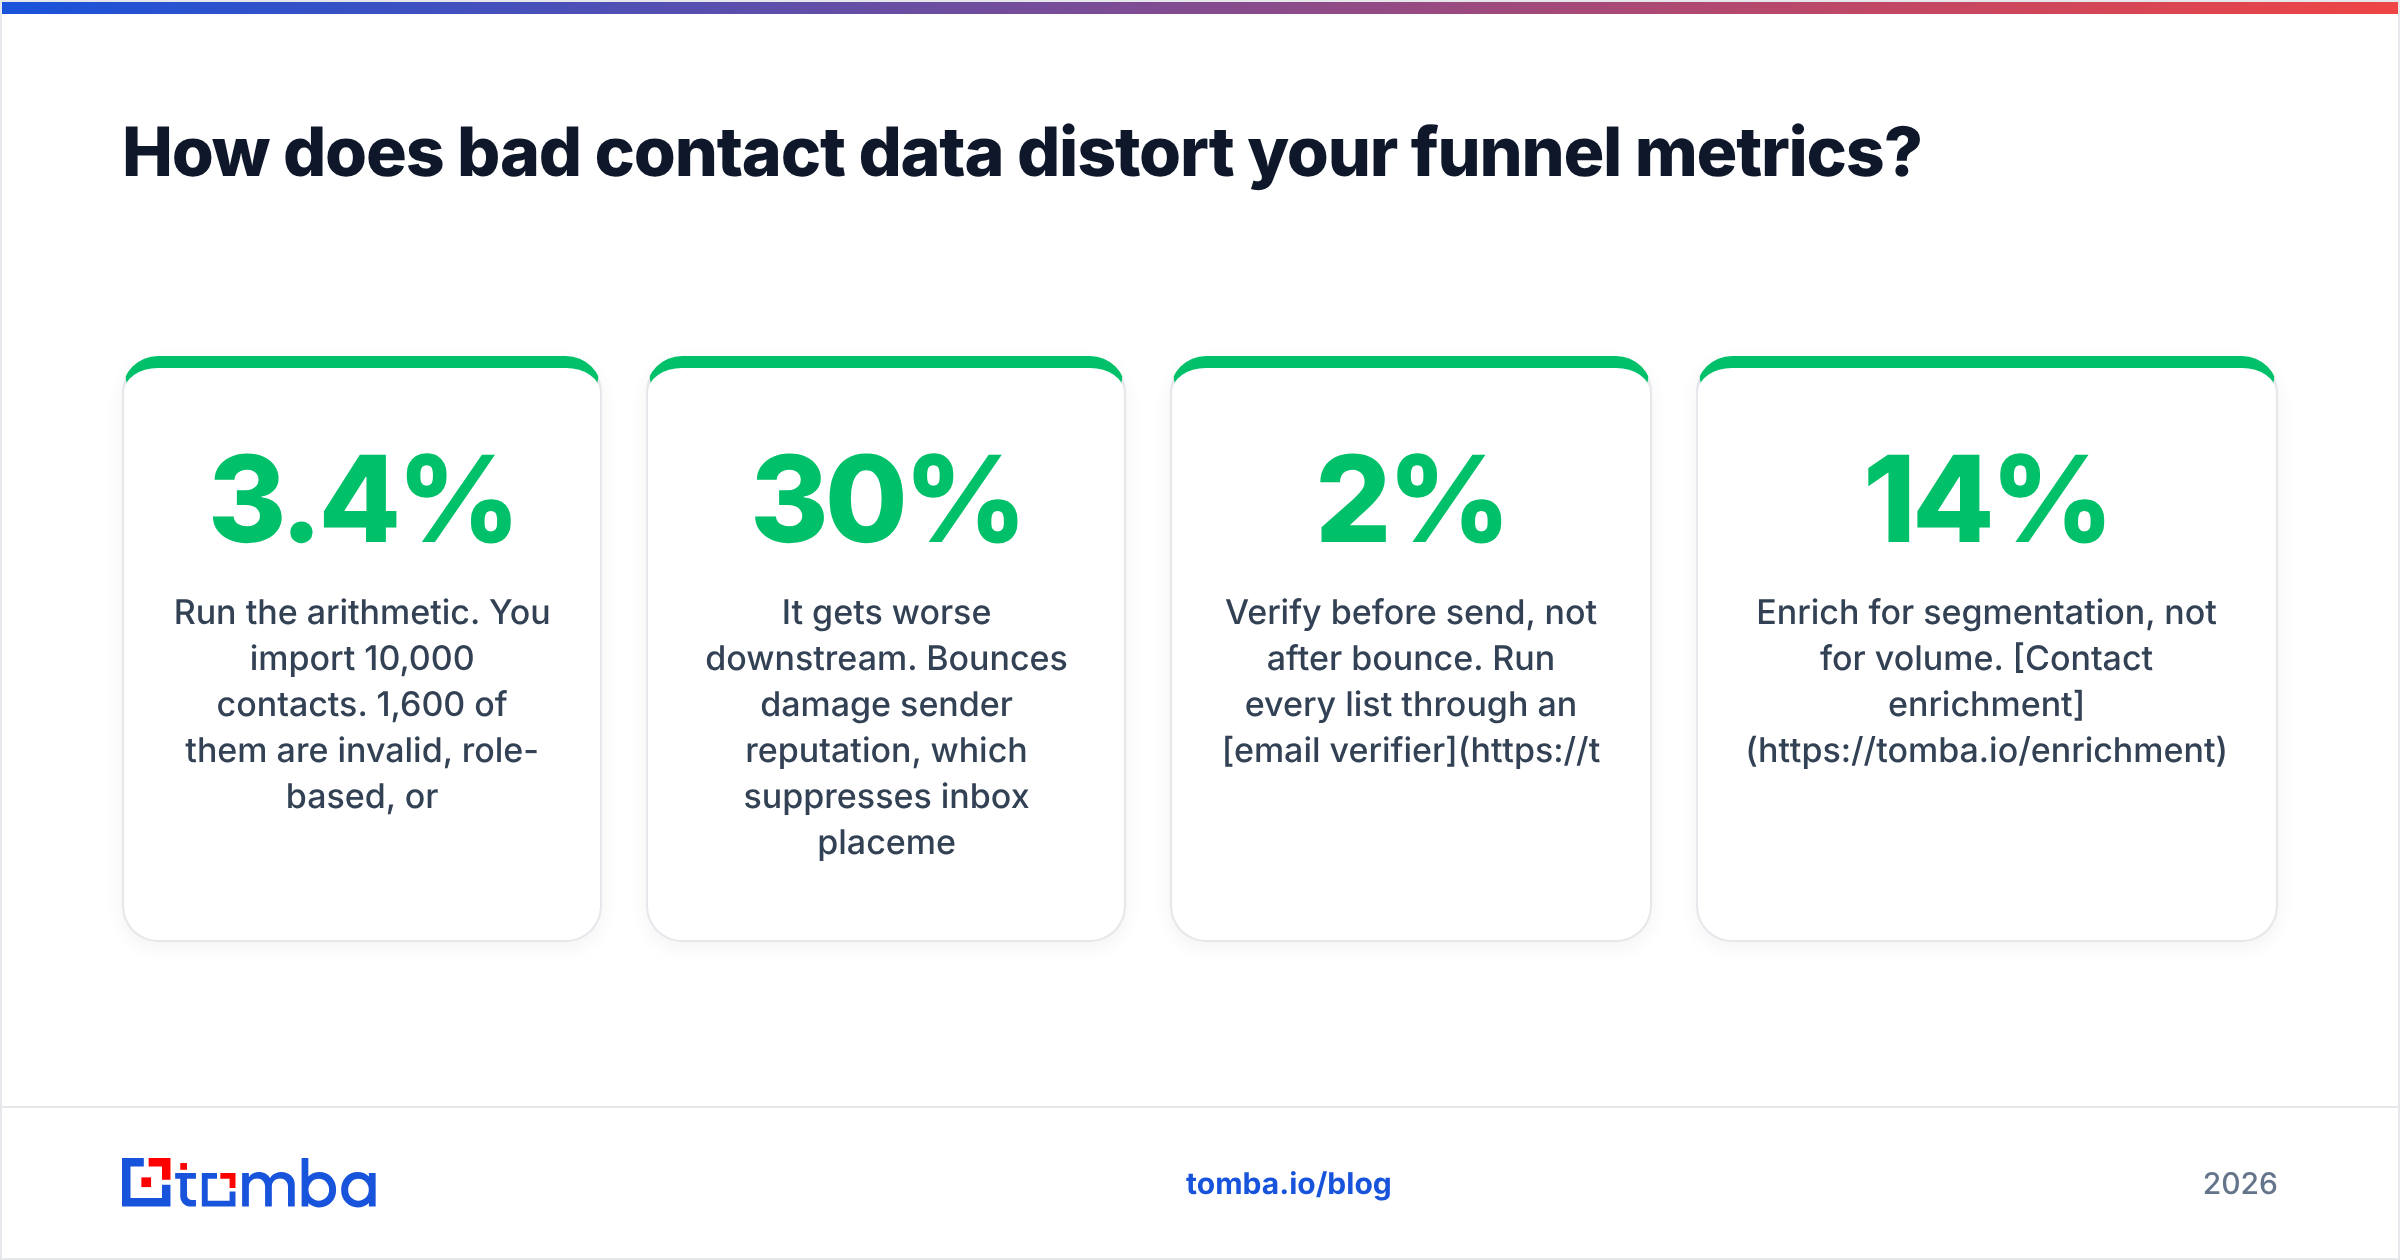
Run the arithmetic. You import 10,000 contacts. 1,600 of them are invalid, role-based, or long-departed. Your sequence goes out to 10,000, 8,400 land, and 340 reply. Reported reply rate: 3.4%. Actual reply rate against deliverable inboxes: 4.05%. That gap is small enough to ignore and large enough to make an A/B test meaningless — you'll conclude that subject line B beat subject line A when what actually happened is that list B was cleaner.
It gets worse downstream. Bounces damage sender reputation, which suppresses inbox placement, which lowers reply rate, which lowers meeting rate, which lowers your stage-1 conversion. Six weeks later somebody in a pipeline review asks why top-of-funnel conversion fell 30% and the answer — a bad data import in week one — is invisible on every dashboard in the company.
Three controls that fix it:
- Verify before send, not after bounce. Run every list through an email verifier and hold your bounce rate under 2%. This single control protects the integrity of every top-of-funnel metric you report.
- Enrich for segmentation, not for volume. Contact enrichment that fills in title, headcount, and industry lets you segment conversion by ICP tier. Without those fields, "our conversion rate is 14%" is a number with no explanatory power.
- Deduplicate at the source. Duplicate records inflate lead counts and deflate every conversion rate computed against them. They also make two reps call the same prospect, which shows up as a mysteriously bad response rate.

What's the difference between leading and lagging funnel metrics?#
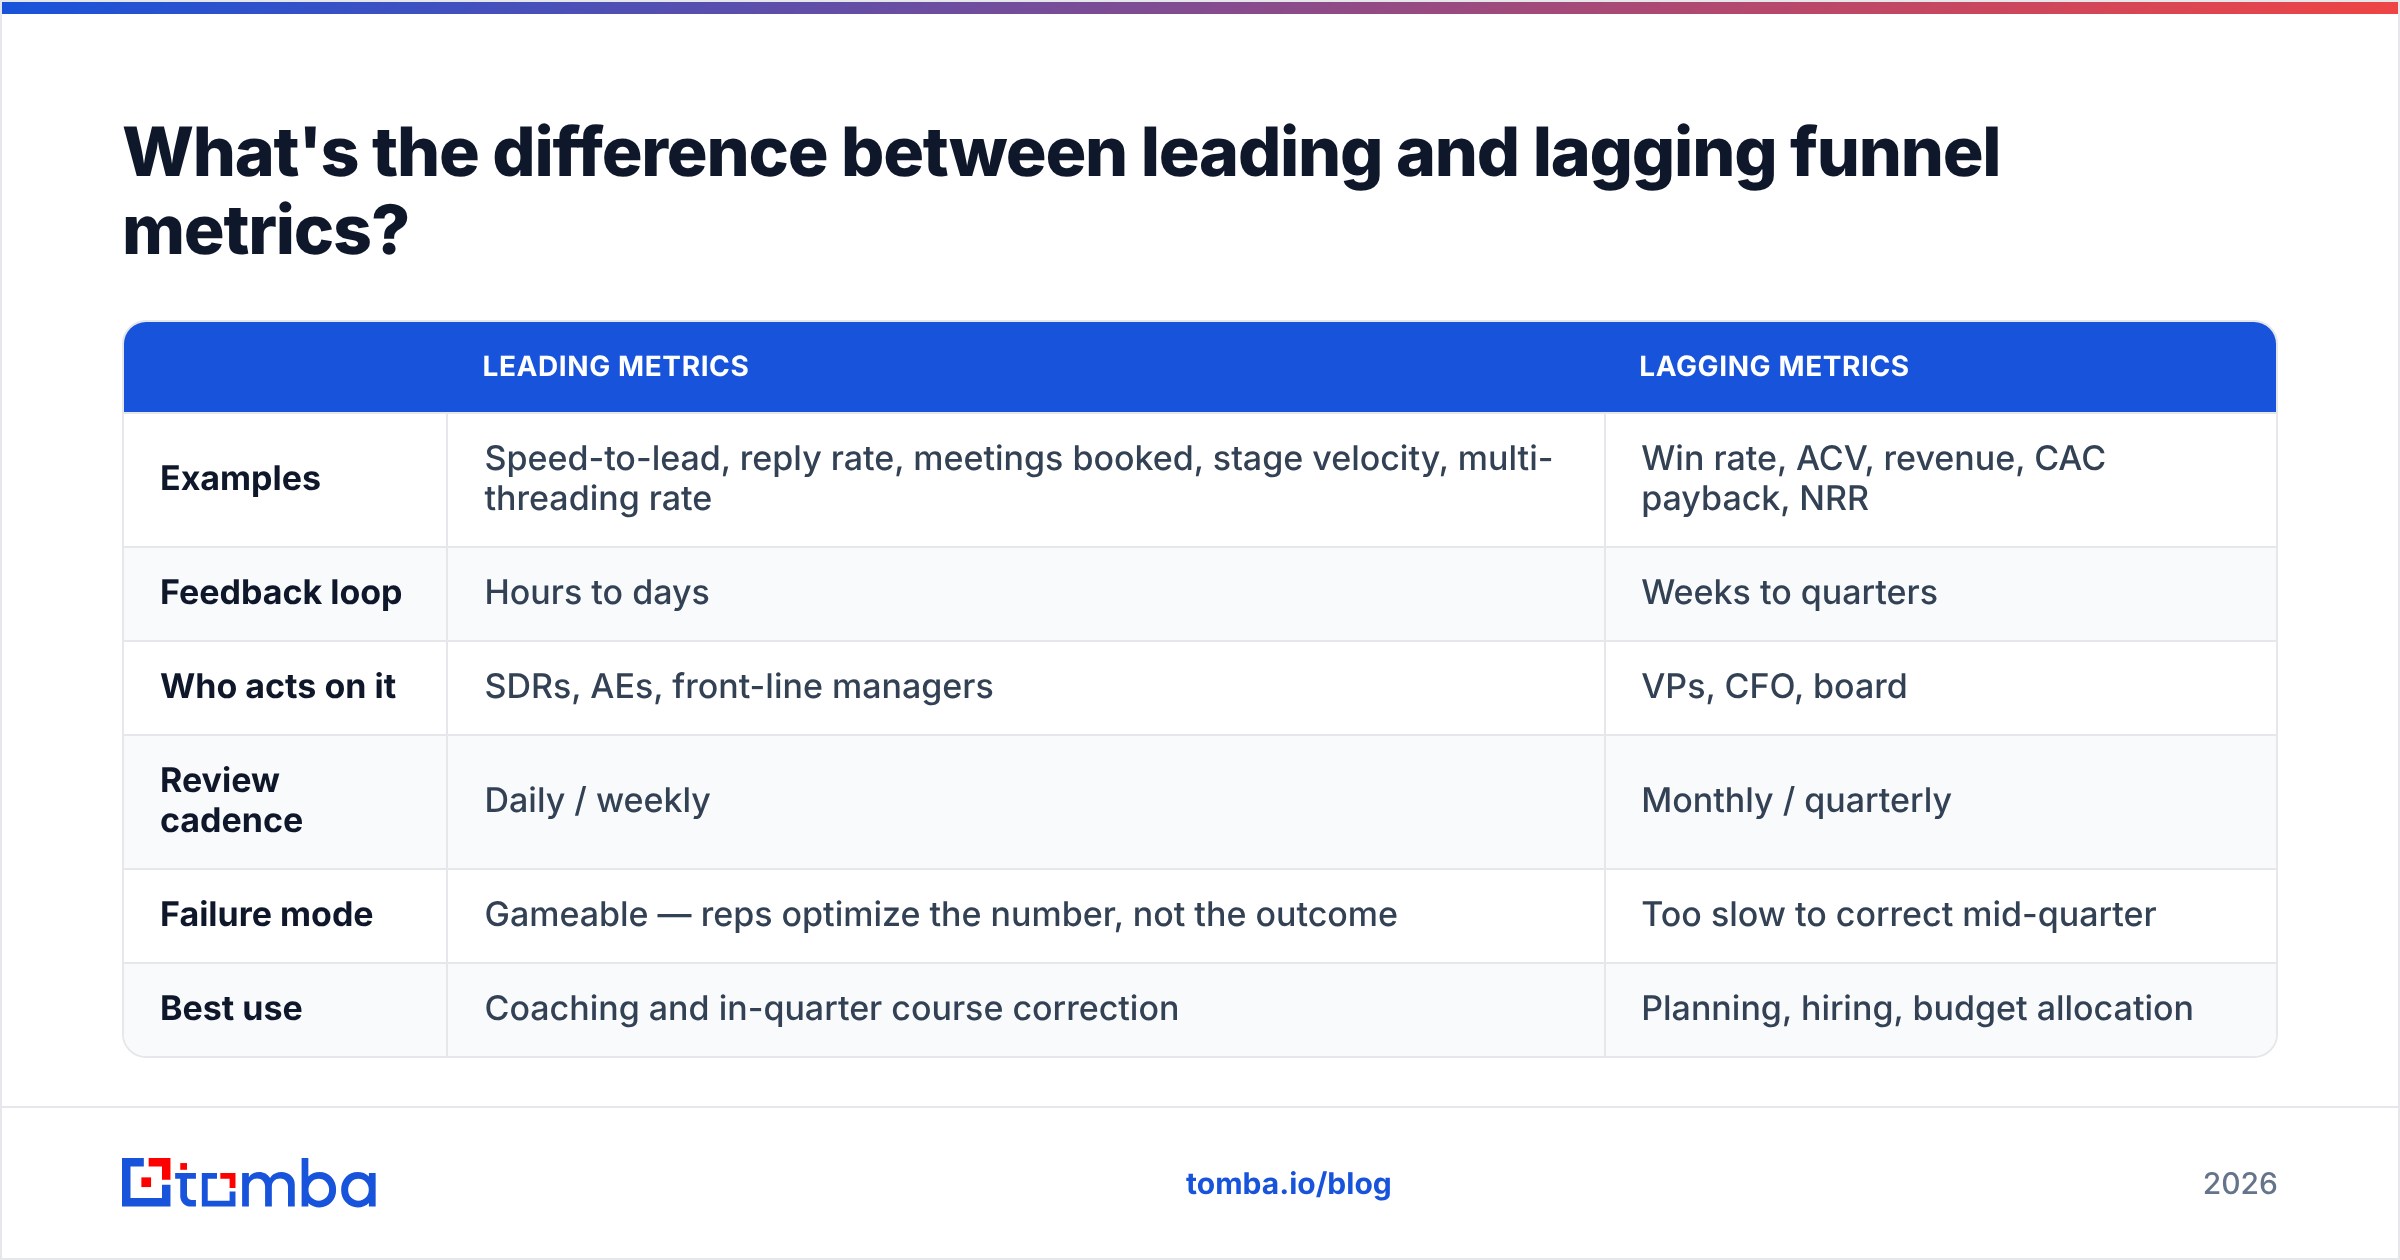
Lagging metrics tell you what happened. Leading metrics tell you what's about to. You need both, but you should manage on the leading ones — by the time a lagging metric moves, the quarter is already decided.
| Leading metrics | Lagging metrics | |
|---|---|---|
| Examples | Speed-to-lead, reply rate, meetings booked, stage velocity, multi-threading rate | Win rate, ACV, revenue, CAC payback, NRR |
| Feedback loop | Hours to days | Weeks to quarters |
| Who acts on it | SDRs, AEs, front-line managers | VPs, CFO, board |
| Review cadence | Daily / weekly | Monthly / quarterly |
| Failure mode | Gameable — reps optimize the number, not the outcome | Too slow to correct mid-quarter |
| Best use | Coaching and in-quarter course correction | Planning, hiring, budget allocation |
The gaming risk on leading metrics is real and predictable. Measure meetings booked and you'll get more no-shows. Measure meetings held and qualified and the incentive realigns. Whenever you introduce a leading metric, ask out loud: "How would a rational rep hit this number without doing the work?" Then close that path before you publish the dashboard.
What tooling do you actually need to instrument funnel metrics?#
Less than vendors want you to believe, and more discipline than most teams have.
The minimum viable stack is a CRM with enforced stage definitions, a data source that keeps contact records accurate, and one reporting layer everyone agrees is the source of truth. That's it. Attribution platforms, revenue intelligence tools, and conversation analytics are genuine upgrades — but they're upgrades to a functioning system, not substitutes for one. Buying a revenue intelligence platform to fix a funnel where nobody agrees what "Stage 3" means is an expensive way to get prettier wrong answers.
Three practical requirements:
- Stage definitions in writing, with exit criteria. "Stage 3 = economic buyer identified and confirmed budget cycle" is a definition. "Stage 3 = engaged" is a vibe.
- A single source of contact truth. If SDRs are pulling contacts from one place, marketing from another, and the CRM from a third, your funnel counts will never reconcile. A programmatic feed — through a Tomba API call or a native CRM integration — keeps one record canonical.
- Loss reasons as a required, picklist field. Free-text loss reasons produce 400 unique strings and zero insight. Eight picklist options produce a roadmap.
If you're evaluating vendors for any layer of this, category listings on G2 are a reasonable starting point for shortlists — just weight recent reviews from companies your size far more heavily than the aggregate score.
How often should you review funnel metrics?#
Match the cadence to the feedback loop, and keep the list short enough that people remember it without opening a dashboard.
- Daily: speed-to-lead and new opportunity creation. These are operational alarms, not analysis.
- Weekly: stage conversion by source, stage velocity, meetings held, pipeline coverage against the current quarter.
- Monthly: win rate by segment, ACV trend, loss-reason distribution, cohort conversion for the cohort that just matured.
- Quarterly: CAC payback, NRR, full-funnel cohort analysis, and — critically — a review of the metric definitions themselves.
That last one gets skipped and shouldn't. Definitions drift as products, segments, and teams change. A quarterly 30-minute review where RevOps, marketing, and sales re-ratify what each stage means is the cheapest accuracy improvement available to you.
One more discipline: cap the dashboard at five to seven numbers per audience. Front-line reps see leading metrics for their own book. Managers see team conversion and velocity. Executives see coverage, win rate, ACV, and payback. When everyone sees everything, nobody sees anything.
Start with clean inputs#
Funnel metrics are a measurement system, and every measurement system is limited by the quality of what goes into it. Cohort math, segmentation, and stage discipline all fall apart if the contact records feeding your top of funnel are stale, duplicated, or undeliverable.
That's the fixable part. Use the Tomba Email Finder to build prospect lists from verified, source-cited data, then run them through verification before a single sequence goes out — so your reply rate, conversion rate, and every number downstream describe reality instead of noise. The free tier includes 25 searches a month; paid plans start at $49/mo on Starter, with Growth at $99/mo for teams running higher volume. Full details are on the Tomba pricing page.
Fix the inputs first. Then your funnel metrics are worth arguing about.
Related guides#
Ready to find emails that actually work?
Join 150,000+ professionals who stopped guessing and started sending. Free credits on signup — no credit card required.
Get the Tomba newsletter
Practical outbound tactics and product updates — once every two weeks.
About the author