Geographic Sales Territories: How to Design Them in 2026
Geographic sales territories still beat account-based carving for most field and hybrid teams — but only when the balancing math is right. Here's how to design, size, and pressure-test them.

Geographic sales territories split a market by place, not by account type. One rep owns a set of ZIP codes, a metro, a state, or a whole region. The model is simple to run. It is also easy to get wrong, because equal land almost never means equal money. Here is how to design, size, and stress-test geographic sales territories in 2026.
TL;DR
- Geographic sales territories divide a market by physical lines — ZIP codes, metros, states, countries. One rep owns each block. It is the oldest territory model, and still the default in field sales.
- They win on travel time, local know-how, and clear ownership. They lose when your buyers are remote, or when your best-fit accounts cluster in a handful of metros.
- The failure mode is rarely the map. It is the balancing math. Reps get equal square miles instead of equal opportunity, and 20% of the team carries 60% of the pipeline.
- Balance on account potential and workload, not on reps per state. Rebalance once a year, move at most 20% of accounts per cycle, and pay a bridge on open pipeline.
- Geographic sales territories are only as good as the account data under them. Bad firmographics and missing contacts make pretty maps of nothing.
What are geographic sales territories?#
A geographic sales territory is one defined area: a set of ZIP codes, a metro, a state, or a multi-country region. One rep or one team owns every deal inside it. If the prospect headquarters sits inside the line, the account belongs to that rep. No debate. No round-robin. No routing rule with eleven conditions.
Think of postal routes. The post office does not sort mail by recipient type. It hands each carrier a set of streets, because walking the same blocks every day beats crossing town all morning. Geographic sales territories work the same way: cut travel, raise coverage density.
Put plainly, geography is the key you sort the market by. Other models sort by industry, by account size, by product line, or by a named list. Most mature teams use both. Geography is the base layer, and the biggest accounts get carved out on top. Field sales, logistics, restaurant tech, construction, and regional services still lean on the map first.
Why do teams still use geographic sales territories?#
Because the other models cost more to run, and only pay off at scale.
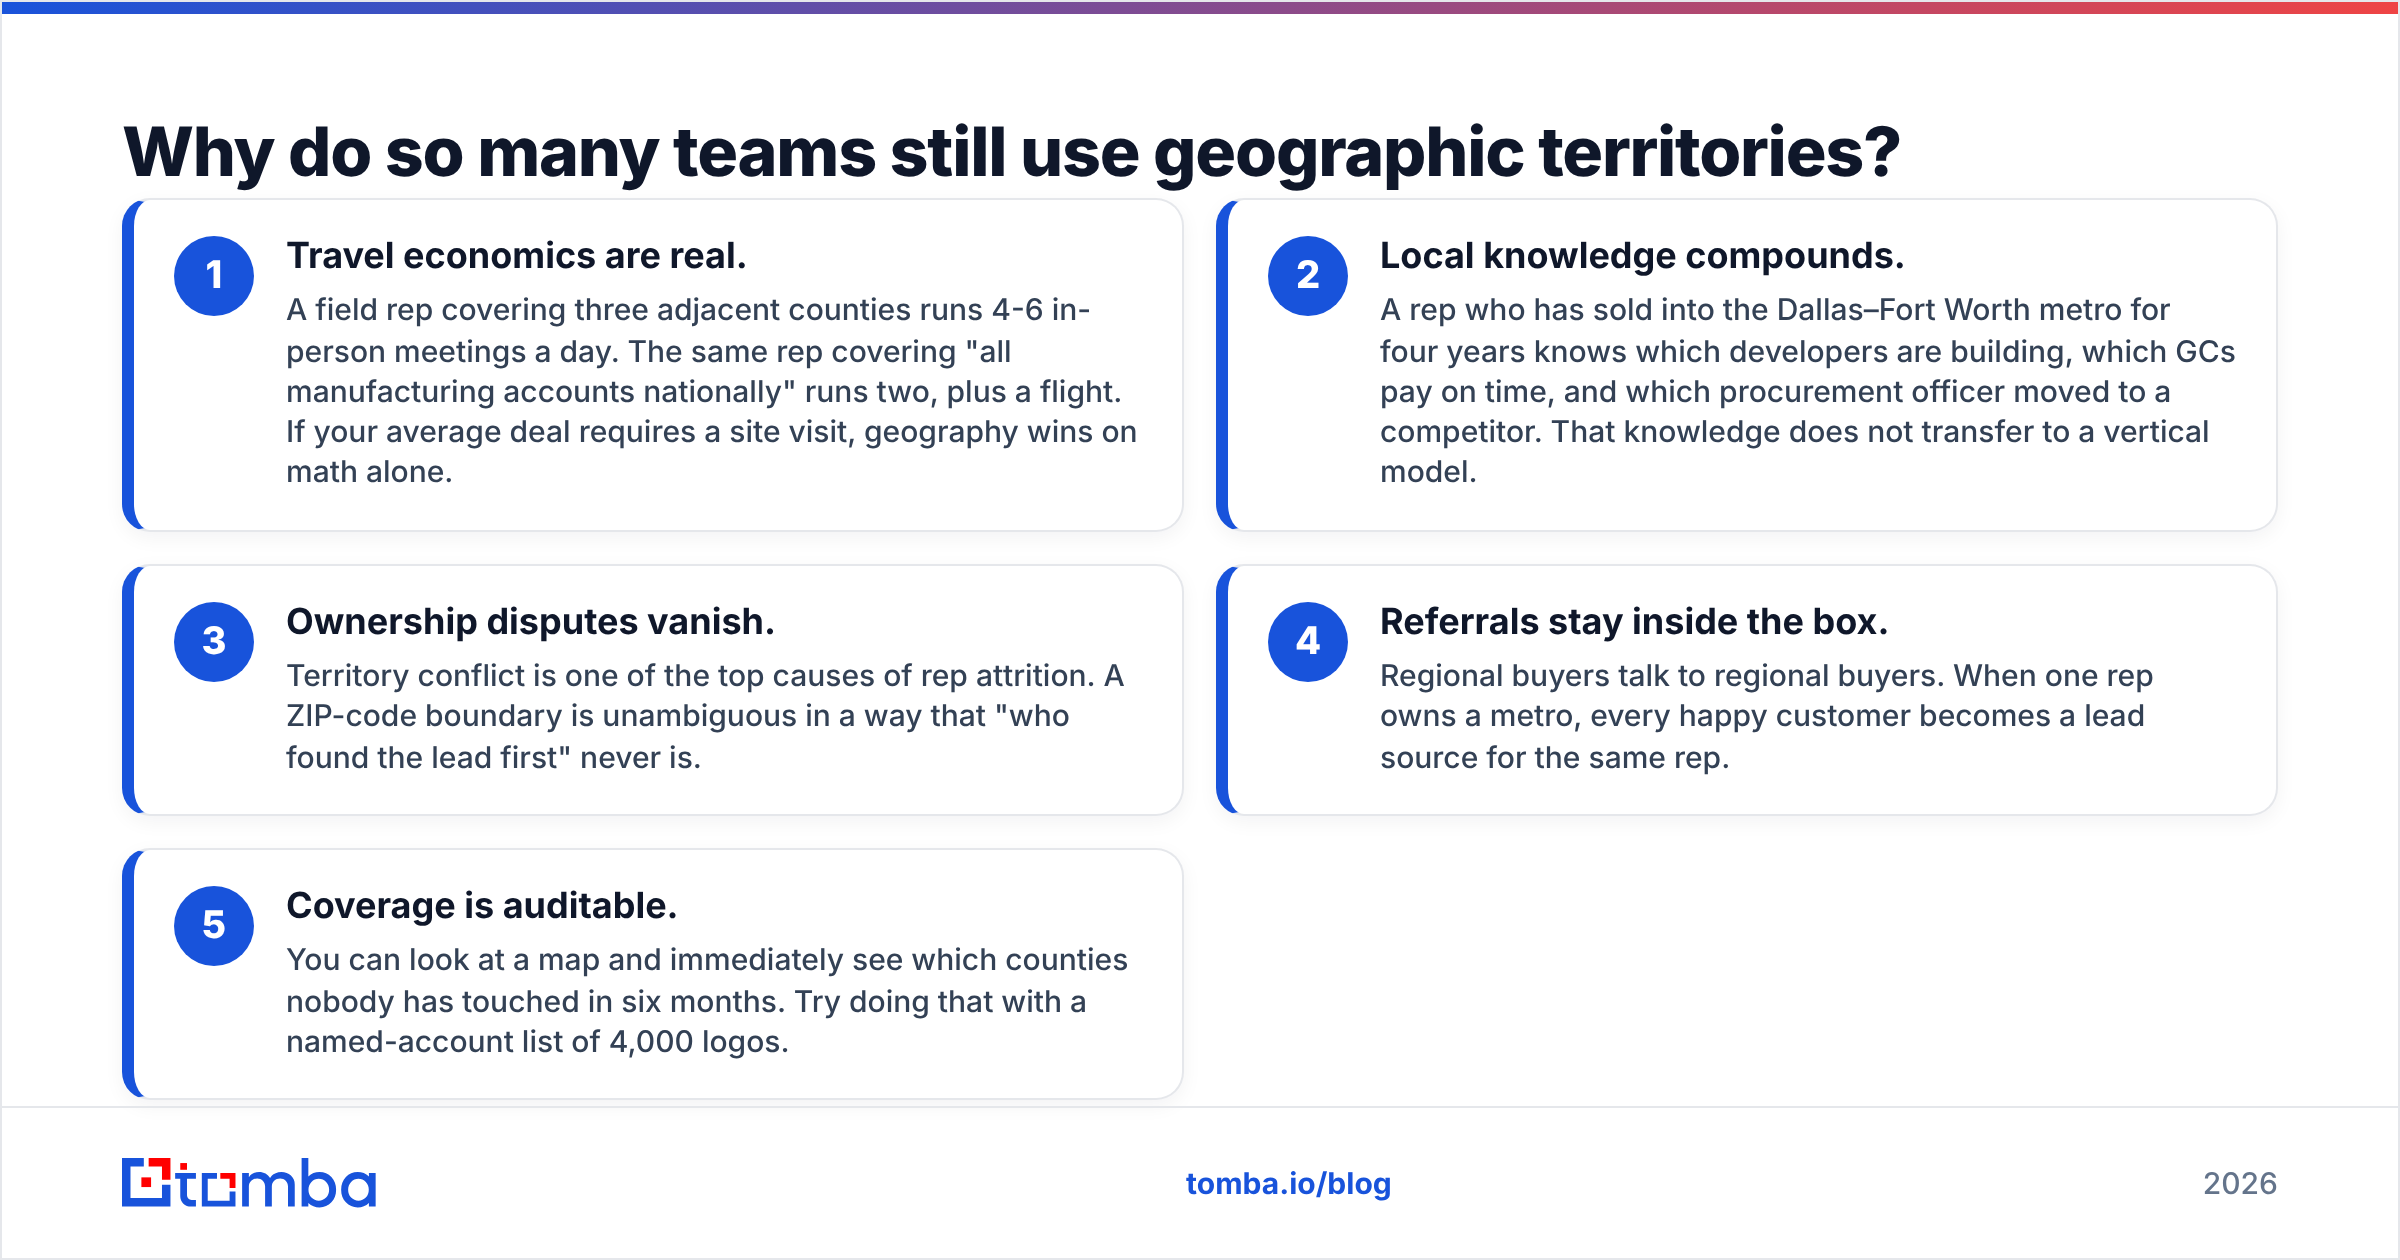
- Travel math is real. A field rep who covers three nearby counties can run 4-6 meetings a day. A rep who covers "all manufacturing, nationwide" runs two, plus a flight.
- Local knowledge stacks up. Four years in one metro teaches a rep who is building, who pays late, and who just moved to a competitor. A vertical model throws that away.
- Turf fights stop. A ZIP code line is clear. "Who found the lead first" never is.
- Referrals stay in the box. Local buyers talk to local buyers, so every happy customer feeds the same rep.
- Coverage is easy to audit. Look at the map and see which counties nobody has called in six months. Try that with a list of 4,000 logos.
How do geographic territories compare to other territory models?#
Here is the honest side-by-side. No model wins everywhere. The right one depends on where your buyers sit and how tightly your best-fit accounts cluster.
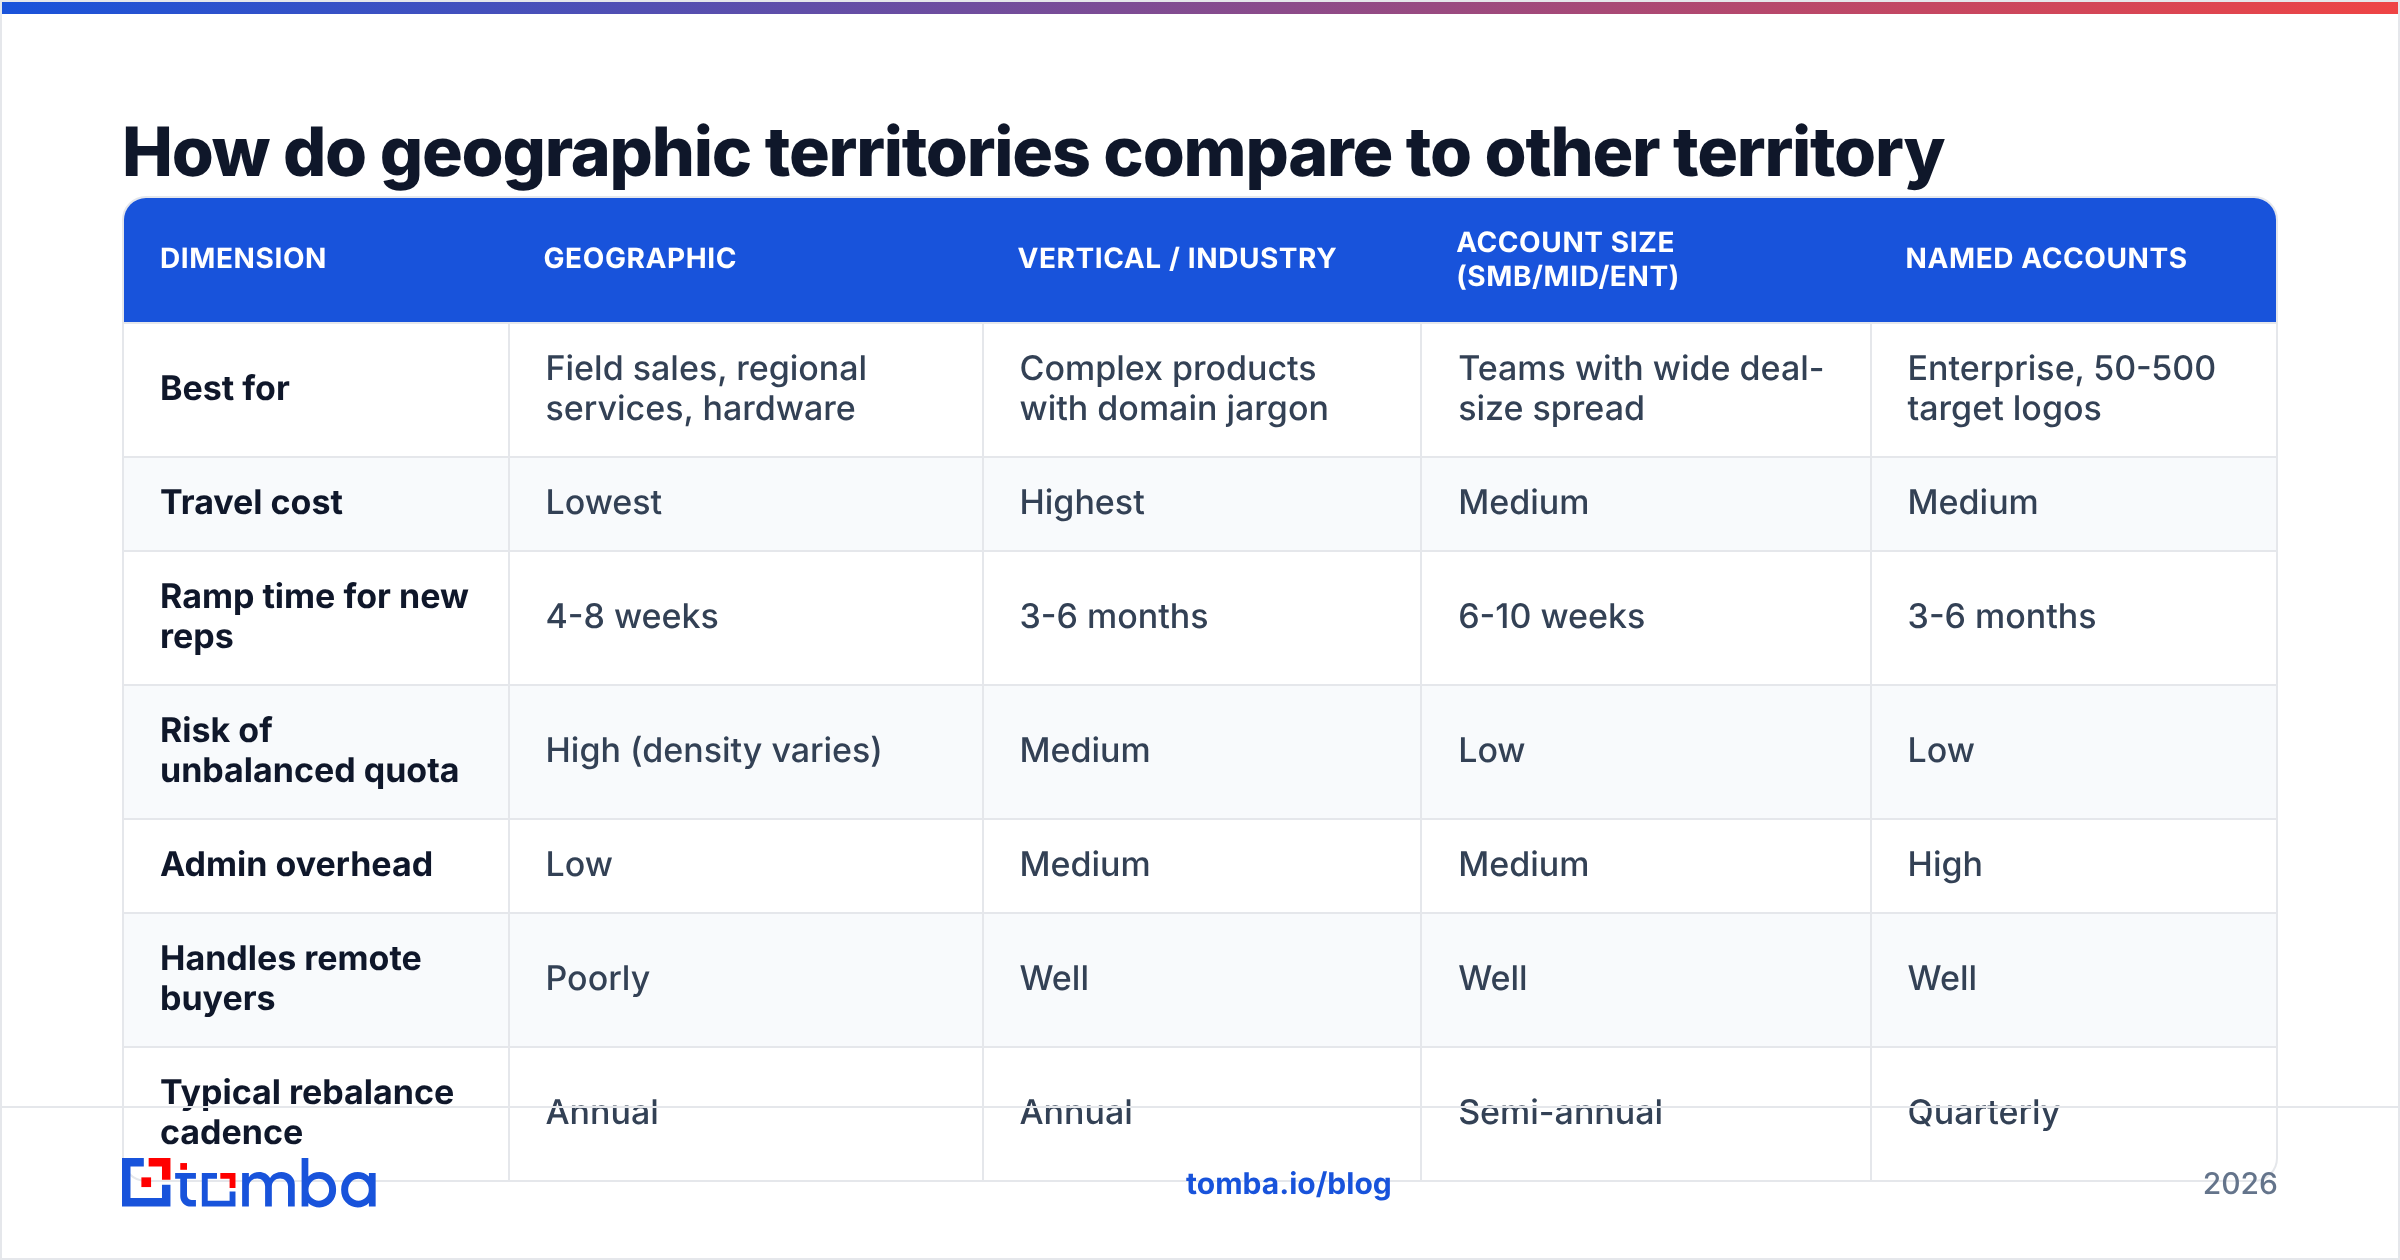
| Dimension | Geographic | Vertical / Industry | Account Size (SMB/Mid/Ent) | Named Accounts |
|---|---|---|---|---|
| Best for | Field sales, regional services, hardware | Complex products with domain jargon | Teams with wide deal-size spread | Enterprise, 50-500 target logos |
| Travel cost | Lowest | Highest | Medium | Medium |
| Ramp time for new reps | 4-8 weeks | 3-6 months | 6-10 weeks | 3-6 months |
| Risk of unbalanced quota | High (density varies) | Medium | Low | Low |
| Admin overhead | Low | Medium | Medium | High |
| Handles remote buyers | Poorly | Well | Well | Well |
| Typical rebalance cadence | Annual | Annual | Semi-annual | Quarterly |
| Data requirement | HQ location + firmographics | SIC/NAICS + tech stack | Revenue + headcount | Full account intelligence |
The pattern in that table is easy to miss. Geographic sales territories are the cheapest to run and the hardest to keep fair. Every other model trades admin cost for balance.
How do you balance geographic sales territories?#
Stop counting square miles. Start counting opportunity.
Every serious revenue operations team lands on the same method. Score each unit of the map on three variables. Then cluster the units until every rep sits inside a tolerance band.
Step 1 — Pick the smallest unit. ZIP code in the US. Postal sector in the UK. Commune in France. County works too. Smaller units give you finer balance, but more clustering work.
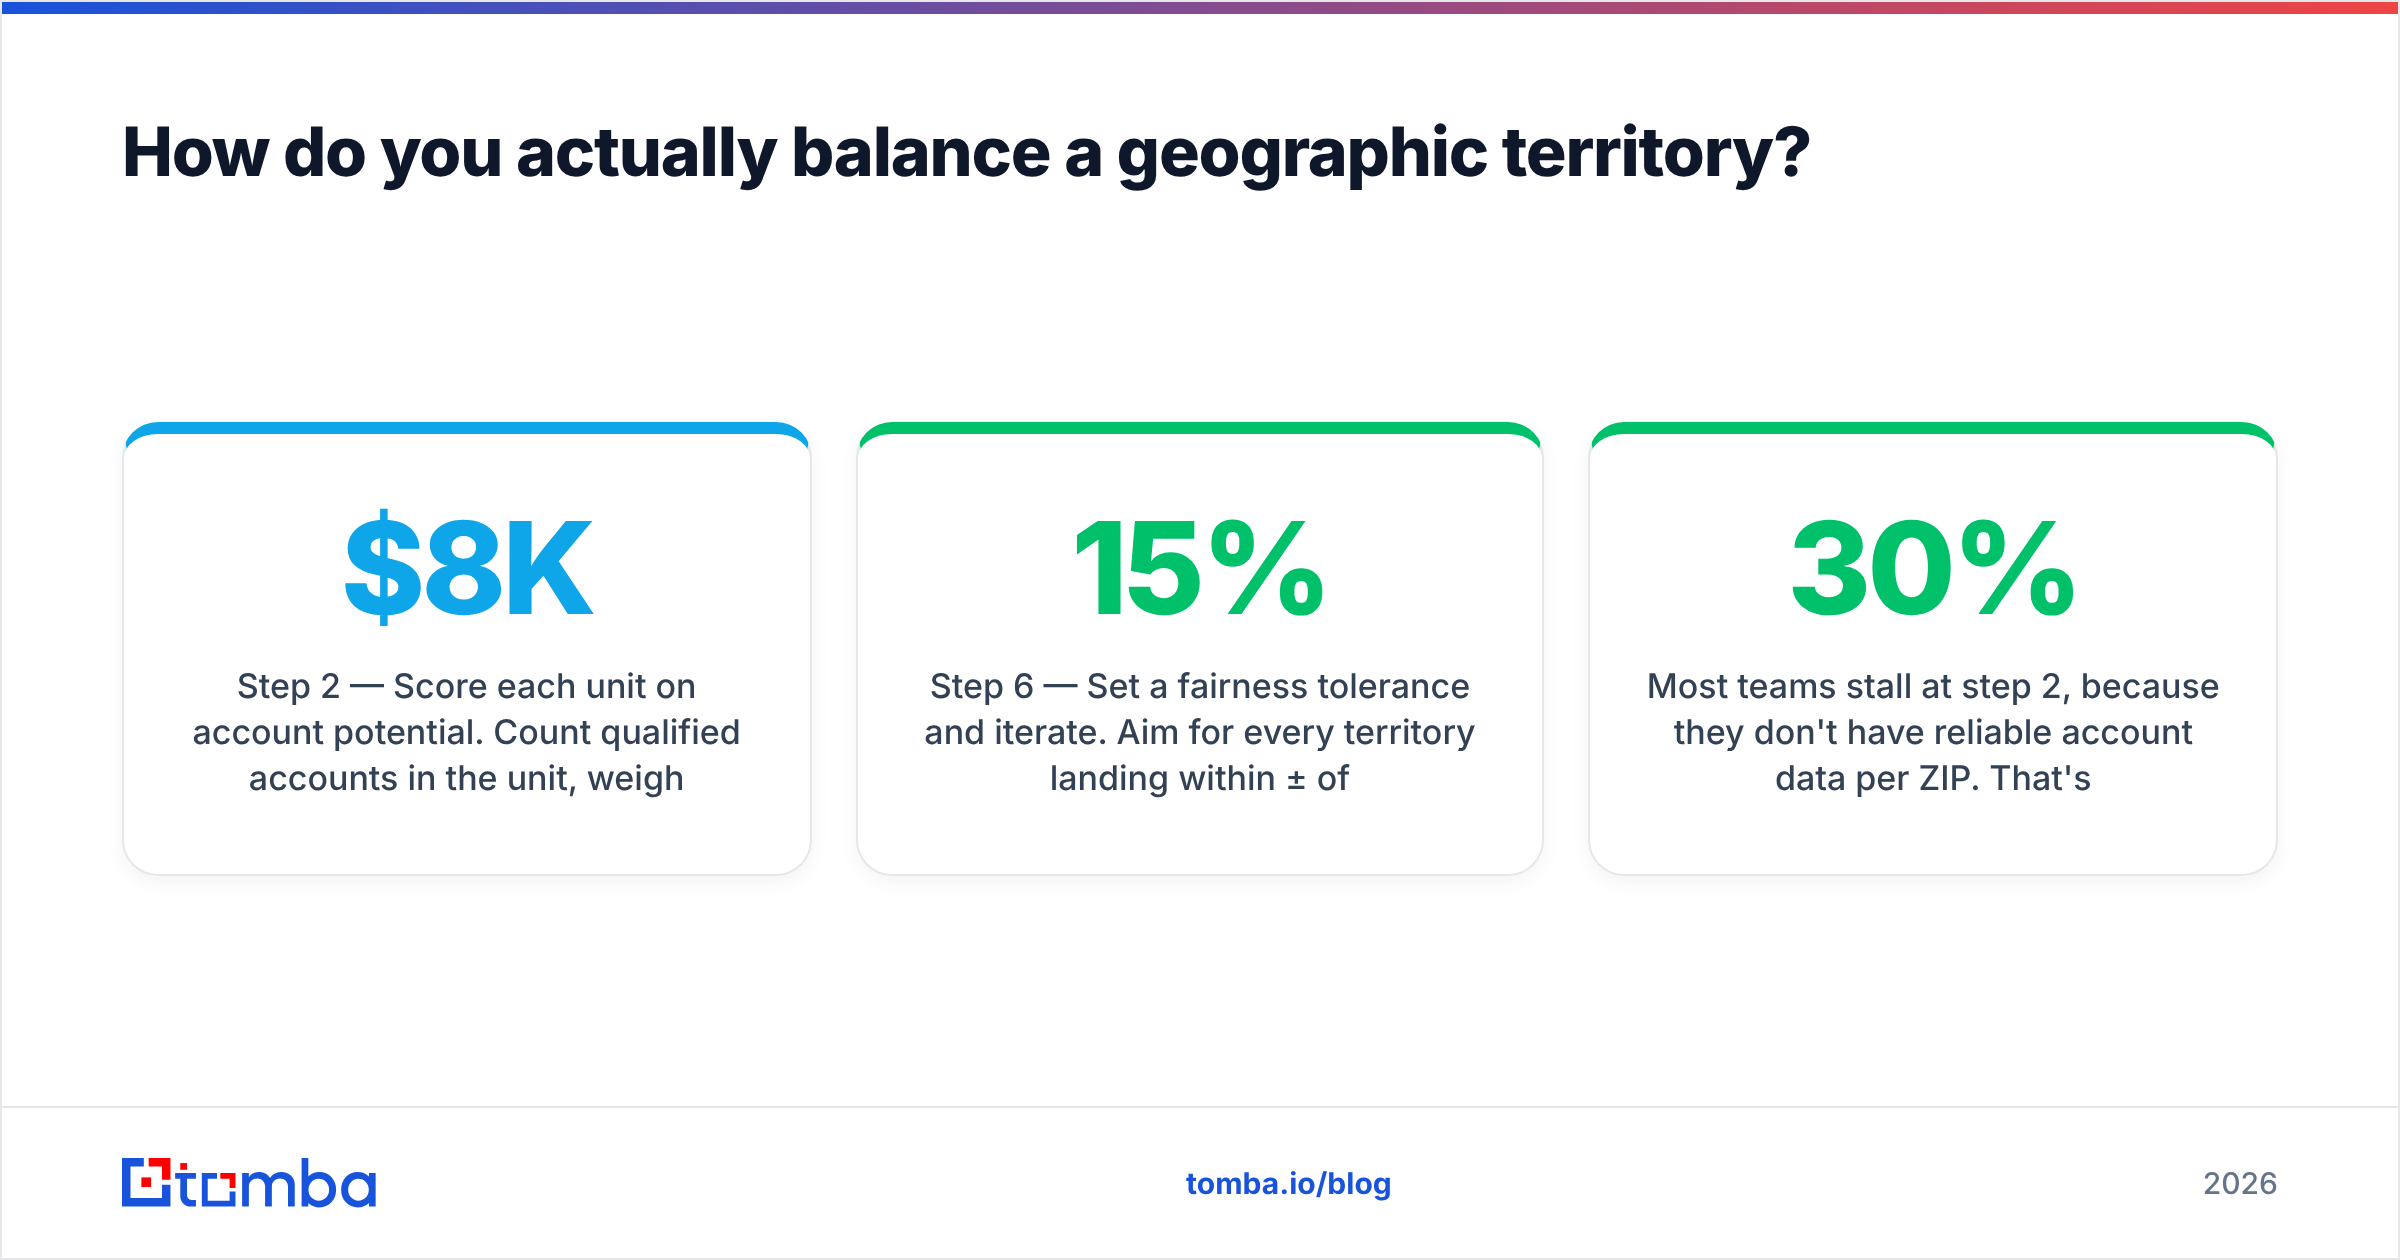
Step 2 — Score each unit on account potential. Count the qualified accounts, then weight them by likely deal size. A ZIP with 40 accounts worth $8K each beats one with 200 accounts worth $900.
Step 3 — Score each unit on workload. Current customers eat service hours. A unit with 60 live accounts carries real load even if new business is thin. Potential and workload are two different numbers. Track both.
Step 4 — Score drive time, not distance. Fifteen miles in Manhattan takes 50 minutes. Fifteen miles in rural Nebraska takes 14. Use routing data, not straight-line distance.
Step 5 — Keep each territory in one piece. Territories should touch. A rep whose patch is "Portland plus three ZIPs in Boise" will hate you.
Step 6 — Set a fairness band, then iterate. Aim for every territory within ±15% of the mean on potential and workload. If you cannot get under ±25%, your rep count is wrong. Add or remove a rep.
Most teams stall at step 2. They do not have clean account data per ZIP. That is a data problem dressed up as a planning problem. Before you model anything, run a domain search across the target list. Confirm which companies are real and reachable. Then enrich the rest with headcount, tech stack, and contact coverage. Geographic sales territories built on a list where a third of the accounts have no findable buyer will miss quota.
What breaks geographic sales territories?#
Four things, in the order they usually show up.
Uneven buyer density. Say your buyer is a manufacturing plant with 200 or more staff. Those plants are not spread evenly. The Midwest is packed. The Mountain West is empty. Equal-size areas then produce wildly unequal quotas. The fix: unequal areas, equal potential.
Remote buying committees. Plenty of B2B deals now close without anyone flying anywhere. The VP of Ops lives in Denver. The CFO who signs lives in Miami. In that case, HQ ZIP code is a fiction. The fix: a hybrid model. Keep geography for field motion, and use named accounts for spread-out committees.
Territory hoarding. A rep who inherits a hot metro can sit on it for six years and coast. Meanwhile your best closer is stuck in a dead region, and then quits. The fix: real annual rebalancing, plus a written process for reassigning an underworked patch.
Rebalance shock. Harvard Business Review research on territory design reports that clumsy territory changes can drag performance for two or three quarters. Reps lose relationships mid-deal and stop trusting the plan. The fix: cap account moves at about 20% per cycle, pay a bridge on open pipeline, and explain the model, not just the outcome.

How many territories should you have?#
Work backwards from capacity, not from the map.
Most planning teams use one formula:
Required territories = (Total serviceable accounts × Annual touches per account) ÷ (Selling days per rep × Touches per day)
Run it with real numbers. Say you have 4,200 serviceable accounts. Each one needs 6 real touches a year. A rep works 220 selling days and makes 8 touches a day.
(4,200 × 6) ÷ (220 × 8) = 25,200 ÷ 1,760 = 14.3 territories
Round to 15. Now check from the other side. Does 15 give each rep a quota they can hit with the potential in their cluster? If the market is worth $30M and quota is $2.5M per rep, 15 reps have to win 125% of the market. The plan is broken before anyone picks up a phone.
Two constraints, one answer. When capacity math and potential math disagree, potential math wins.
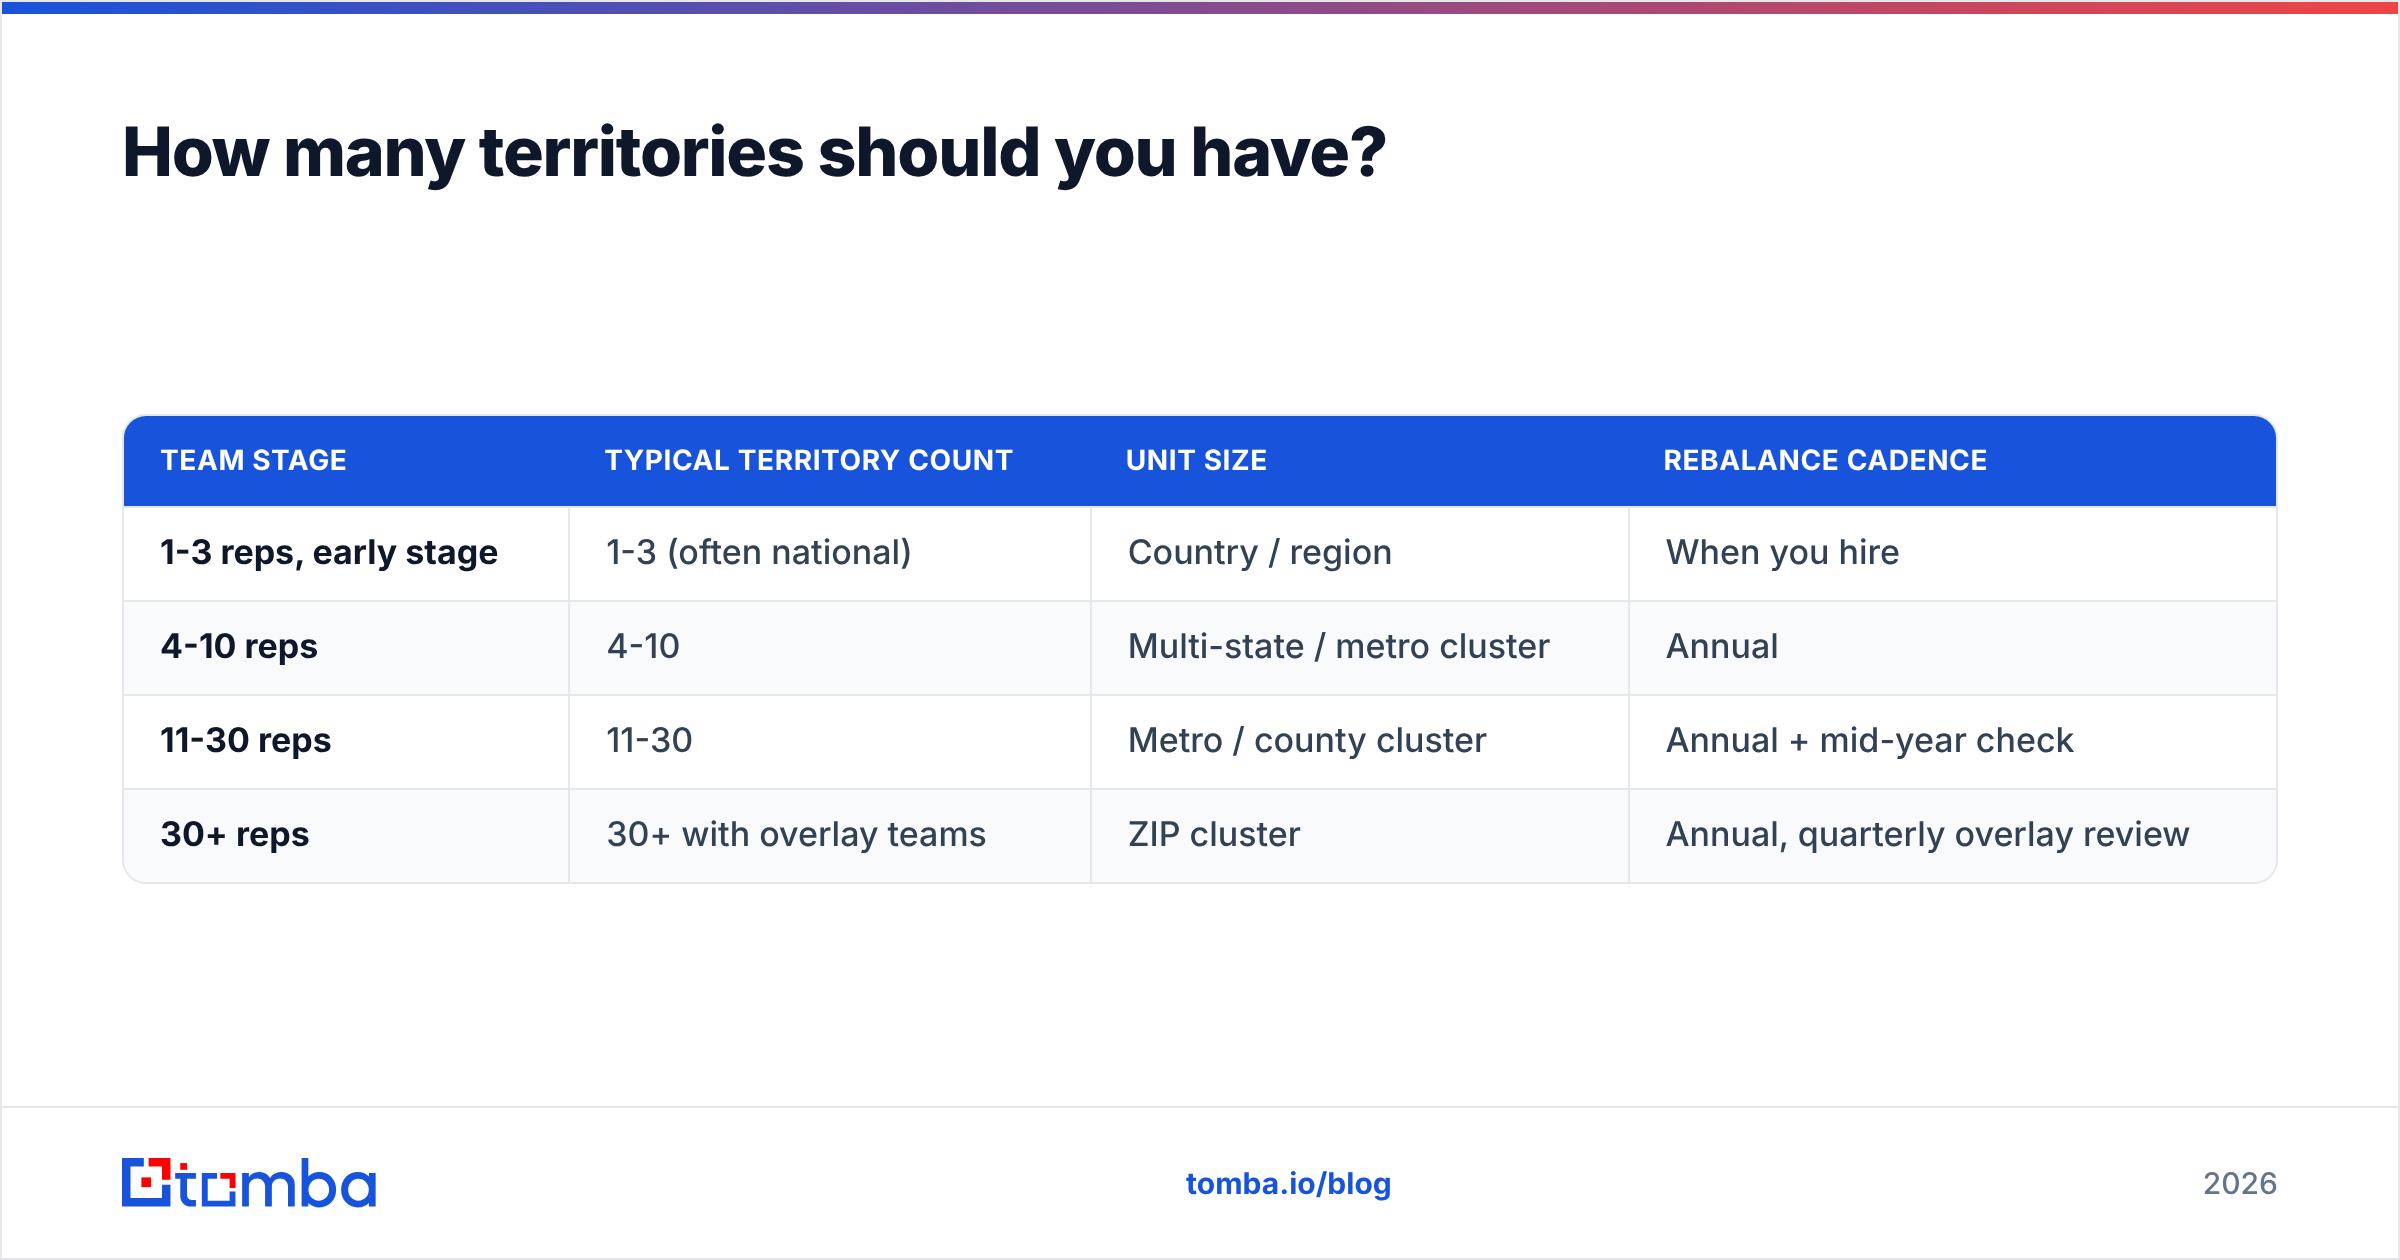
| Team stage | Typical territory count | Unit size | Rebalance cadence |
|---|---|---|---|
| 1-3 reps, early stage | 1-3 (often national) | Country / region | When you hire |
| 4-10 reps | 4-10 | Multi-state / metro cluster | Annual |
| 11-30 reps | 11-30 | Metro / county cluster | Annual + mid-year check |
| 30+ reps | 30+ with overlay teams | ZIP cluster | Annual, quarterly overlay review |
What data do you need before you draw a single line?#
Territory design is a data job in a mapping costume. You need four fields per account.
- Verified HQ location — not the billing address, and not the parent company address. The place where the buying decision happens.
- Firmographics — headcount, revenue band, industry code. This turns a dot on a map into a scored opportunity.
- Contact coverage — how many reachable decision-makers you have. An account with no findable contact adds nothing to territory potential, however big it looks.
- Current relationship — customer, churned, open opp, or cold. This drives the workload score.
The third one is where most geographic sales territories quietly fail. Teams pull a list, assume every logo is workable, and build quotas on top. Then reps find that a third of their accounts have no reachable buyer.
Close that gap before planning, not after. Run the account list through an email finder to see real contact coverage per account. Then push the results through an email verifier, so the number reflects contacts that actually deliver. A ZIP that looks like 80 accounts but yields 22 reachable buying committees should be scored as 22. Buying a list does not change this. BookYourData is a solid source for pre-verified B2B records in some regions, and even then you verify before you commit the list to a map.
For ongoing coverage, wire enrichment into your CRM. A one-off spreadsheet goes stale fast. Tomba's HubSpot integration and the Tomba API both enrich accounts on a schedule, so the scores behind your map stay current between planning cycles.
Should you use a hybrid territory model instead?#
Probably, once you pass 15 reps.
The common setup in 2026 looks like this:
- Geographic base layer — the whole market is carved into connected regions. Every account has a default owner. No gaps.
- Named-account overlay — the top 50 to 200 logos are pulled out and given to strategic AEs, wherever they sit.
- Vertical specialists as support — a healthcare expert helps any rep selling into healthcare but owns no accounts. They carry an overlay quota.
- Inside sales takes the long tail — small accounts route to a central team. Field reps keep the accounts worth a drive.
That structure keeps the clarity of geographic sales territories and fixes their two worst flaws: spread-out enterprise buyers and low-value account drag. G2's sales territory mapping category lists a dozen tools that model these overlays once spreadsheets stop coping.
The cost is admin. Every overlay is a routing rule, a comp exception, and a possible fight. Add one layer at a time, and only when a real problem forces it.
How do you roll out a territory change without wrecking Q1?#
Sequence matters more than the design.
Eight weeks out: finalize the model. Walk two senior reps through it in private. They will catch local facts your data missed, like the account that is really run out of a satellite office.
Six weeks out: model the comp impact per rep. Anyone losing more than 20% of their potential needs a written plan before they hear the news.
Four weeks out: announce the model and the reasoning. Show the balancing math. Reps accept a bad outcome from a clear process far more easily than a good outcome from a black box.
Two weeks out: run the handoffs. Do joint calls on every open deal above a set size. The outgoing rep stays on until close and takes a split.
Go-live: freeze the map for two full quarters. Mid-quarter tweaks kill trust faster than one bad assignment.
Track win rate by territory for the two quarters after go-live. If one territory's win rate falls while activity holds steady, the potential score was wrong. The rep was not.
What should you do next?#
Answer one question before you touch a map. How many of your target accounts have a verified, reachable decision-maker? If the answer is under 70%, territory design is not your bottleneck. Contact coverage is.
Start there. Use the Tomba Email Finder to build real contact coverage across your target list by domain and role. Then the score behind every ZIP cluster reflects buyers you can reach, not logos in a database. The free tier gives you 25 searches a month to test one region, and Starter runs $49/mo when you are ready to score the whole map. Build geographic sales territories on data you have verified, and the balancing math finally means something.
Related guides#
Ready to find emails that actually work?
Join 150,000+ professionals who stopped guessing and started sending. Free credits on signup — no credit card required.
Get the Tomba newsletter
Practical outbound tactics and product updates — once every two weeks.
About the author