Go To Market Pitch Deck: The 2026 Structure That Closes
A go to market pitch deck has to survive two audiences: investors who fund the plan and reps who execute it. Here is the 12-slide structure, the data behind it, and the mistakes that kill deals.

TL;DR
- A go to market pitch deck is not a product deck with a sales slide bolted on. It answers one question: who buys this, how do you reach them, and what does each unit of reach cost?
- The 12-slide structure below works for both fundraising and internal GTM approval. Fundraising versions lead with market; internal versions lead with the motion.
- The slide that kills most decks is the motion slide — teams describe channels ("outbound, content, partnerships") instead of proving one channel with reachable-contact math.
- Bottom-up TAM beats top-down TAM in every room that matters. Count the actual accounts and the actual contacts you can email, not a Gartner headline number.
- Build the contact math before you build the deck. If you cannot name 3,000 reachable buyers, your GTM slide is a hypothesis, not a plan.
What is a go to market pitch deck?#
A go to market pitch deck is the 10-15 slide document that explains how a company converts a defined market into revenue. It sits between the product deck (what we built) and the financial model (what it earns). Its job is to make the path from stranger to customer legible enough that a stranger — an investor, a board member, a new VP of Sales — can stress-test it.
Think of it like a restaurant's opening plan. The menu is the product. The P&L is the model. The GTM deck is the part that says: this neighborhood, these 4,000 households, this delivery radius, this much per flyer, this many covers per night by month six. Nobody funds a menu.
Two versions of this deck exist and people constantly confuse them:
- The investor GTM deck — a section inside a seed or Series A raise, usually 4-6 slides. Optimized for market size credibility and channel efficiency.
- The internal GTM plan deck — 15-25 slides presented to a leadership team before a launch. Optimized for sequencing, ownership, and quota math.
- The partner or channel deck — used to recruit resellers and agencies. Optimized for margin and co-selling mechanics.
- The board update GTM slide — 1-2 slides showing pipeline coverage against the plan you already sold them.
This guide covers the first two, because they share a spine. If you get the spine right, the other variants are edits, not rewrites.
Why do most GTM decks fail on the second slide?#
Because they start with a market number nobody believes.
"The global sales enablement market will reach $12.5B by 2030" tells a reader nothing about your business. Every competitor in your category quotes a similar number from a similar report. Sophisticated readers — Forrester and Gartner analysts included — treat top-down TAM as decoration.
What survives scrutiny is bottom-up: the number of accounts that match your ICP, multiplied by the contacts per account you can actually reach, multiplied by realistic conversion and ACV. That math is auditable. Someone can check it.
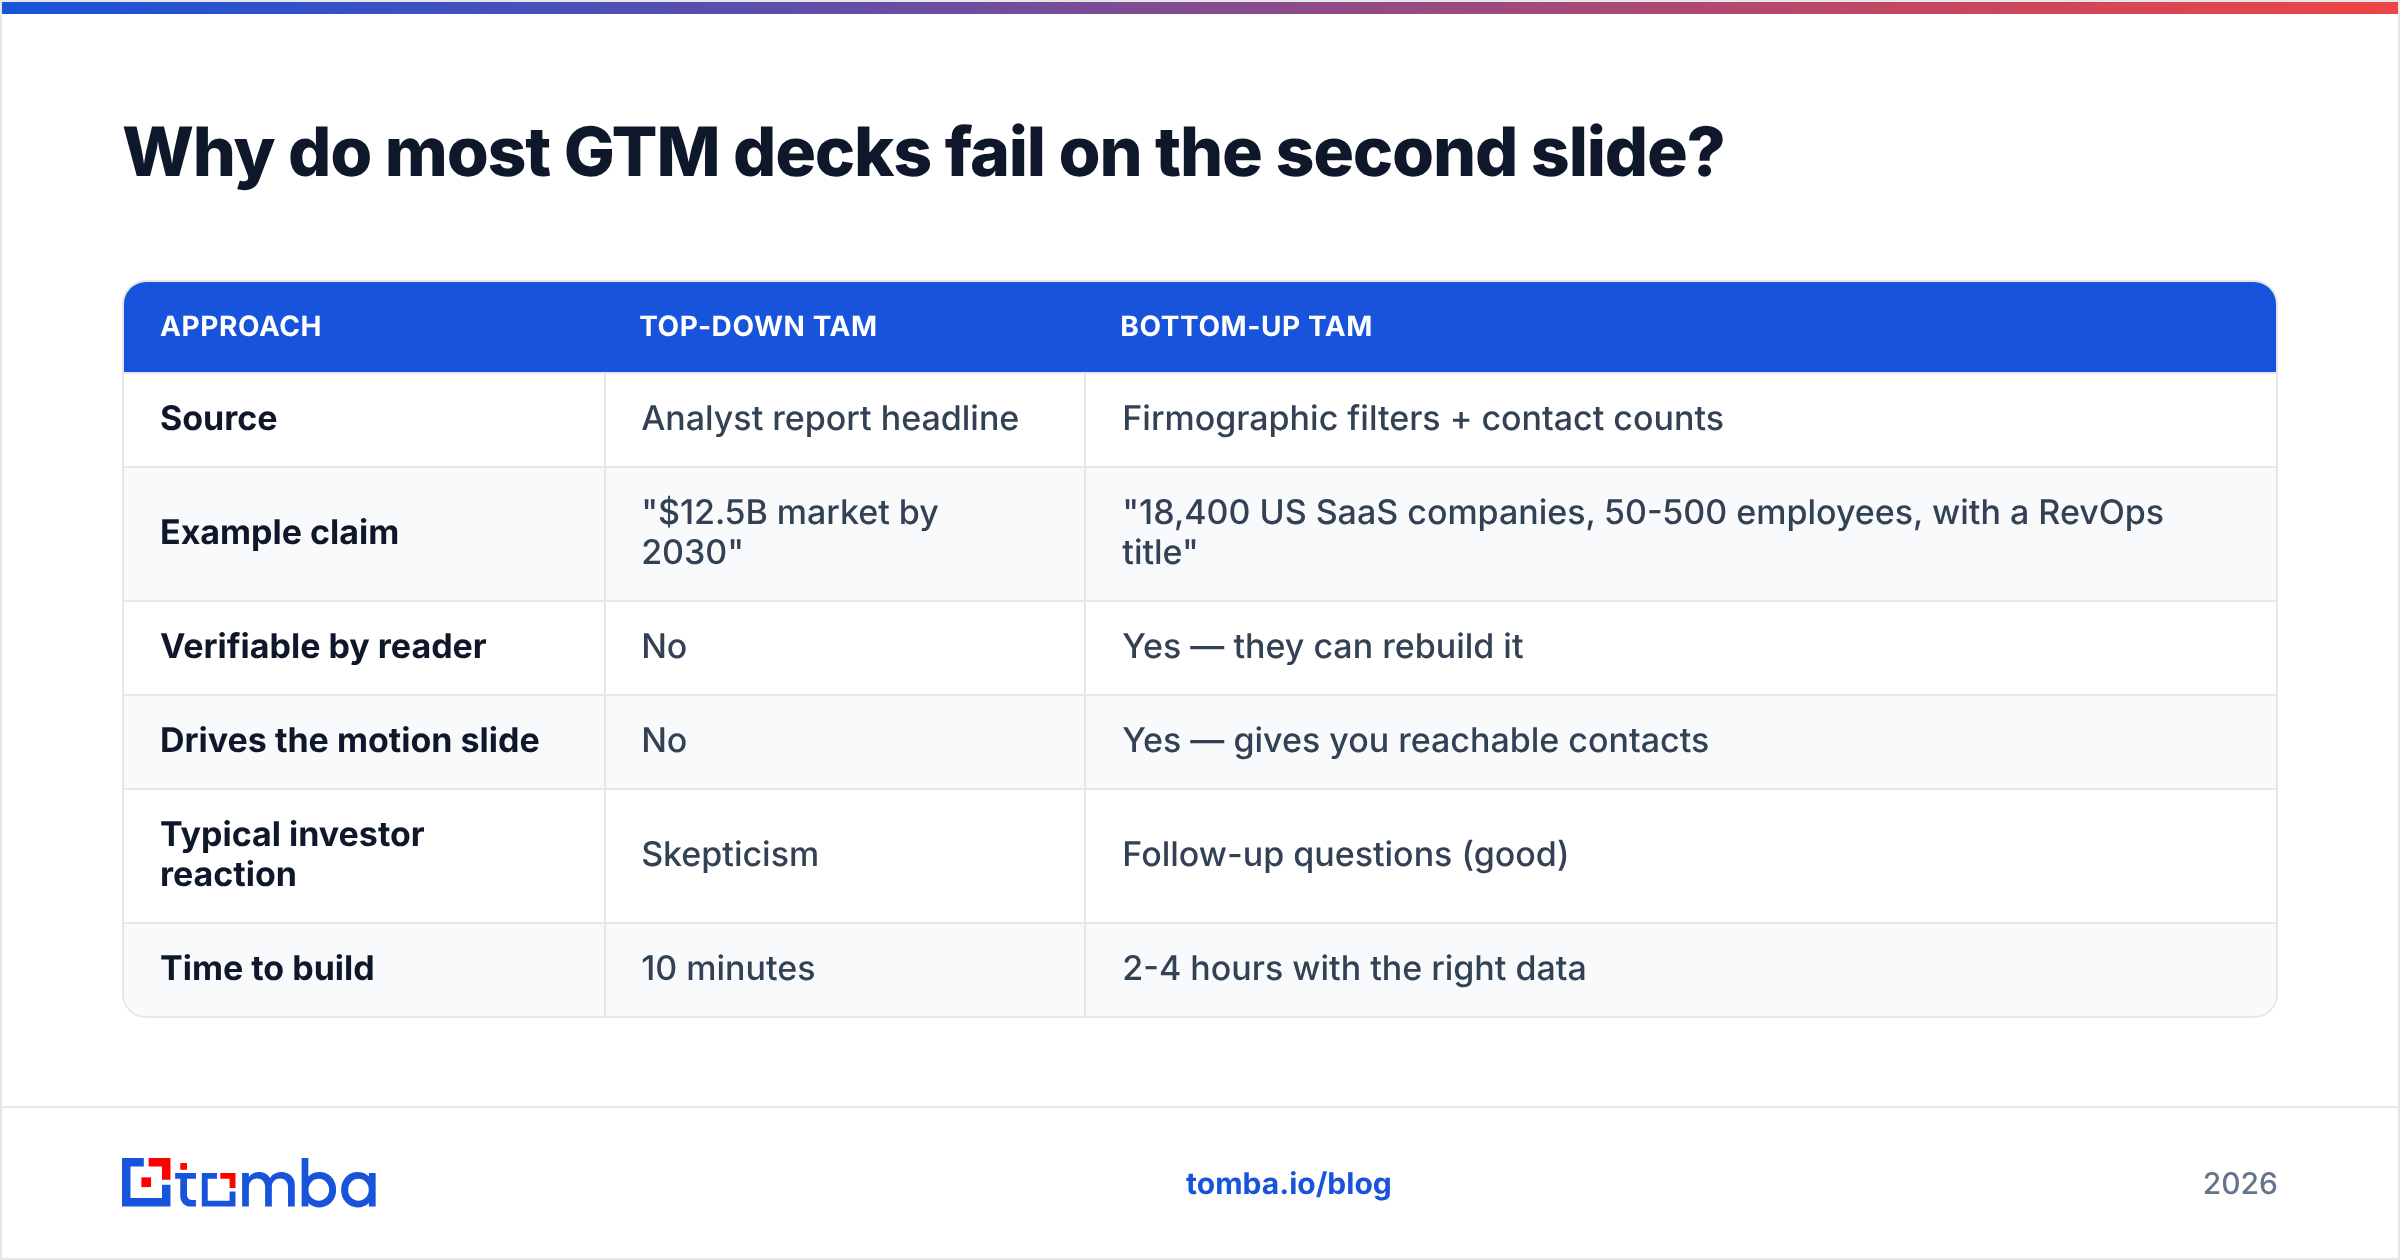
Here is the difference in practice:
| Approach | Top-down TAM | Bottom-up TAM |
|---|---|---|
| Source | Analyst report headline | Firmographic filters + contact counts |
| Example claim | "$12.5B market by 2030" | "18,400 US SaaS companies, 50-500 employees, with a RevOps title" |
| Verifiable by reader | No | Yes — they can rebuild it |
| Drives the motion slide | No | Yes — gives you reachable contacts |
| Typical investor reaction | Skepticism | Follow-up questions (good) |
| Time to build | 10 minutes | 2-4 hours with the right data |
The bottom-up version costs you an afternoon and buys you the rest of the meeting. Pull your account list from a B2B database, filter to your ICP firmographics, then count the contacts per account you can actually reach. That contact count is the real ceiling on your outbound plan — not the analyst's $12.5B.

What are the 12 slides a go to market pitch deck needs?#
This is the working structure. Cut ruthlessly for investor versions; expand slides 7-11 for internal versions.
- The wedge — the one specific buyer with the one specific pain, named. Not "sales teams." Try "RevOps leads at 80-400 person SaaS companies running HubSpot who lose 30% of inbound leads to bad routing."
- Why now — the market shift that makes this urgent in 2026. Regulation, platform change, price collapse, buyer behavior shift. One shift, evidenced.
- Bottom-up market sizing — accounts, contacts per account, ACV, and the arithmetic shown on the slide.
- ICP definition — firmographic filters, technographic signals, and disqualifiers. The disqualifiers matter more than people expect; they prove you have talked to enough prospects to know who wastes your time.
- The buying committee — economic buyer, champion, blocker, end user. Who signs, who sabotages.
- Primary motion — one channel, proven. Not a list.
- The funnel math — contacts → replies → meetings → opportunities → closed won, with your current conversion rates or clearly labeled assumptions.
- CAC and payback — fully loaded, including tooling and SDR salary, not just ad spend.
- Competitive positioning — where you win, where you lose, and the honest displacement story.
- The 90-day sequence — what ships week 1, week 4, week 12. Named owners.
- Team and capacity — reps, ramp time, quota, coverage ratio.
- The ask — money, headcount, or approval. One number.
Slides 6 and 7 carry the deck. Everything else is context for them.
How do you build the motion slide so it survives questions?#
Prove one channel end to end instead of listing five.
The failure pattern is a slide reading "Outbound + Content + Partnerships + PLG + Events." That slide says you have not committed. Committed looks like this: "Outbound to RevOps leads at HubSpot-using SaaS companies. 18,400 accounts identified. 41,000 verified contacts. 2,000 sends/month at 8% reply, 2.1% meeting rate = 42 meetings/month at current rates."
Those numbers are checkable, which is the point. To make them checkable you need three things:
- A real account list. Firmographic filters applied to a database, exported, deduplicated. Not a guess.
- Verified contacts per account. Run the list through an email verifier before you cite a contact count. A list of 41,000 addresses with a 22% bounce rate is a list of 32,000 addresses, and quoting the wrong one in a board meeting is how forecasts die.
- Observed conversion rates, or clearly labeled benchmarks. If you have sent 500 emails, cite your own numbers. If you have sent zero, say "benchmark" on the slide and cite the source.
The credibility differential between a deck with real contact counts and a deck without is enormous. One invites diligence. The other invites doubt.
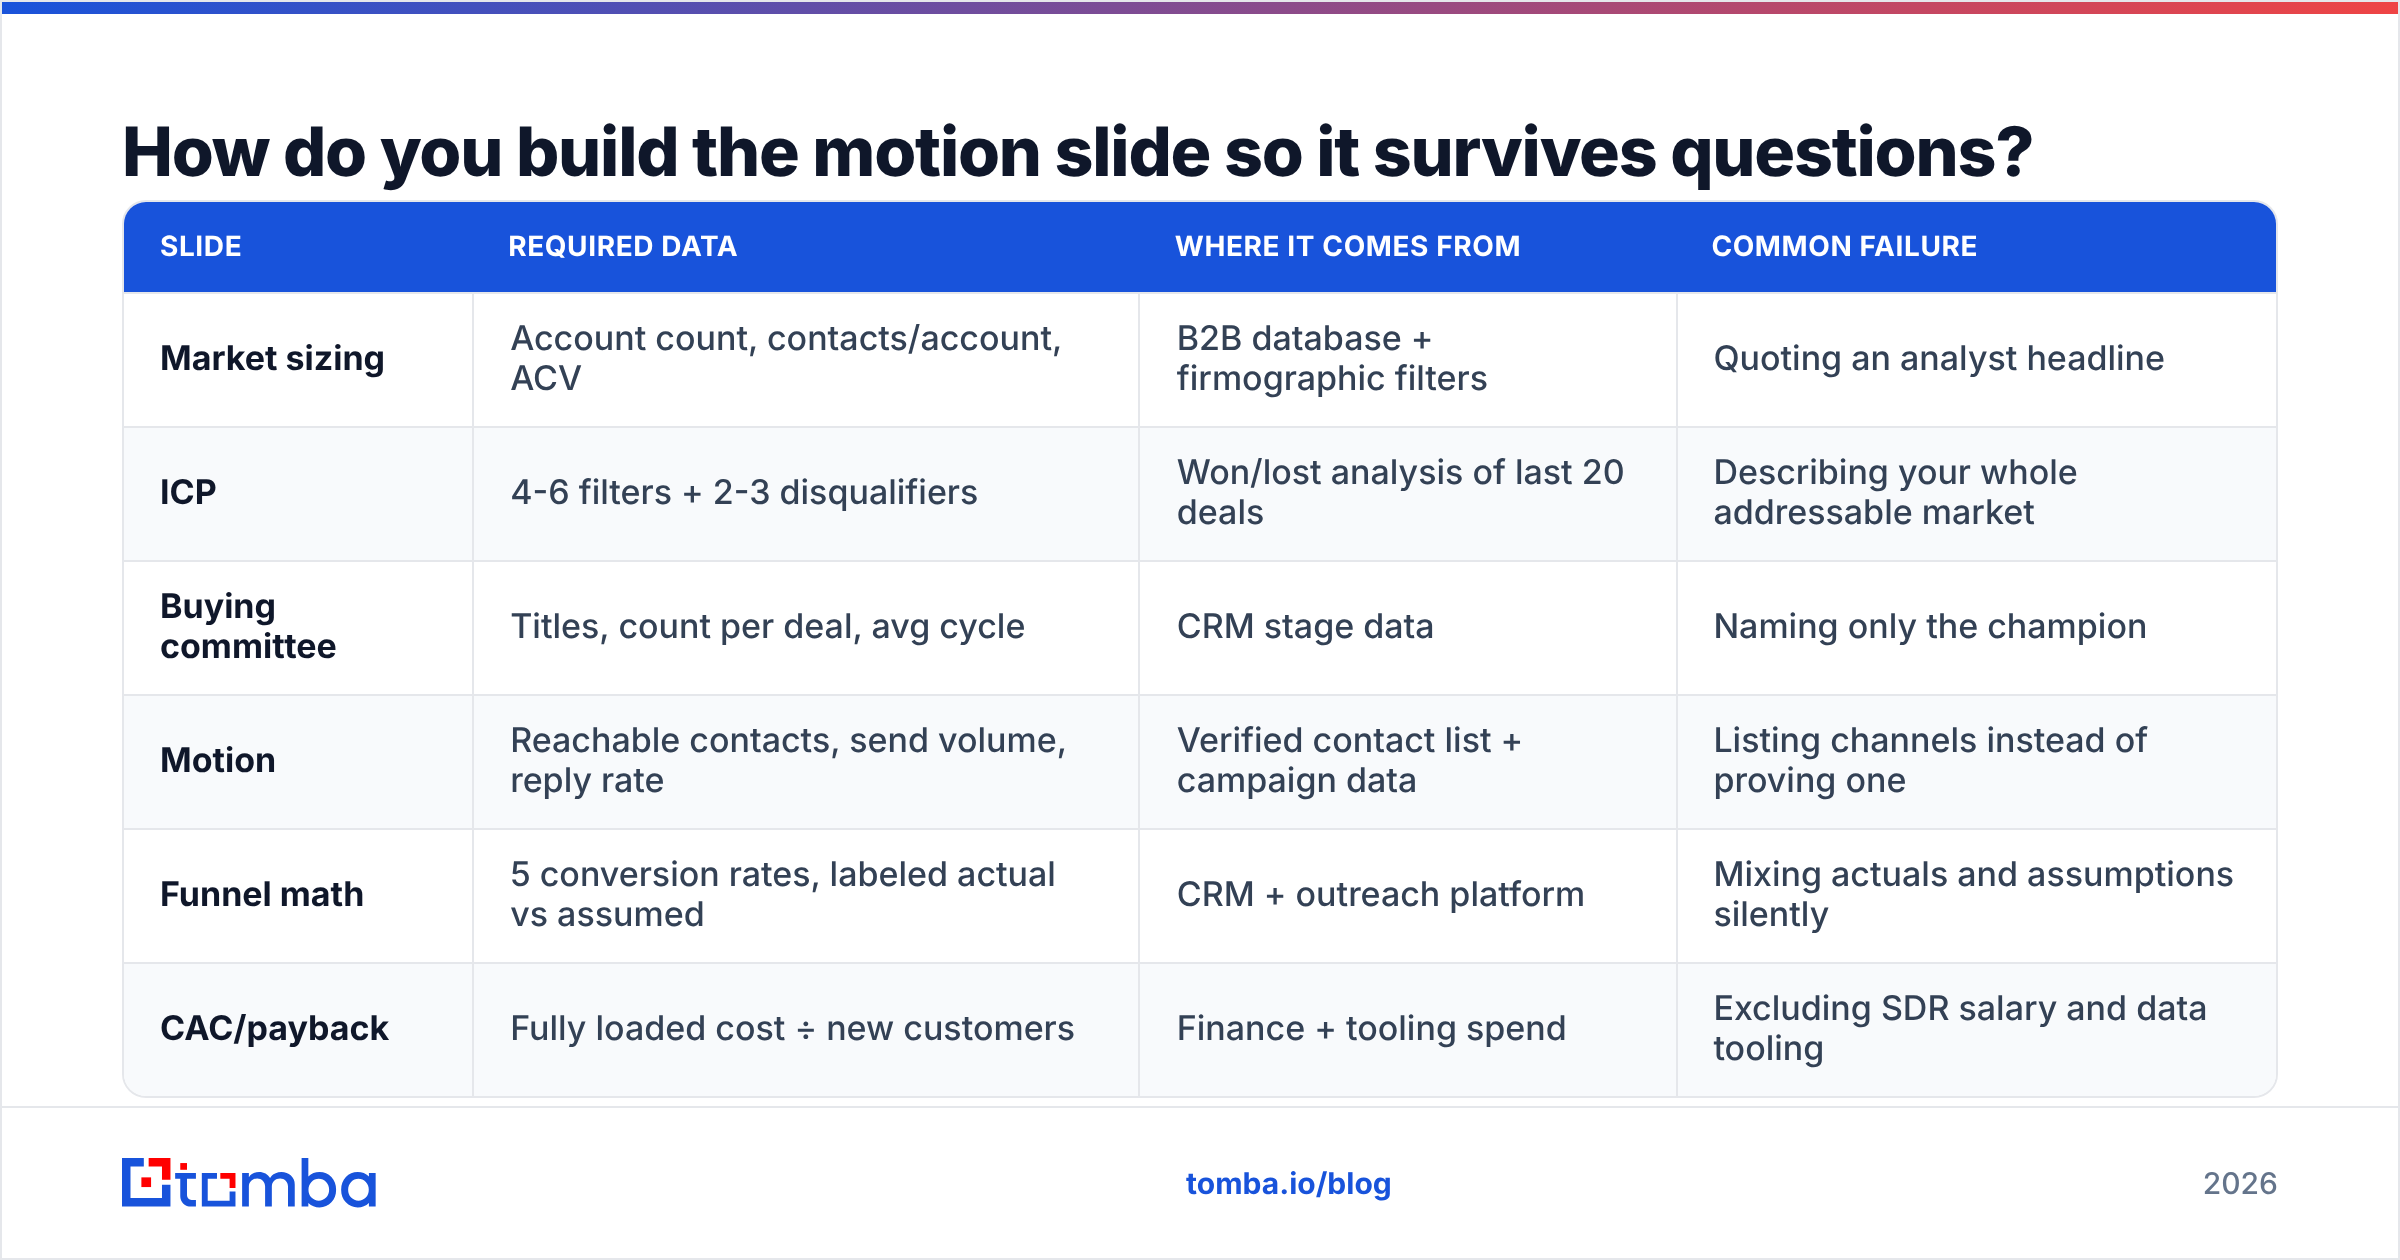
What data does each core slide actually need?#
| Slide | Required data | Where it comes from | Common failure |
|---|---|---|---|
| Market sizing | Account count, contacts/account, ACV | B2B database + firmographic filters | Quoting an analyst headline |
| ICP | 4-6 filters + 2-3 disqualifiers | Won/lost analysis of last 20 deals | Describing your whole addressable market |
| Buying committee | Titles, count per deal, avg cycle | CRM stage data | Naming only the champion |
| Motion | Reachable contacts, send volume, reply rate | Verified contact list + campaign data | Listing channels instead of proving one |
| Funnel math | 5 conversion rates, labeled actual vs assumed | CRM + outreach platform | Mixing actuals and assumptions silently |
| CAC/payback | Fully loaded cost ÷ new customers | Finance + tooling spend | Excluding SDR salary and data tooling |
Is a fundraising GTM deck different from an internal one?#
Yes, in emphasis and in what you are allowed to leave out.
| Dimension | Investor GTM deck | Internal GTM plan deck |
|---|---|---|
| Length | 4-6 slides inside a larger raise deck | 15-25 standalone slides |
| Leads with | Market size and why now | The motion and the sequence |
| Detail on channels | One proven channel, briefly | Every channel with owners and budgets |
| Financial depth | CAC, payback, LTV:CAC ratio | Full quota model, ramp curves, headcount plan |
| Risk framing | Mitigated risks only | Explicit risk register with contingencies |
| Time horizon | 18-24 months | 2 quarters, week by week |
| Audience question | "Can this become big?" | "Can we execute this by Q3?" |
Investors want to know the ceiling. Your leadership team wants to know the next 90 days. Presenting one to the other audience is the most common structural mistake in GTM decks — a 25-slide execution plan bores a VC, and a 5-slide market story leaves your VP of Sales with nothing to run.
What should the ICP slide look like in 2026?#
Specific enough that someone could build the list from the slide alone.
A usable ICP slide has four blocks:
- Firmographics — industry, employee count band, revenue band, geography, funding stage. Ranges, not adjectives.
- Technographics — the tools in their stack that signal fit. "Running HubSpot" or "using Snowflake" is a filter; "modern data stack" is not. You can detect these at scale with a website tech stack check.
- Trigger events — new funding, a relevant executive hire, a job posting for the role your product replaces, a pricing page change.
- Disqualifiers — the traits that predicted a loss in your last 20 deals. Under 25 employees. No dedicated ops person. Procurement-heavy enterprise when your motion is self-serve.
Run the reverse test on your own draft: hand the slide to someone outside the team and ask them to produce 100 matching companies. If they cannot, the slide is a description, not a definition.
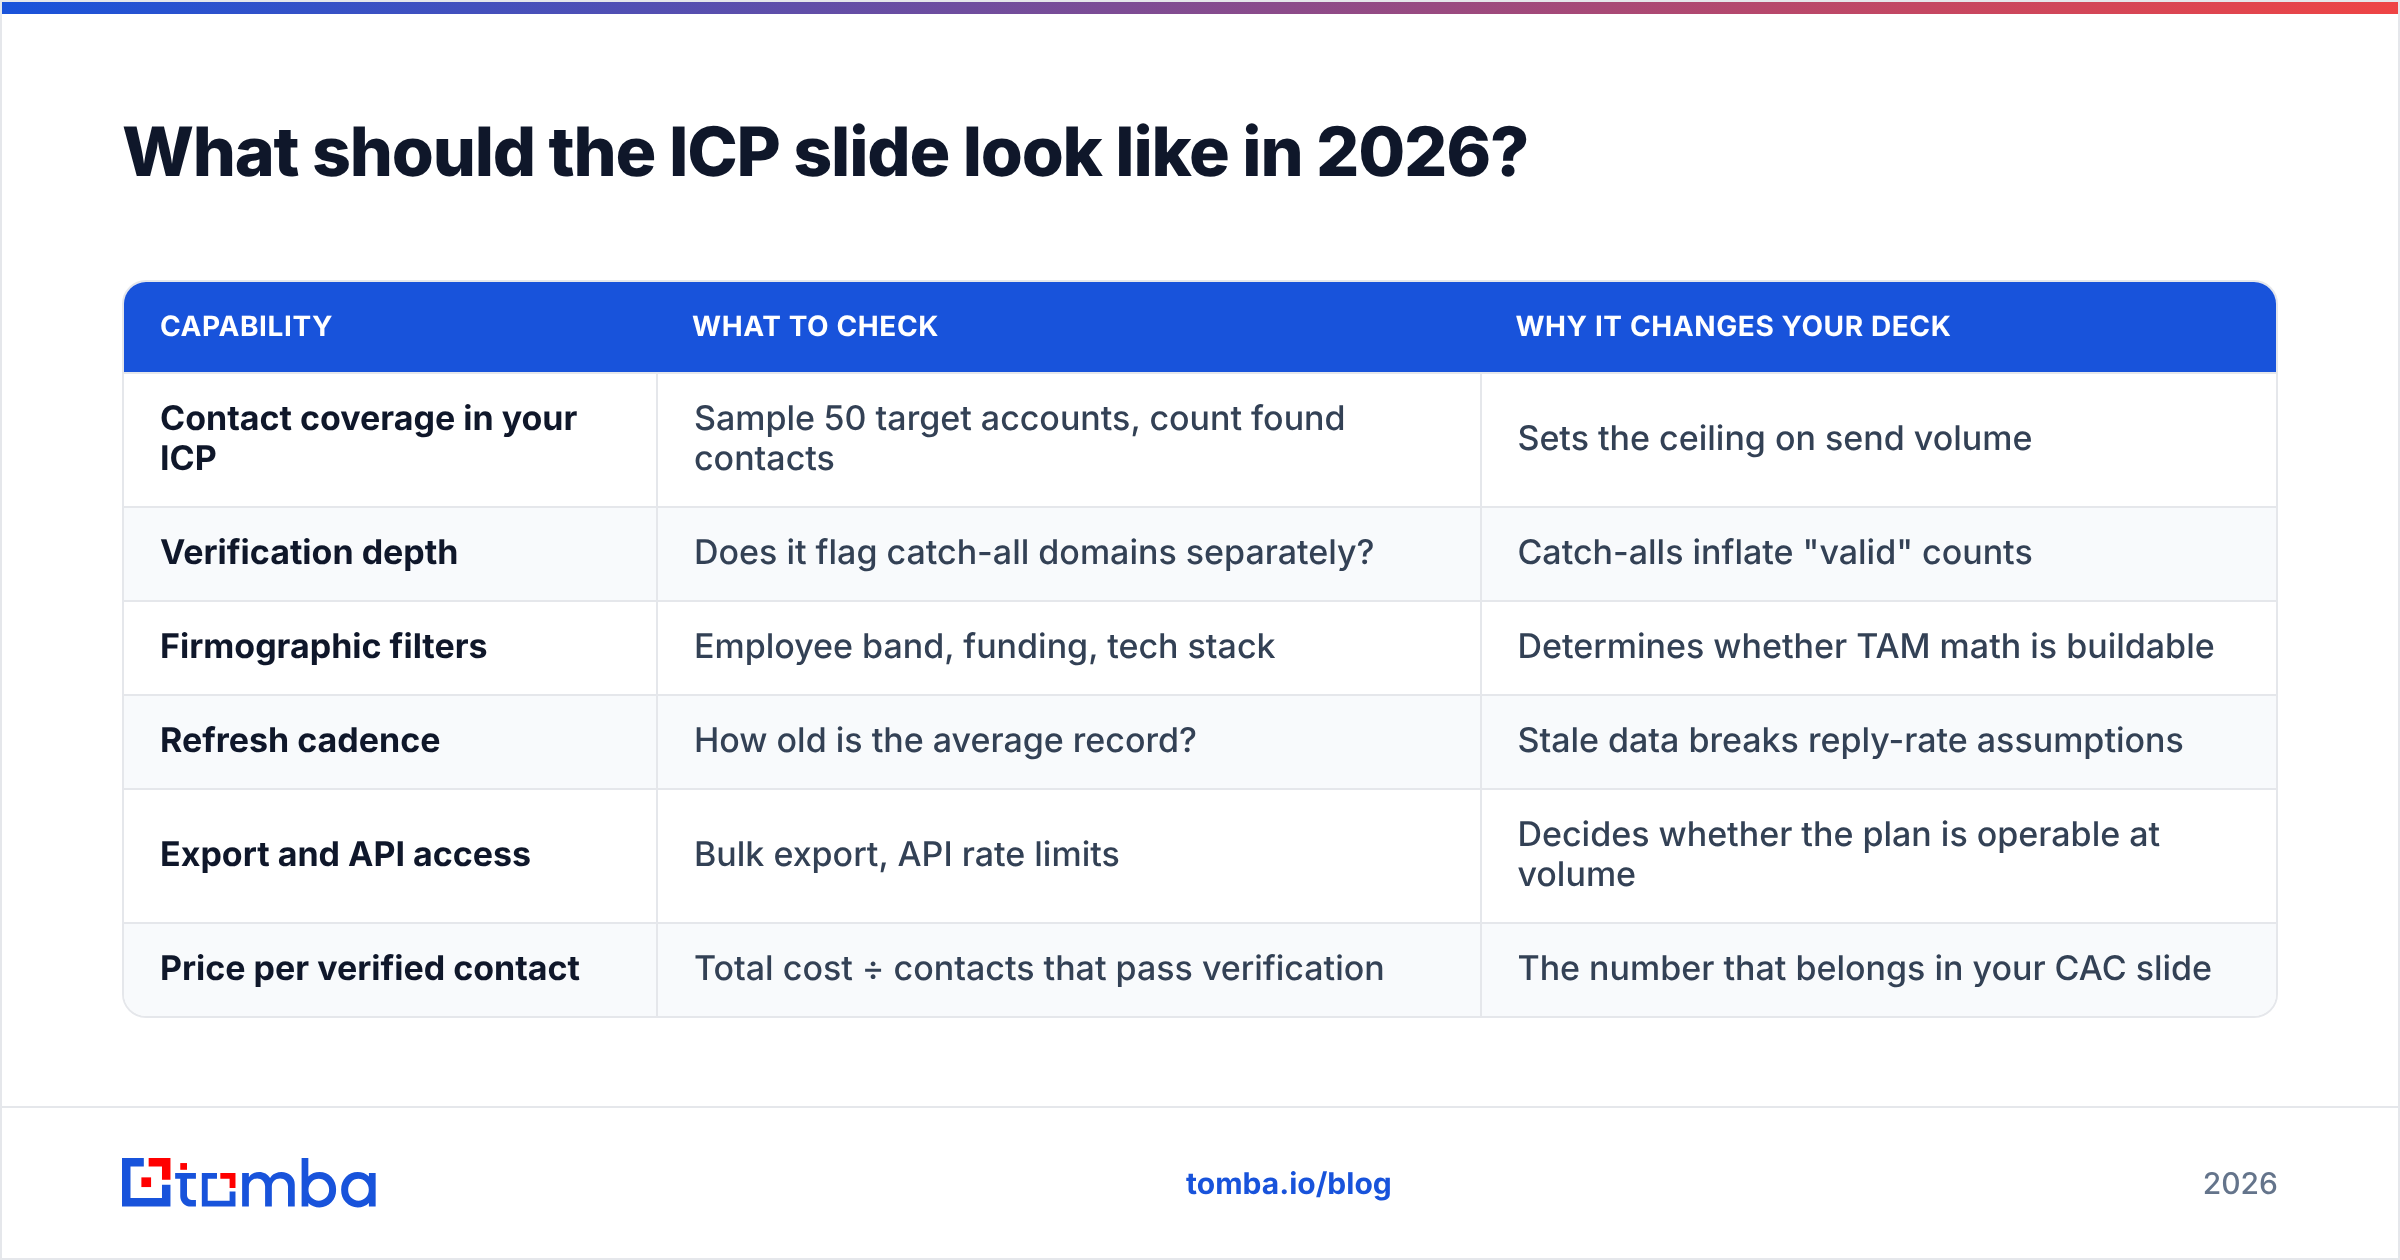
Data vendors differ meaningfully here, and the honest comparison matters because your motion slide inherits whatever accuracy you buy:
| Capability | What to check | Why it changes your deck |
|---|---|---|
| Contact coverage in your ICP | Sample 50 target accounts, count found contacts | Sets the ceiling on send volume |
| Verification depth | Does it flag catch-all domains separately? | Catch-alls inflate "valid" counts |
| Firmographic filters | Employee band, funding, tech stack | Determines whether TAM math is buildable |
| Refresh cadence | How old is the average record? | Stale data breaks reply-rate assumptions |
| Export and API access | Bulk export, API rate limits | Decides whether the plan is operable at volume |
| Price per verified contact | Total cost ÷ contacts that pass verification | The number that belongs in your CAC slide |
Tools worth benchmarking against each other include Tomba, BookYourData, Apollo, and Clearbit — each optimizes for a different tradeoff between coverage, verification strictness, and price. Read peer reviews on G2 rather than trusting any vendor's own accuracy claim, including ours. Then sample the same 50 accounts across two or three tools and count.
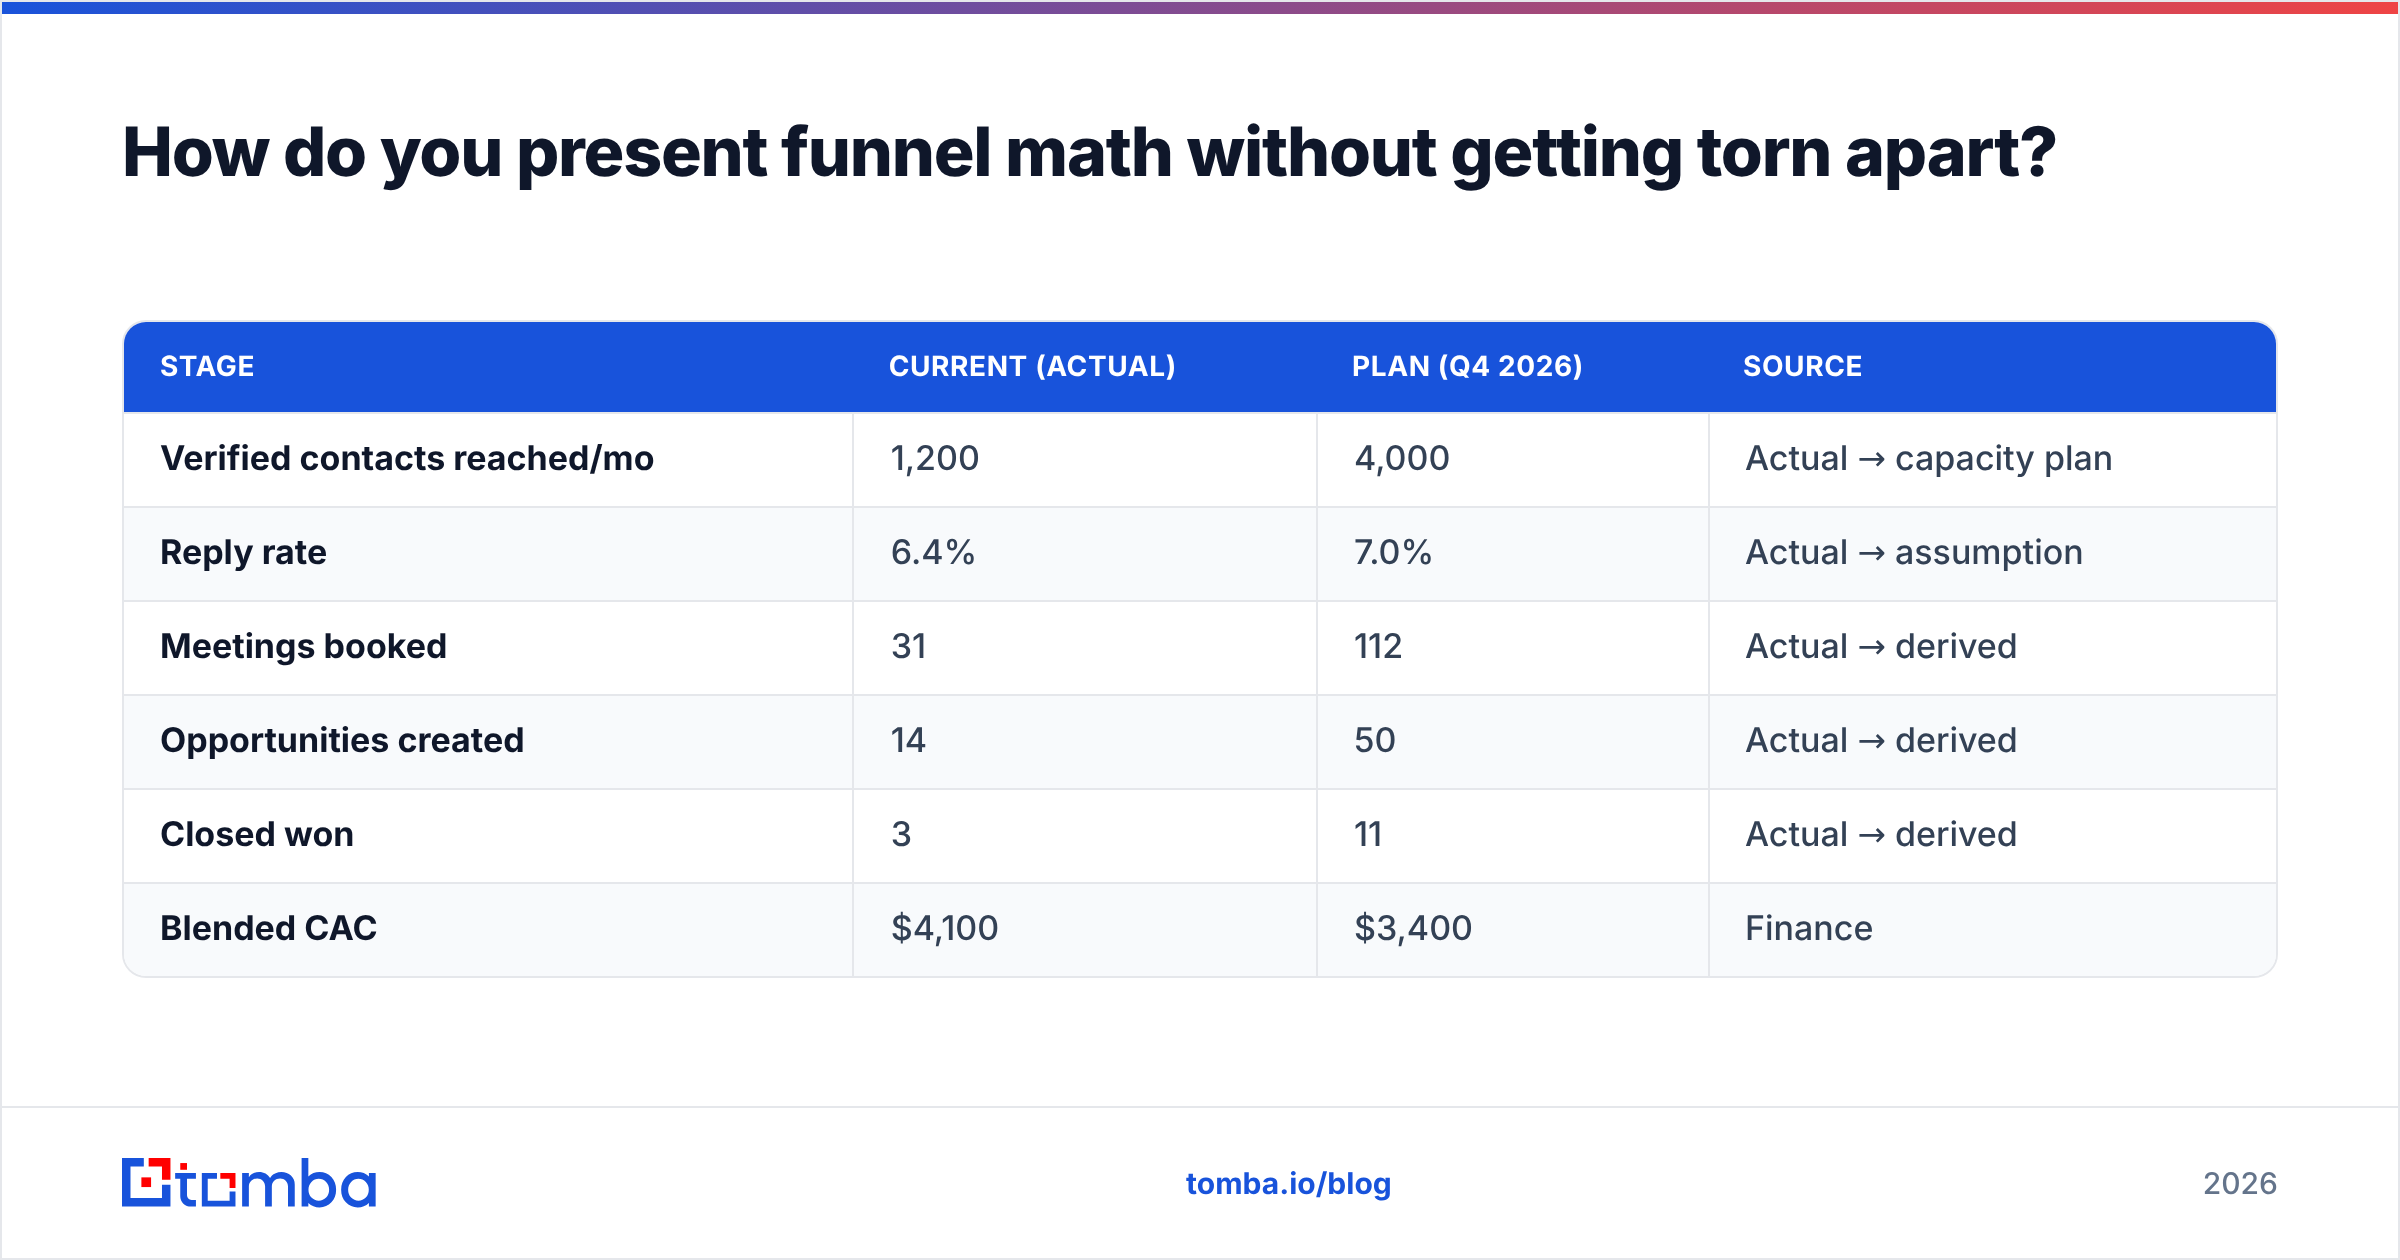
How do you present funnel math without getting torn apart?#
Label every number as actual, benchmark, or assumption. Then show the sensitivity.
The three-column format works better than a funnel graphic:
| Stage | Current (actual) | Plan (Q4 2026) | Source |
|---|---|---|---|
| Verified contacts reached/mo | 1,200 | 4,000 | Actual → capacity plan |
| Reply rate | 6.4% | 7.0% | Actual → assumption |
| Meetings booked | 31 | 112 | Actual → derived |
| Opportunities created | 14 | 50 | Actual → derived |
| Closed won | 3 | 11 | Actual → derived |
| Blended CAC | $4,100 | $3,400 | Finance |
Then add one line under it: "If reply rate holds at 6.4% instead of 7.0%, Q4 closed-won drops from 11 to 10." That single sentence signals you have modeled the downside, and it preempts the question the sharpest person in the room was about to ask.
Two things to avoid. First, do not present a reply rate above 10% as a plan assumption unless you have sustained it — reviewers who run outbound know the response rate distribution and will discount everything else on the slide. Second, do not show conversion rates without showing volume; a 40% meeting-to-opportunity rate on 5 meetings is noise.
What are the mistakes that sink a GTM deck?#
- Listing channels instead of proving one. Five unproven channels is worse than one proven channel, because it reads as indecision.
- Unverified contact counts. Citing a raw list size instead of a verified count. When someone asks about bounce rate and you do not have the number, the whole deck loses a grade.
- Missing disqualifiers. An ICP without exclusions means you have not lost enough deals to learn anything, or you have not analyzed the losses.
- CAC that excludes people. Ad spend divided by customers is not CAC. Include SDR salary, tooling, and data costs or someone will do it for you, live.
- A 24-month plan with no 90-day slide. Ambition without sequencing reads as hope.
- Competitive slides with only checkmarks. A grid where you win every row destroys trust. Name the two scenarios where a competitor is the better choice and explain why those buyers are not your ICP.
How do you get the contact data behind the deck?#
Work backward from the funnel math. Decide the closed-won number you need, divide by your conversion rates, and you get the required volume of verified contacts. That number — not a vibe — is your data requirement.
The sequence that works:
- Define ICP filters — firmographics, technographics, disqualifiers.
- Build the account list — apply filters to a database and export. Expect 20-40% to fail a manual sanity check; budget for it.
- Find contacts per account — use domain search to pull every addressable role at each target company, then filter to your buying committee titles.
- Verify before counting — run the full list through verification and treat catch-all domains as a separate bucket with their own expected bounce rate.
- Enrich for personalization — add the fields your sequences actually reference. If your email does not use a field, do not pay to enrich it.
- Report the honest number — verified contacts, catch-alls flagged separately, on the slide.
That last step is what separates a deck that survives diligence from one that quietly falls apart in week three of execution. Anyone can put 41,000 on a slide. Putting 32,400 verified plus 8,600 catch-all on a slide tells the room you have done the work.
Costs matter here too, and they belong in your CAC slide. If you are pricing data tooling for the plan, compare Tomba pricing tiers — Free (25 searches/mo), Starter at $49/mo, Growth at $99/mo, Pro at $249/mo — against the per-verified-contact cost of whatever else you are evaluating. The number that belongs in the deck is cost per contact that passes verification, not cost per credit.
Build the contact math first#
The strongest go to market pitch deck is the one where every slide traces back to a defensible contact count. Market sizing comes from account counts. The motion slide comes from reachable contacts. Funnel math comes from send volume. CAC comes from what those contacts cost. Get the data layer right and the deck writes itself; get it wrong and you are presenting a spreadsheet of guesses in a nice font.
Start with the list. Use the Tomba Email Finder to build and verify the contact set behind your ICP — pull every addressable role at your target accounts, verify before you count, and flag catch-alls separately so the number on your slide is the number your reps will actually reach. The free tier covers 25 searches, which is enough to sample 25 target accounts and see whether your TAM math holds before you commit it to a slide someone will fact-check.
Related guides#
Ready to find emails that actually work?
Join 150,000+ professionals who stopped guessing and started sending. Free credits on signup — no credit card required.
Get the Tomba newsletter
Practical outbound tactics and product updates — once every two weeks.
About the author