Go To Market Pitch Deck Slide: How to Build One That Lands
Most GTM slides get skipped because they list channels instead of proving a repeatable motion. Here's the structure, math, and data sourcing investors actually check.

TL;DR
- The go to market pitch deck slide is the one investors use to decide whether your traction is repeatable or lucky. It sits between traction and financials, and it gets roughly 12 seconds of attention.
- Listing channels ("SEO, outbound, partnerships, PLG") is the single most common failure. Investors want one primary motion with unit economics attached.
- The strongest version has four components: ICP definition with a countable universe, the primary motion, CAC/payback math, and one proof point from real data.
- Your TAM and ICP numbers need a defensible source. "We estimate 400k companies" loses; "38,412 companies matched our ICP filters, 22,109 with verified contact data" wins.
- Build the slide backwards from the metric you can actually defend, not forwards from the channels you wish worked.
What is a go to market pitch deck slide?#
The go to market pitch deck slide is the section of your fundraising deck that explains how you acquire customers, at what cost, and why that process will keep working as you scale. It usually lands as slide 8 or 9 in a standard seed or Series A deck — after problem, solution, market, product, and traction, and just before competition and financials.
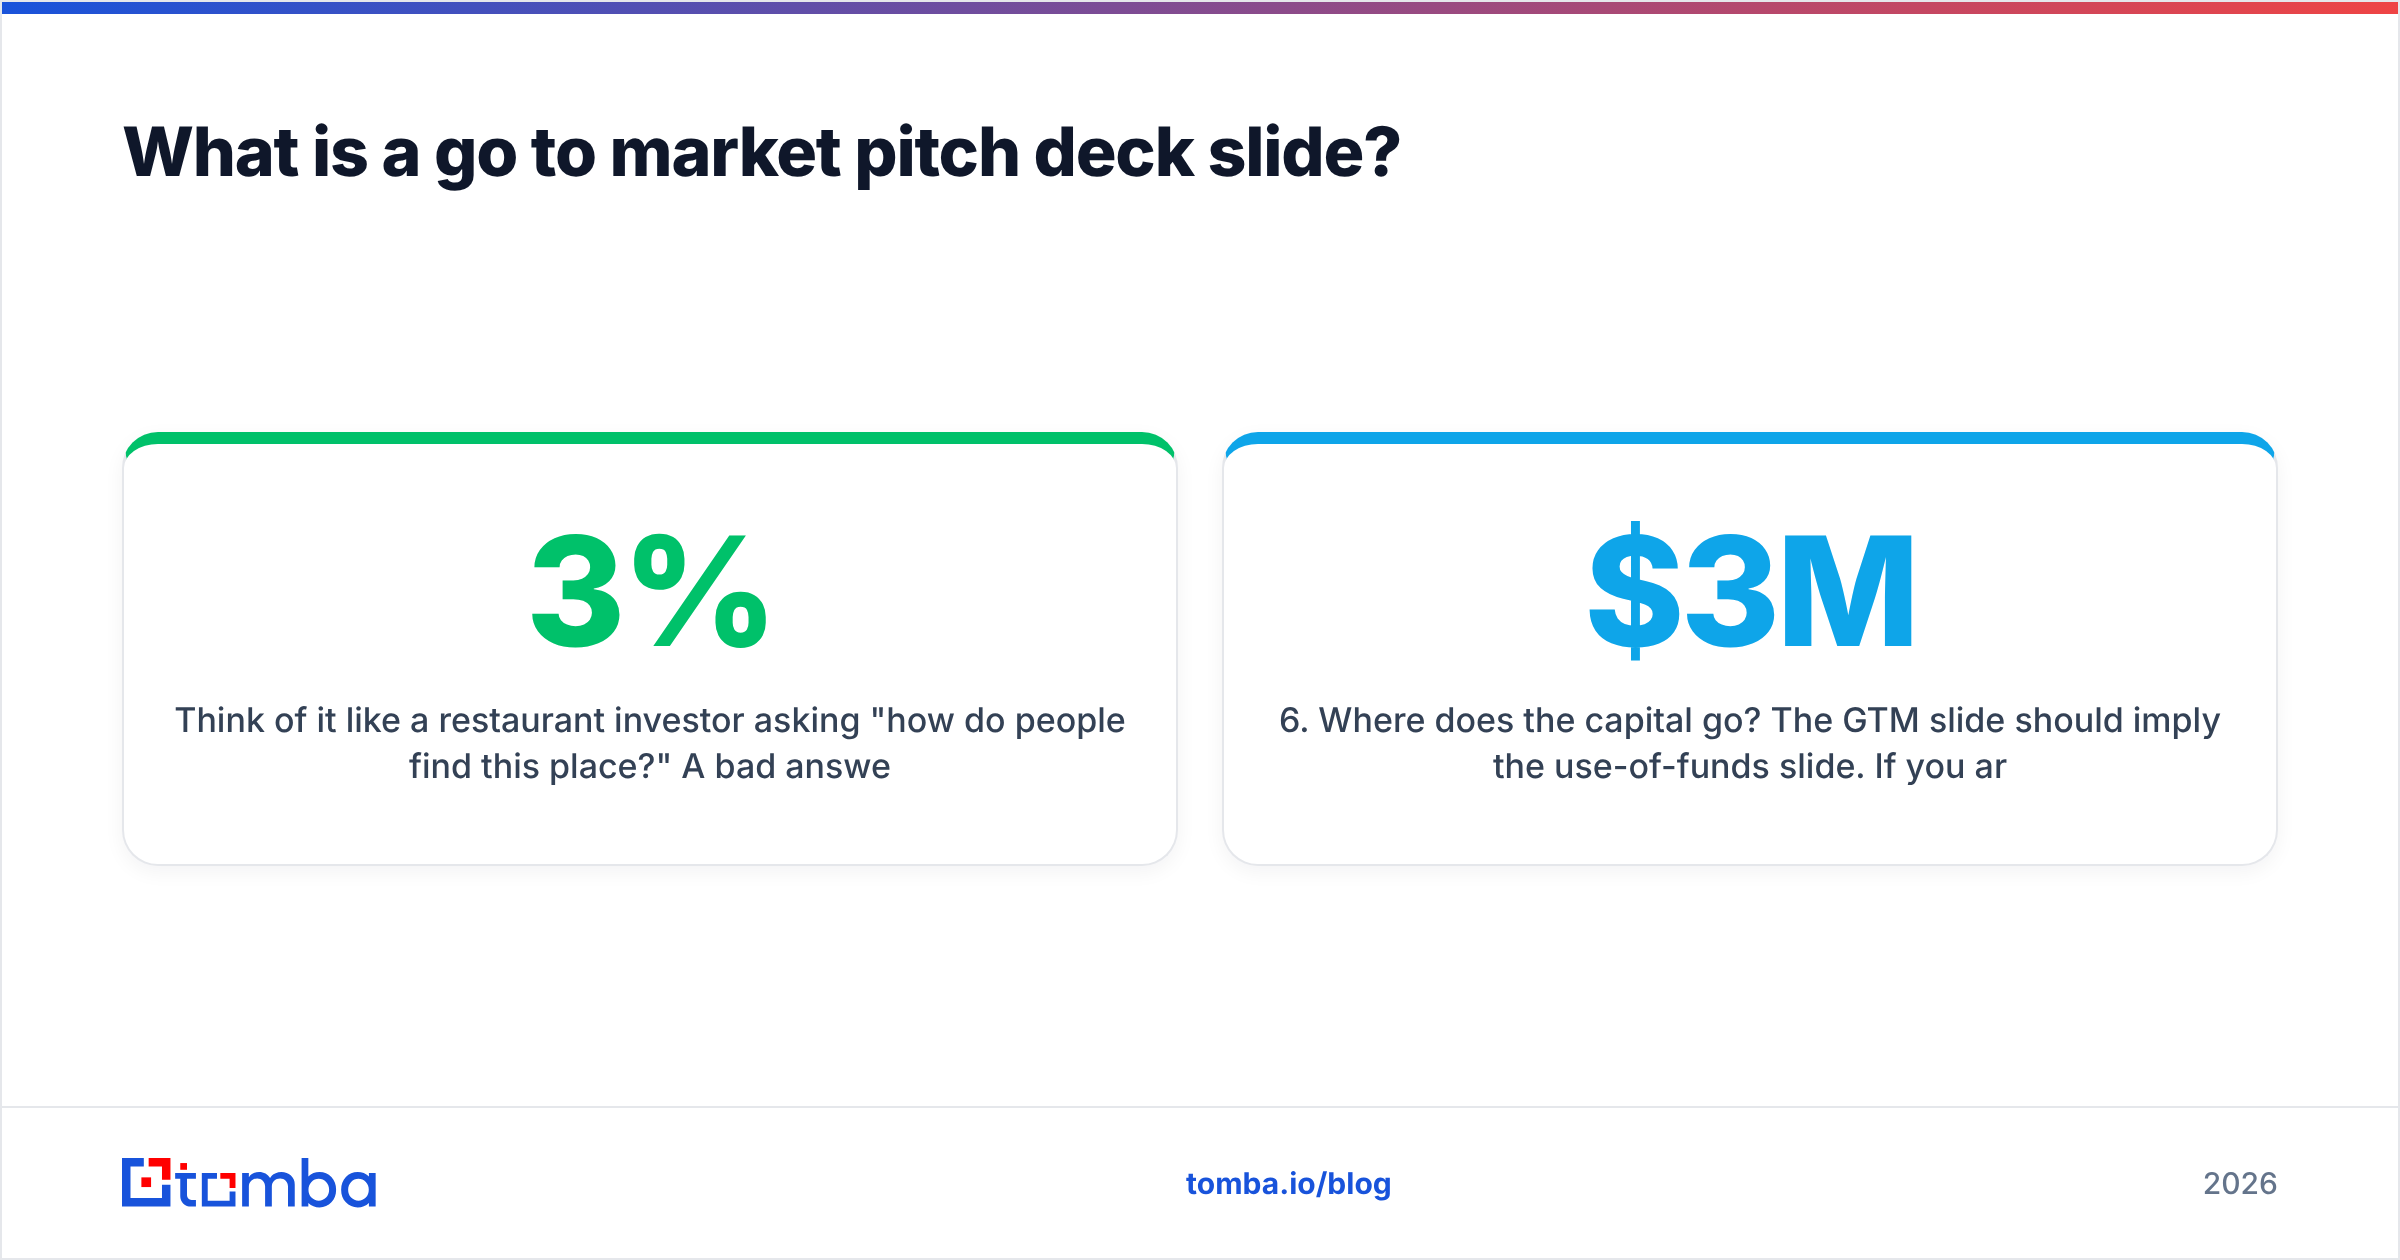
Think of it like a restaurant investor asking "how do people find this place?" A bad answer lists everything: signage, Instagram, delivery apps, word of mouth. A good answer is specific: "Two office towers within a three-minute walk hold 4,200 workers. We convert 3% of them at lunch, we spend $1.10 per acquired regular through a badge-scan promo, and they come back 2.4 times a week." One is a hope. The other is a machine with dials.
Investors are not evaluating your creativity here. They are evaluating whether the traction you showed on the previous slide came from a process you can repeat with their money. That reframe changes everything about what belongs on the slide.
What investors are actually checking#
- Is the ICP countable? Vague segments ("mid-market SaaS") signal you have not done the work. Precise segments with a number attached signal you have.
- Is there one primary motion? Startups that name four channels usually have zero working channels. Name one that works and one you are testing.
- Do the unit economics close? CAC, ACV, payback period, and gross margin need to appear somewhere — on the slide or in the appendix you flip to when asked.
- Is the evidence real? A conversion rate from 40 conversations is anecdote. From 400, it is a rate.
- Does it scale linearly or does it break? If your motion is founder-led sales, say what replaces the founder at 10x volume.
- Where does the capital go? The GTM slide should imply the use-of-funds slide. If you are raising $3M and your CAC is $4,000, investors will do the division in their heads.

Why do most GTM slides get skipped?#
Because they are decorative. The typical version is a four-column layout with icons — a magnet for "inbound," a megaphone for "outbound," a handshake for "partnerships," a rocket for "product-led." Zero numbers. Zero commitment. It reads like a menu of things the founder has heard of.
The second failure mode is the funnel diagram with invented percentages. If your slide shows "10,000 visitors → 500 signups → 50 demos → 10 customers" and those numbers are round, investors assume they are modeled, not measured. Real funnel numbers are ugly: 9,412 → 388 → 61 → 7. Ugly numbers read as true.
Third failure: confusing GTM strategy with marketing tactics. "We'll run LinkedIn ads and start a podcast" is not a go-to-market motion. A motion is the repeatable sequence that turns a stranger into a paying account, including who does it, how long it takes, and what it costs.
Fourth: no mention of the sales cycle. A $30k ACV product with a 9-month cycle needs a fundamentally different capital plan than the same ACV at 30 days. If the cycle length is missing, the reviewer assumes you have not sold enough to know it.
The fix in every case is the same. Replace adjectives with arithmetic.
What should go on the slide?#
Four blocks. Nothing else fits in 12 seconds.
Block 1 — ICP with a countable universe. One sentence plus one number. "Series A–C B2B SaaS companies, 50–500 employees, US and UK, with an in-house SDR team. 12,840 companies match. 8,610 have a reachable VP Sales or CRO."
Block 2 — Primary motion in one line. "Outbound to VP Sales, triggered by a new SDR hire posting on their careers page. 4-touch sequence over 11 days, SDR-run, founder closes."
Block 3 — The economics. CAC, ACV, payback, and the conversion rate that drives them. Four numbers, stated plainly.
Block 4 — The proof. One line that anchors the numbers in reality: "Across 1,340 sequenced contacts in Q2, 6.1% booked, 31% of those closed, blended CAC $2,180."
Everything else — channel experiments, partnership pipeline, brand plans — belongs in the appendix. The appendix is where you win the follow-up meeting. The slide is where you earn it.
The four blocks compared to what founders usually write#
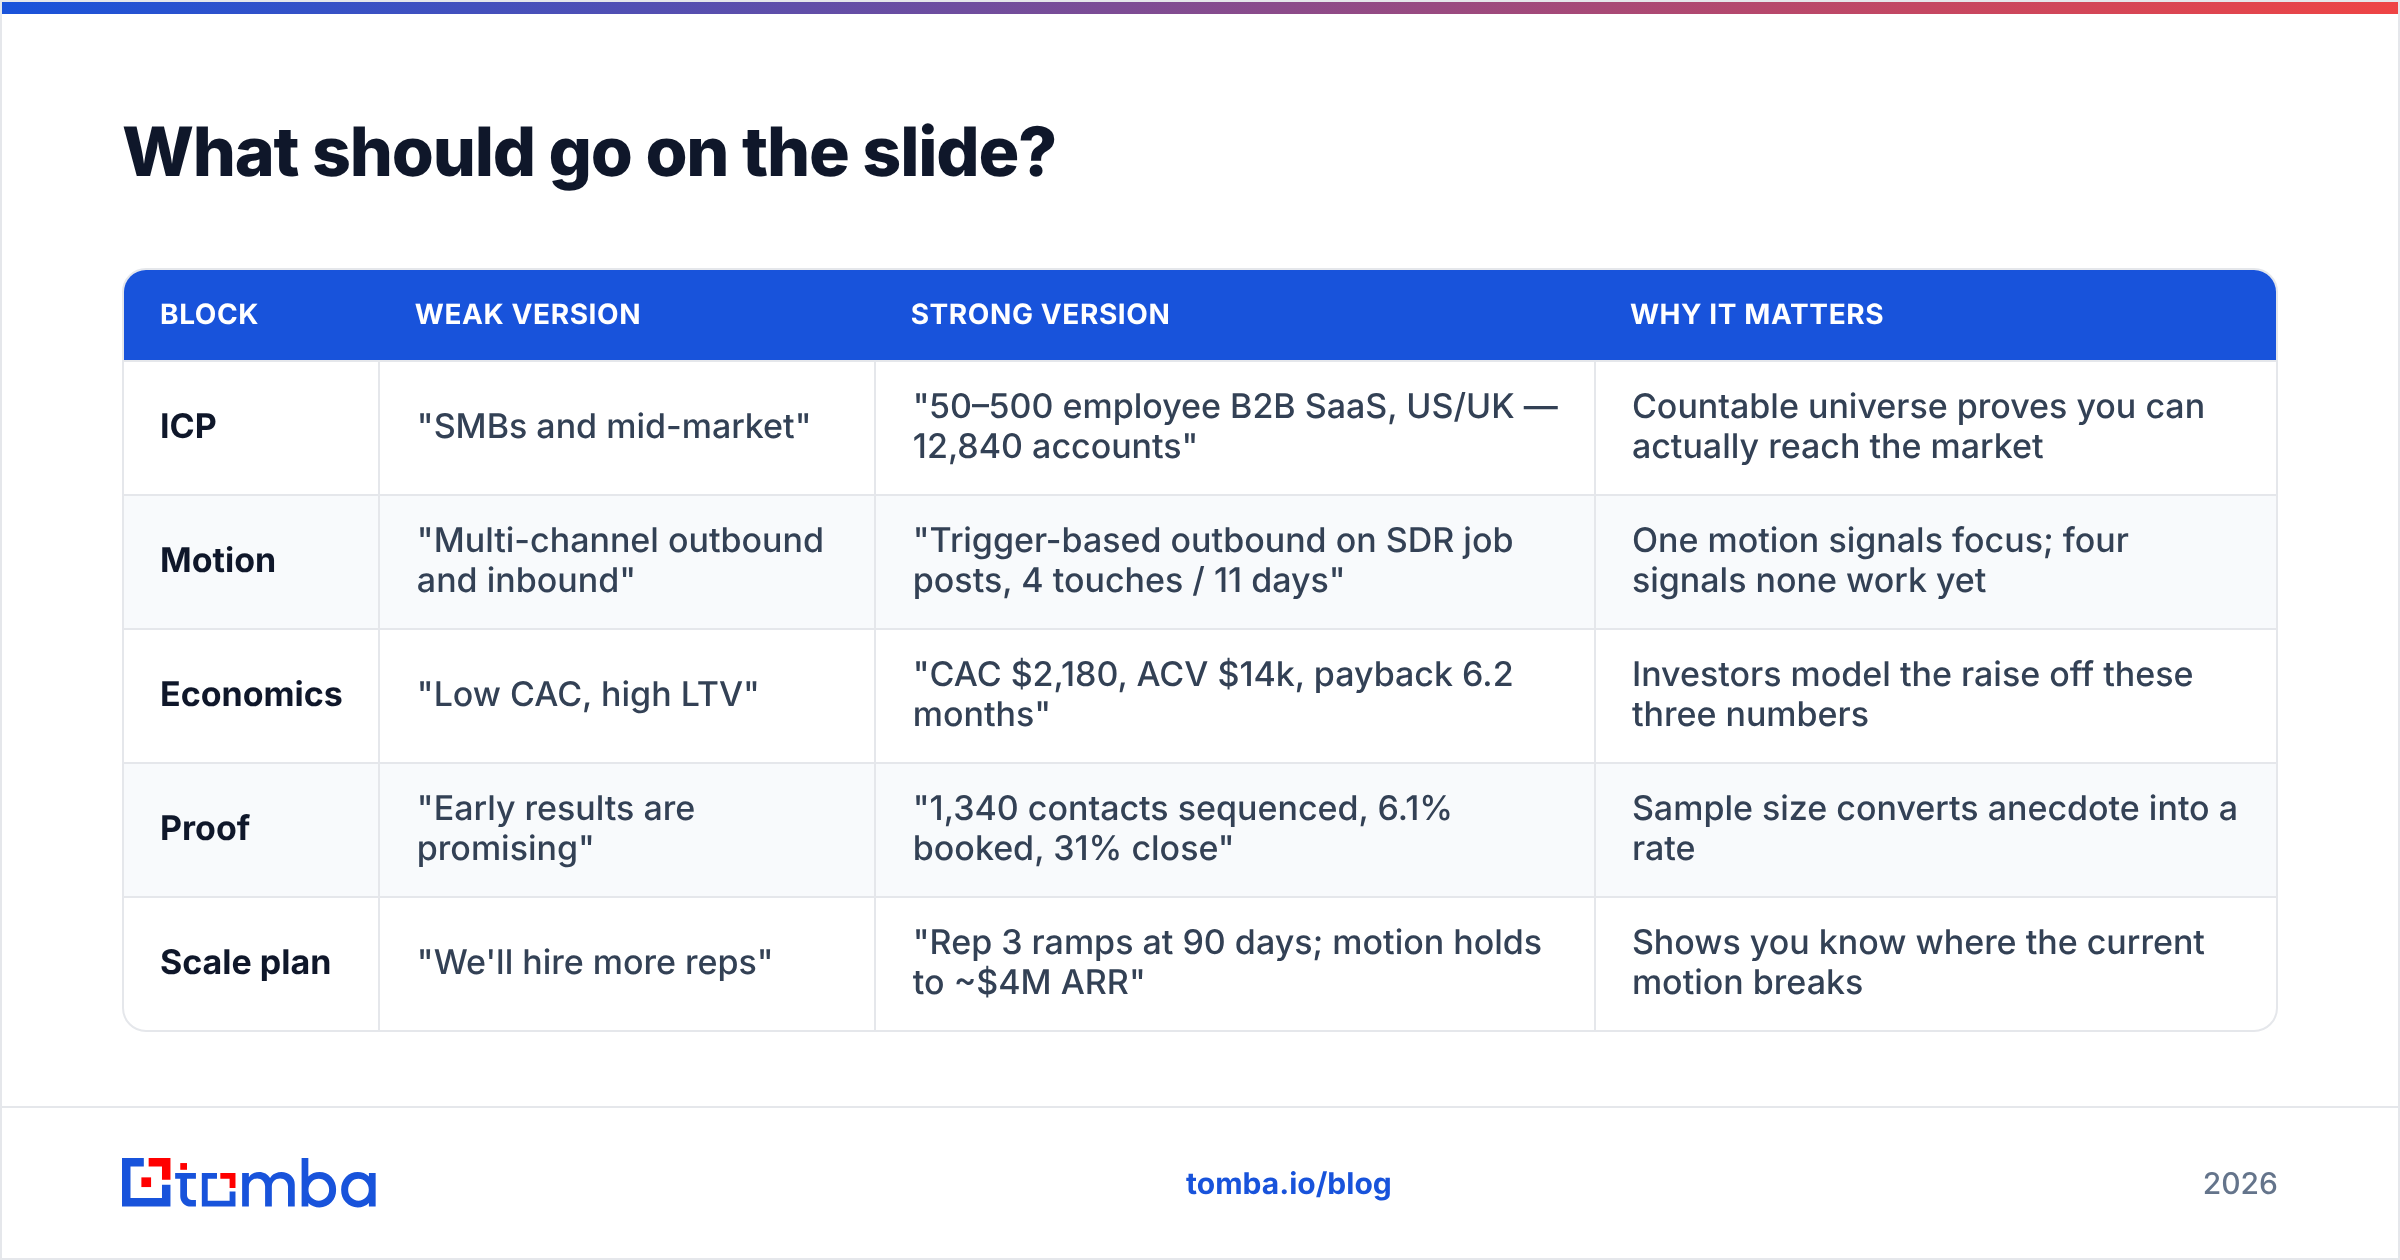
| Block | Weak version | Strong version | Why it matters |
|---|---|---|---|
| ICP | "SMBs and mid-market" | "50–500 employee B2B SaaS, US/UK — 12,840 accounts" | Countable universe proves you can actually reach the market |
| Motion | "Multi-channel outbound and inbound" | "Trigger-based outbound on SDR job posts, 4 touches / 11 days" | One motion signals focus; four signals none work yet |
| Economics | "Low CAC, high LTV" | "CAC $2,180, ACV $14k, payback 6.2 months" | Investors model the raise off these three numbers |
| Proof | "Early results are promising" | "1,340 contacts sequenced, 6.1% booked, 31% close" | Sample size converts anecdote into a rate |
| Scale plan | "We'll hire more reps" | "Rep 3 ramps at 90 days; motion holds to ~$4M ARR" | Shows you know where the current motion breaks |
How do you calculate the CAC number on the slide?#
Use fully loaded CAC, and say so on the slide. Fully loaded means every dollar that touched acquisition: rep salary and commission, tooling, ad spend, data and enrichment costs, and the fraction of founder time spent selling. Founders who exclude their own time post a CAC that quietly doubles after they hire a replacement, and sophisticated investors will ask about it.
The formula stays simple:
Fully loaded CAC = (Sales payroll + Marketing spend + GTM tooling + Data costs) ÷ New customers acquired, over the same period.
Two adjustments matter more than the formula itself.
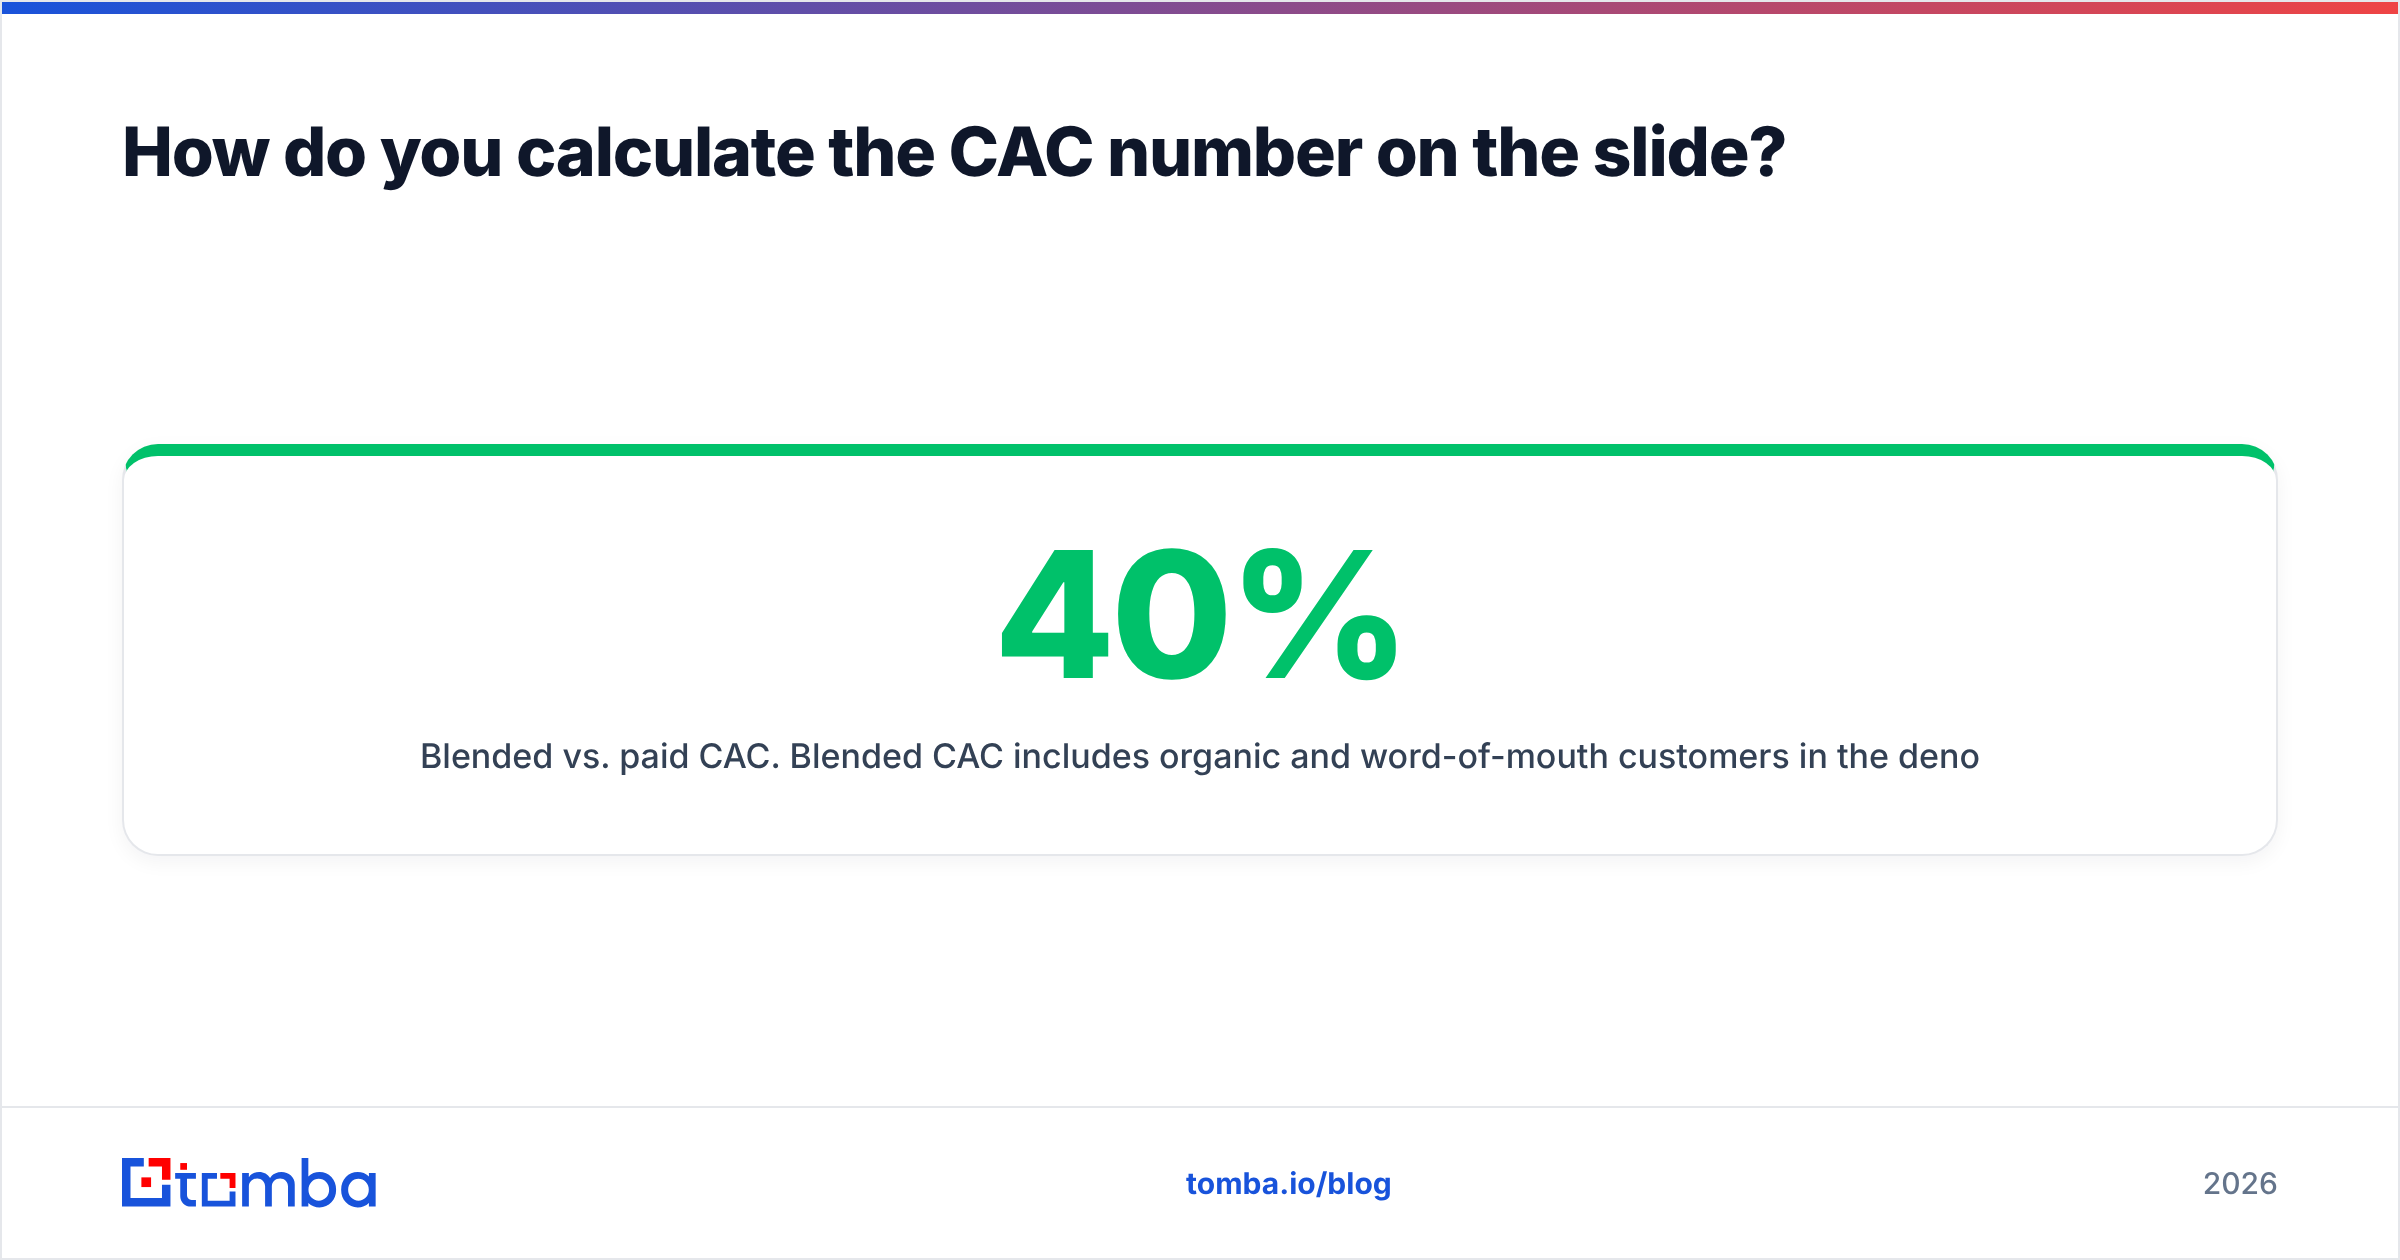
Blended vs. paid CAC. Blended CAC includes organic and word-of-mouth customers in the denominator, which flatters the number. If 40% of your customers arrived organically, report both: "Blended CAC $1,340; paid-channel CAC $3,100." Volunteering the less flattering number builds credibility faster than any other move on this slide.
Payback, not just ratio. LTV:CAC is easy to inflate because LTV depends on a churn assumption you invented. CAC payback period — months of gross profit needed to recover CAC — is harder to fake. According to benchmark data compiled by OpenView and similar SaaS research, efficient B2B SaaS companies target payback under 12 months, with best-in-class under 6. Put payback on the slide and keep LTV:CAC in the appendix.
One more practical note: your data and tooling line is a real CAC component. If you are spending on a B2B database, enrichment, and sequencing tools, that is acquisition cost. Founders routinely leave it out, then get caught when an investor sums the tool stack from the use-of-funds slide.
Where do the ICP and TAM numbers come from?#
This is the part of the go to market pitch deck slide that most often collapses under a single follow-up question: "How did you get to 12,840?"
There are three acceptable answers, in descending order of strength.
1. You counted them. You built filters matching your ICP, ran them against a contact database, and exported the actual count. This is the strongest answer because it is reproducible on a screen share. It also gives you a second number — how many of those accounts have a reachable decision-maker — which is the number that actually constrains your outbound plan.
2. You triangulated from a credible source. Public filings, industry association counts, or a research firm's segment sizing. Cite it on the slide in 6pt type. Investors do not check the citation; they check that you thought a citation was necessary.
3. You modeled it top-down and labeled it as a model. Weakest, but honest. "We estimate ~40k companies based on a 3% share of the 1.3M US firms in NAICS 5415." Label it "estimate." Never present a model as a count.
What kills you is the fourth option: a round number with no provenance. "The market is 500,000 companies" tells an investor you have never tried to reach one.
In practice, the fastest path to a defensible count is to run your ICP filters and then check contact coverage. Use a domain search to establish how many of the target accounts have discoverable role-based contacts, and run the resulting list through an email verifier so the reachable number you present is verified rather than assumed. The difference between "8,610 accounts" and "8,610 accounts, 84% with a verified VP-level email" is the difference between a claim and a demonstration.

Sourcing options for the ICP count#
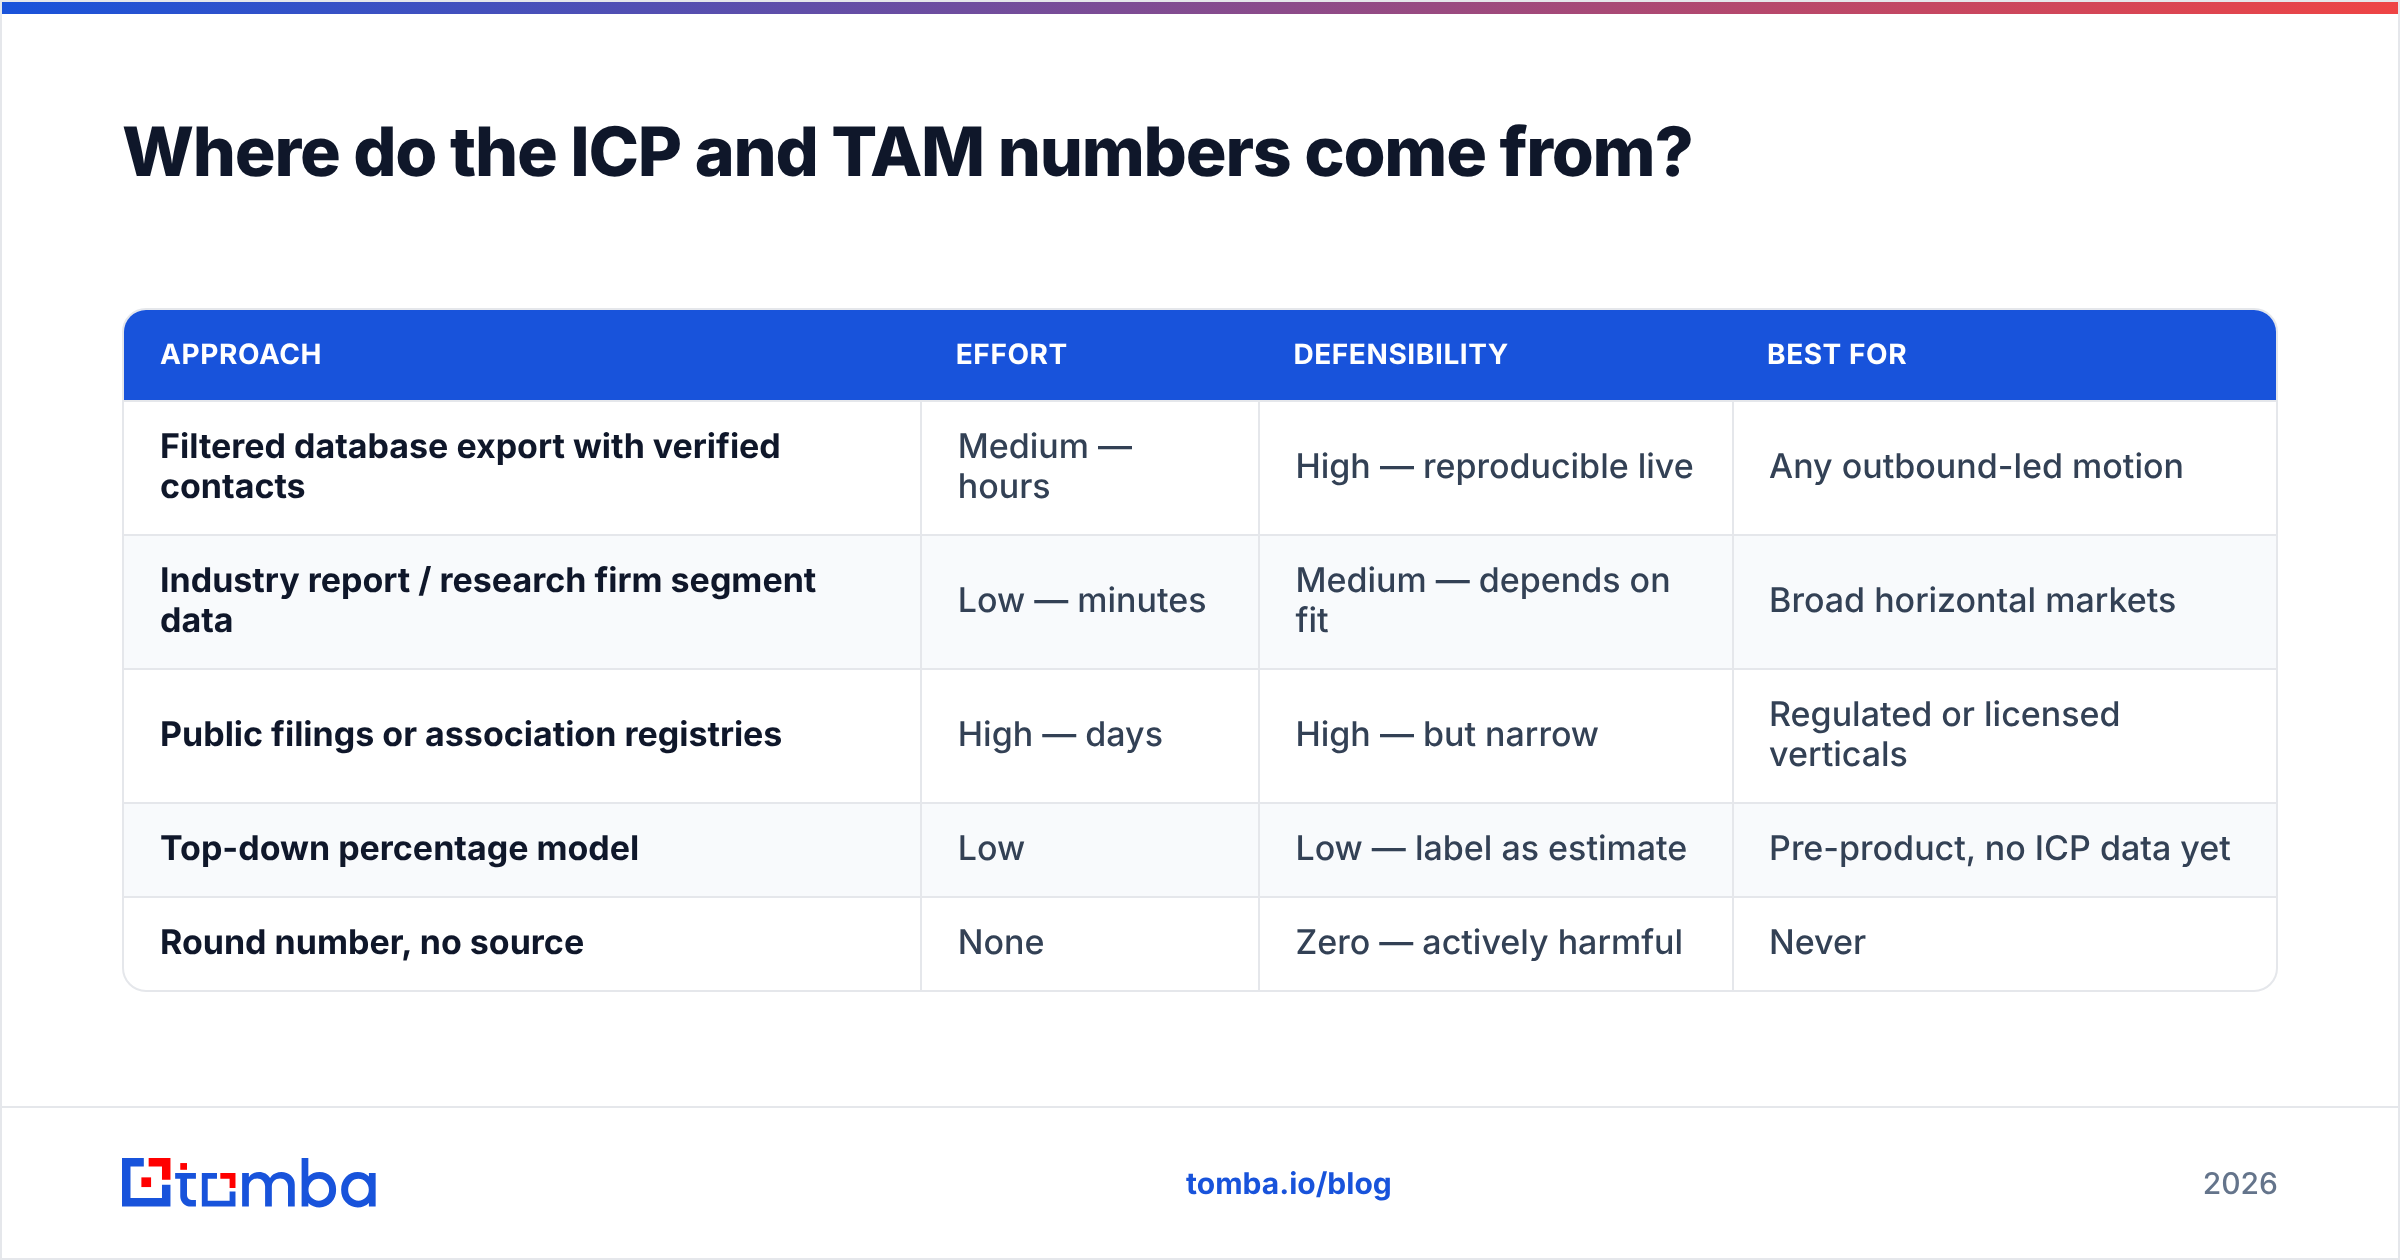
| Approach | Effort | Defensibility | Best for |
|---|---|---|---|
| Filtered database export with verified contacts | Medium — hours | High — reproducible live | Any outbound-led motion |
| Industry report / research firm segment data | Low — minutes | Medium — depends on fit | Broad horizontal markets |
| Public filings or association registries | High — days | High — but narrow | Regulated or licensed verticals |
| Top-down percentage model | Low | Low — label as estimate | Pre-product, no ICP data yet |
| Round number, no source | None | Zero — actively harmful | Never |
Should the slide differ by stage?#
Yes, substantially. The same four blocks stay, but what fills them changes with what you can honestly prove.
Pre-seed. You have 10–30 customer conversations, not a funnel. Your GTM slide should show the hypothesis and the smallest experiment that will validate it. "We believe trigger-based outbound to VP Sales converts at 4%+. We have run 180 contacts and seen 5.5%. Next 90 days: 1,500 contacts to confirm." Investors at this stage fund the quality of your experiment design, not the results.
Seed. You need one motion with real numbers behind it and a clear statement of what breaks first. Show 3–6 months of consistent funnel data. Name the constraint: data quality, rep capacity, or cycle length. Say which one the round solves.
Series A. The bar shifts to repeatability across people. Investors want to see that rep two and rep three hit similar numbers to the founder, that ramp time is measurable, and that CAC has not degraded as volume increased. A CAC that rose 60% when you tripled volume is the most common Series A red flag, and hiding it never works — they will find it in the data room.
Series B and beyond. Multi-motion becomes acceptable, even expected. Now the slide shows channel mix, contribution margin by channel, and the efficiency curve. This is the only stage where a four-column layout is defensible, because each column has three years of data under it.
At every stage, the honest constraint statement is the highest-leverage sentence on the slide. Founders think admitting a bottleneck weakens the pitch. It does the opposite — it tells the investor you know what their money buys.
How do you make the slide visually work?#
Three rules, all boring, all violated constantly.
One number should dominate. Pick the metric that best proves repeatability — usually CAC payback or the primary conversion rate — and set it 3–4x larger than everything else. The reviewer's eye lands there first, and if that number is good, they read the rest.
Left to right, not top to bottom. ICP → motion → economics → proof reads as a causal chain. Stacked blocks read as a list, and lists invite skimming.
Kill the icons. Every icon you remove makes room for a number. Investors reviewing 40 decks a week have developed genuine antibodies to icon grids; a slide that is 70% text and numbers with no decoration signals operating maturity better than any design system.
For live pitches, prepare a second version. The read-alone deck needs full sentences because you are not there to narrate. The presented deck can drop to fragments because you are the narration. Sending the presented version to an investor who reads it on a plane is how good motions get misjudged.
What is the appendix supposed to hold?#
The GTM appendix is where you answer questions before they are asked. Keep it to five slides:
- Full funnel with absolute numbers — every stage, actual counts, by month. Not percentages.
- Cohort retention or logo retention — because CAC only matters against a denominator that survives.
- Channel experiment log — what you tested, what it cost, what you learned, what you killed. The kills are the persuasive part.
- Rep ramp and capacity model — time to full productivity, quota, expected coverage per rep.
- Data and tooling stack with costs — the GTM operations backbone, including sourcing, verification, sequencing, and CRM. This slide preempts the "is your CAC fully loaded?" question entirely.
If you are running a serious outbound motion, that last slide is also where you demonstrate operational rigor. Showing that contacts are verified before they enter a sequence — and that bounce rates sit under 2% as a result — tells an experienced investor more about your team than three slides of strategy narrative. Bounce rate is a proxy for process discipline, and process discipline is what they are actually buying. Tools like a bulk email finder plus verification make that number defensible rather than aspirational, and platforms in this category — Tomba, Clearbit, BookYourData, and Apollo among them — sit in most modern GTM stacks for exactly that reason.
For broader benchmarking on what peer companies report, G2's category data and HubSpot's annual sales research both give you defensible reference points to cite when an investor challenges a conversion assumption.
A quick build checklist#
- Write the proof sentence first. One sentence, real numbers, from your actual data. Everything else on the slide exists to support it.
- Count your ICP. Run the filters, export the number, note the contact coverage percentage.
- Compute fully loaded CAC. Include founder time and data tooling. Report blended and paid separately.
- Name one motion. Second motion goes in the appendix as "testing," never on the main slide.
- State the constraint. One sentence on what breaks first and what the round fixes.
- Delete every icon. Replace the space with the payback number, set large.
That is a 90-minute exercise for most founders, and it is the highest ROI 90 minutes in deck prep. The market slide gets challenged, the product slide gets skimmed, but the GTM slide is where the "is this fundable" decision quietly gets made.
Ready to make your ICP count defensible?#
The weakest link in most GTM slides is the number nobody can reproduce. If your ICP universe, reachable-contact count, and outbound conversion math all trace back to a single verified dataset, the slide survives every follow-up question — including the ones asked in partner meeting when you are not in the room.
Start with Tomba Email Finder to build and verify the account list behind your ICP number. The free tier gives you 25 searches a month to sanity-check your segment before you commit; paid plans start at $49/mo for Starter, $99/mo for Growth, and $249/mo for Pro when you are ready to run the full motion. Build the count, verify the contacts, then put the real number on the slide.
Related guides#
Ready to find emails that actually work?
Join 150,000+ professionals who stopped guessing and started sending. Free credits on signup — no credit card required.
Get the Tomba newsletter
Practical outbound tactics and product updates — once every two weeks.
About the author