Go To Market Strategy Analysis: A 2026 Framework That Works
Most GTM reviews stall at a deck full of TAM slides. This guide shows the five-layer analysis that actually changes what your team does on Monday — with the metrics, tables, and data checks to run it.
TL;DR — go to market strategy analysis in five layers
- A go to market strategy analysis is a check-up, not a deck. You compare what your GTM plan claims against what your pipeline and CRM show.
- Five layers matter: market and ICP, offer and pricing, channel motion, funnel math, and data quality. Skip the fifth and the other four run on guesses.
- The usual failure is not the strategy. It is that nobody checks the ICP in the doc against the accounts that actually closed.
- Run the analysis every quarter. Use a fixed metric set: CAC payback, win rate by segment, pipeline coverage, contact-data accuracy.
- Bad contact data quietly breaks every number below it. Fix the input layer first.
What Is a Go To Market Strategy Analysis?#
A go to market strategy analysis is an audit of how you win customers. Who you target. What you sell them. Through which channels. At what cost. And whether the data backs any of it.
Here is the key split. A GTM strategy looks forward. A go to market strategy analysis looks back at evidence. One says "we sell to mid-market fintech RevOps leaders." The other pulls the last 200 closed-won deals. Then it asks if that sentence is true.
Most teams blur the two. They rebuild the deck each January. They refresh the TAM number. Nobody checks last year's guesses against real results. That is how you end up with a sharp ICP that covers 11% of revenue.
The analysis answers four blunt questions:
- Who is actually buying? Not who you wish were buying. Sort closed-won deals by company size, industry, buyer title, and channel.
- What does it cost to win them? Full CAC by segment and channel. Count tools and headcount, not just ad spend.
- Where does the motion break? Find the stage where deals fall off. Then ask if it is a targeting, message, or process problem.
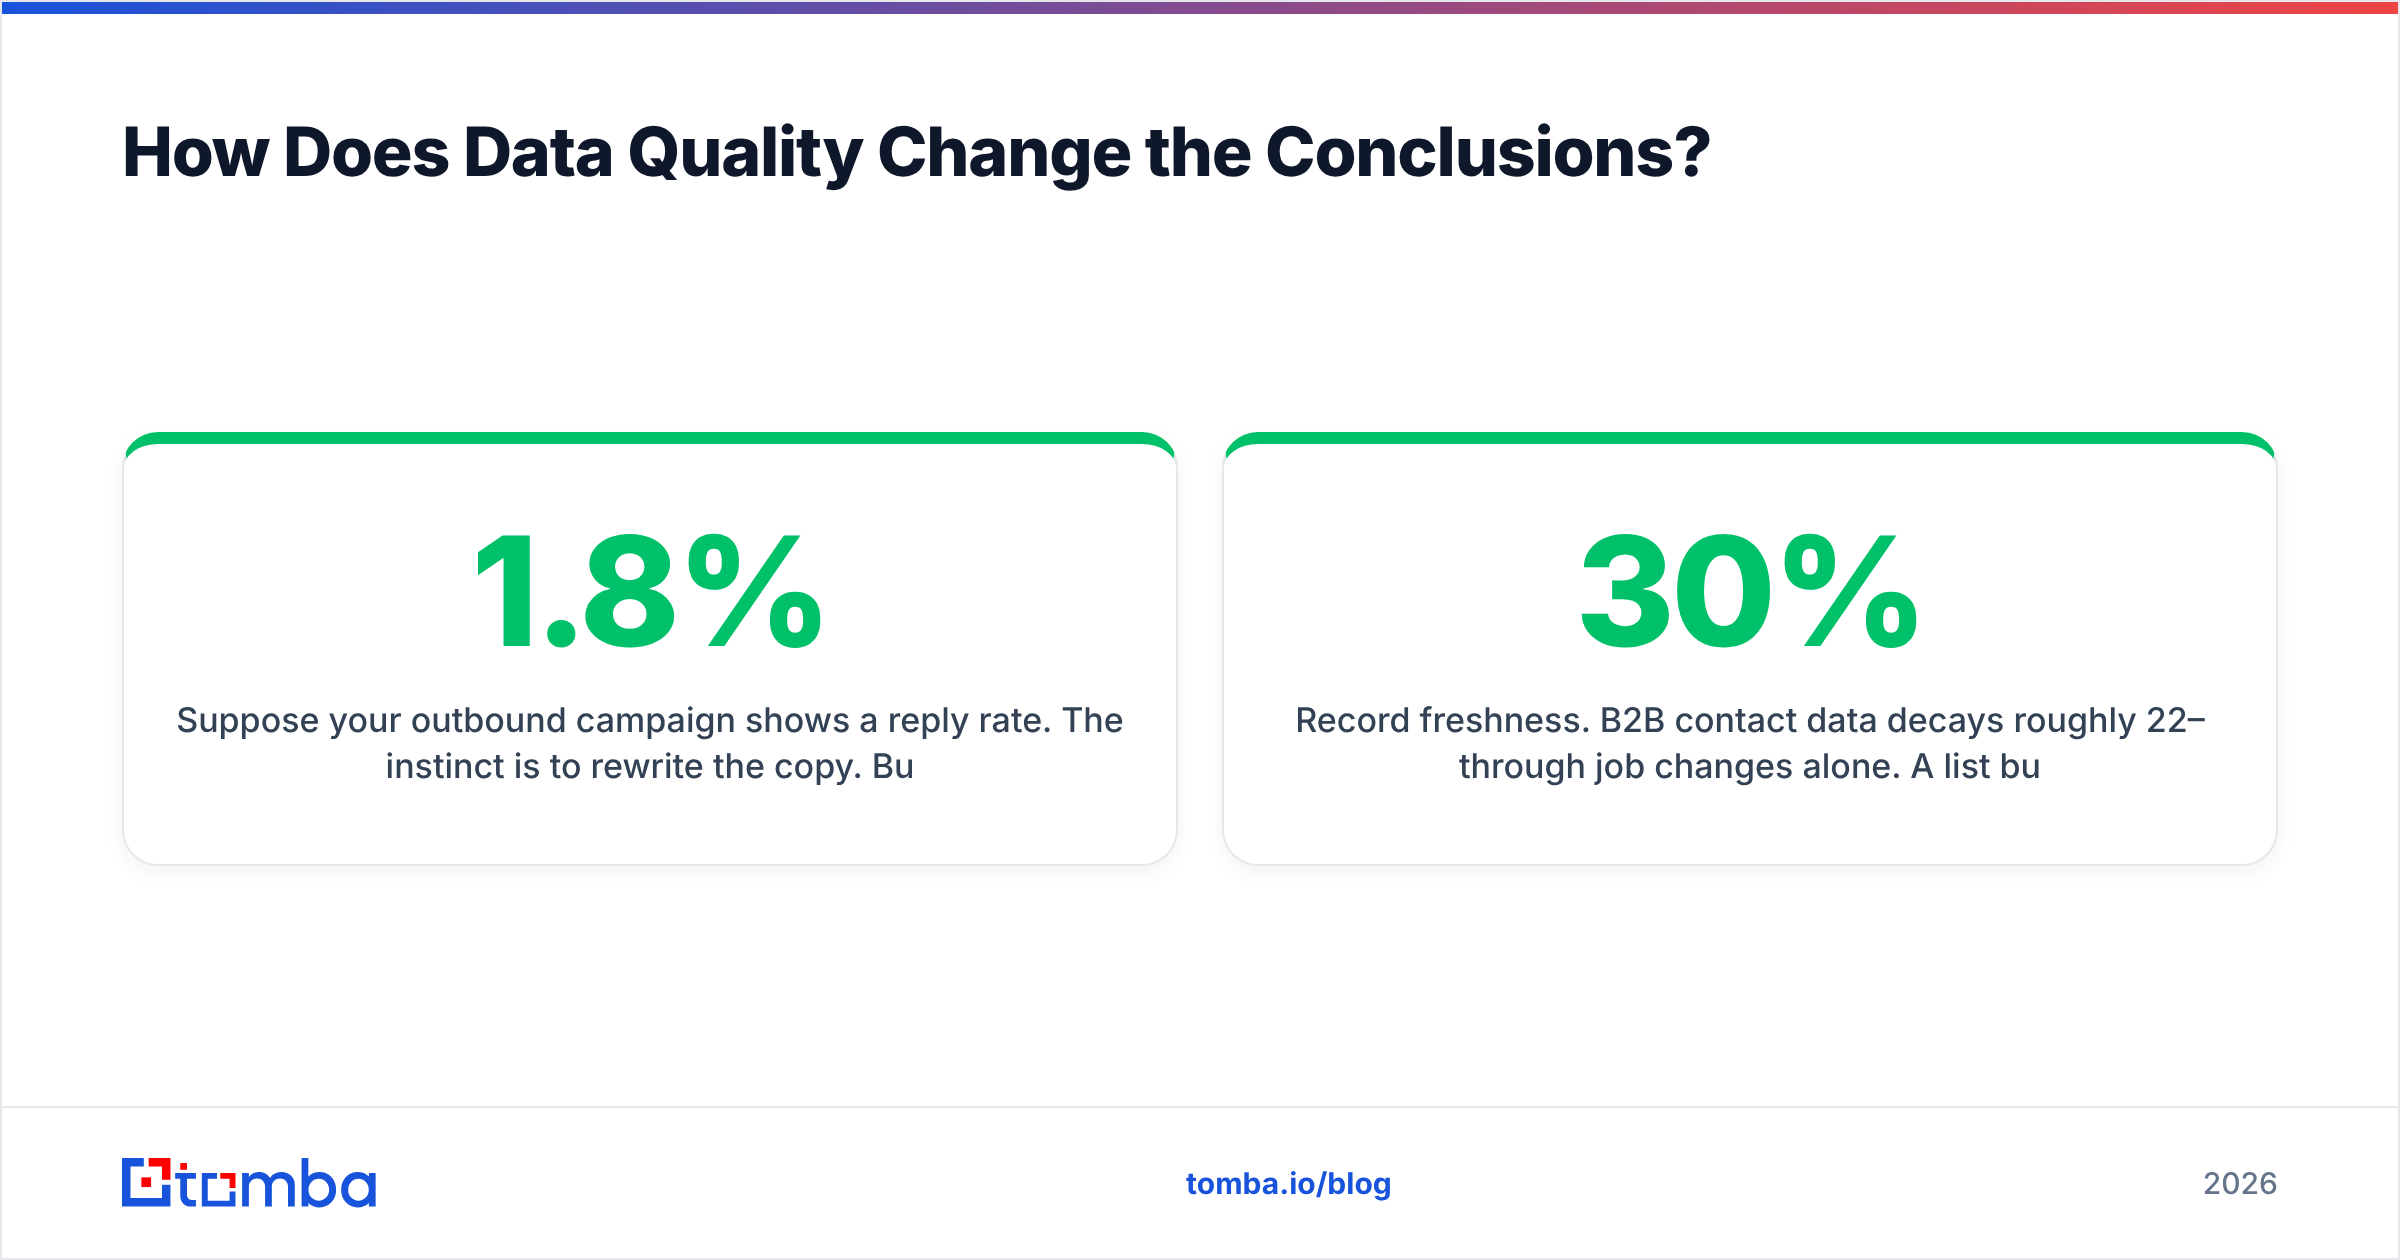
- Is the data trustworthy? If 30% of your contact records are stale, your conversion rates just measure bounces.

Why Do Most GTM Reviews Produce Nothing?#
Because they chase a tidy story instead of a clear decision. A review that ends with "we should focus on enterprise" is not an output. It is a mood.
Three patterns cause this.
The review is cut off from the system of record. Some numbers come from a spreadsheet built by hand. Then you cannot re-run them next quarter. A good go to market strategy analysis should rebuild itself from your CRM with a saved query set.
Segment samples are too small. Ten deals in a vertical is not a signal. Teams still call a segment "our best fit" on four deals. Widen the window to 8–12 months, or state the doubt out loud.
Nobody owns the follow-up. Gartner's research on commercial strategy keeps finding the same thing. Execution gaps, not strategy gaps, drive most B2B growth misses. The plan is fine. The weekly cadence around it is not. Give each finding an owner and a date, or the review is theater.
There is a fourth reason. The review stops at the funnel and never touches the data under it. Say your outbound team emails a scraped list. Only 60% of those addresses work. Now your reply-rate study measures deliverability, not copy. That is a plumbing problem in a strategy costume.
What Are the Five Layers of a GTM Analysis?#
Work the layers in order. Each one sets up the next. Skip ahead and your conclusions fall apart.
- Market and ICP layer — Who you can really win. Output: a segment table ranked by win rate, ACV, and cycle length. Build it from closed-won and closed-lost deals, not a market-sizing report.
- Offer and pricing layer — Does your packaging match how the ICP buys? Output: discount depth by segment, plus the top three objections that caused discounts.
- Channel and motion layer — Product-led, outbound, inbound, partner, or a mix. Output: CAC and payback per channel, with overhead counted honestly.
- Funnel economics layer — Conversion by stage, segment, and channel. Output: the biggest drop-off and a theory for why.
- Data layer — The contact and company data everything above runs on. Output: a measured accuracy rate and a set refresh schedule.
Layer five is the one teams cut for time. It is also the one that decides if layers one to four mean anything. Cannot state your contact-data accuracy as a number? Then you do not have a go to market strategy analysis. You have a GTM opinion.
How Do You Analyze Your ICP Against Real Data?#
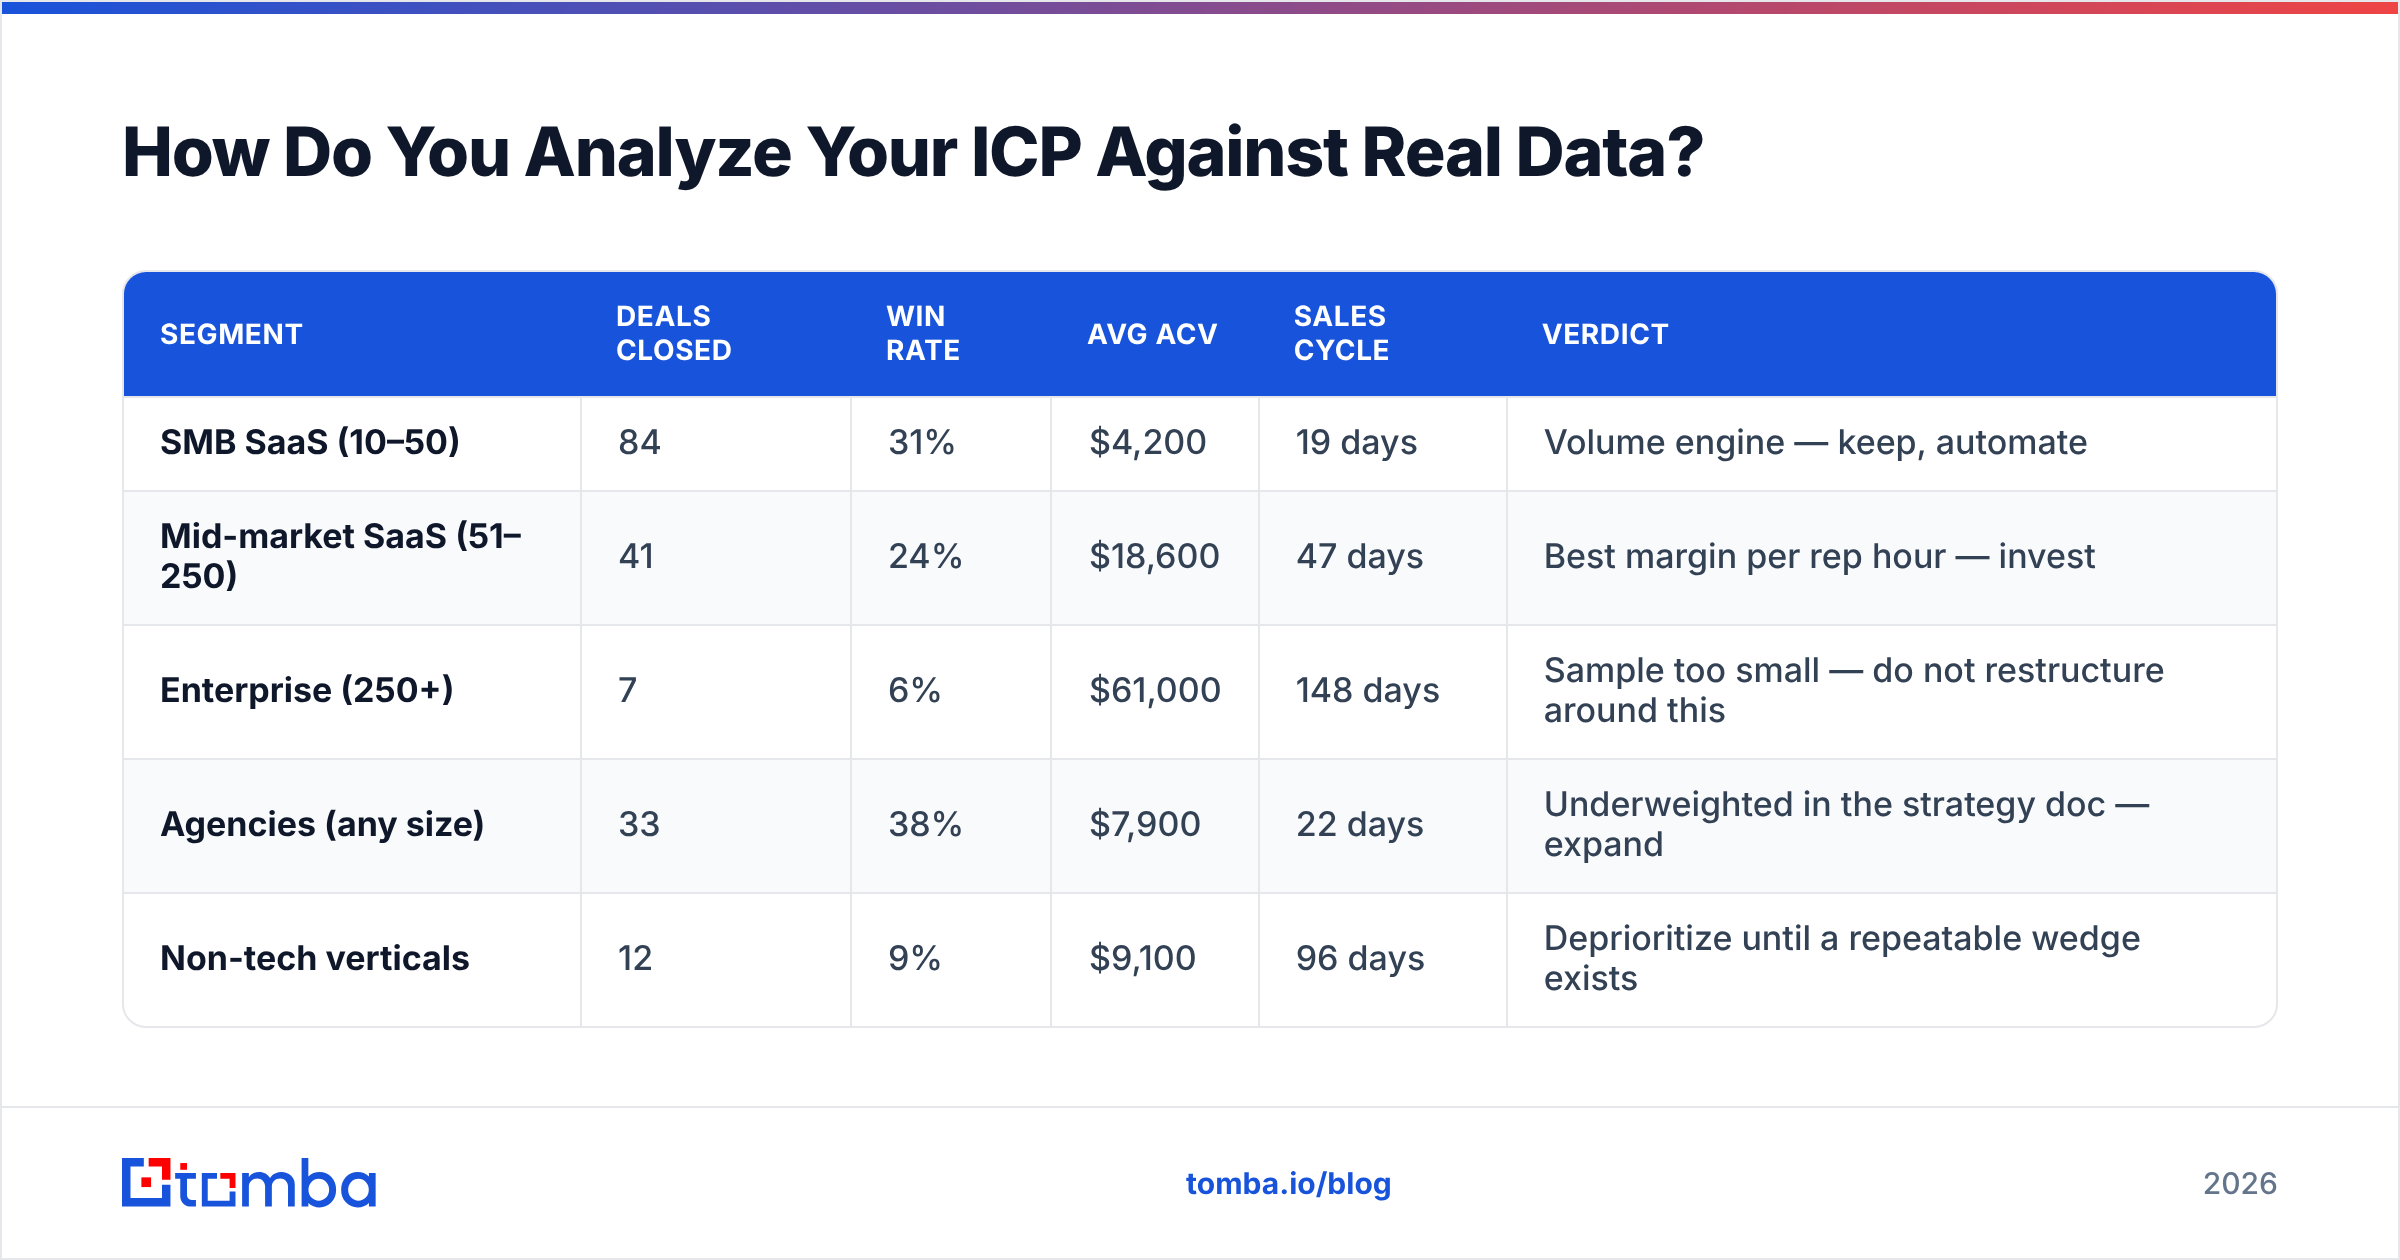
Start from revenue, not hope. Pull every closed-won deal from the last four quarters. Tag each on five things: headcount, industry, buyer title, channel, and time to close. Do the same for closed-lost.
The gap between those two tables is your real ICP. Not the one in the deck.
Here is what that looks like in practice.
| Segment | Deals closed | Win rate | Avg ACV | Sales cycle | Verdict |
|---|---|---|---|---|---|
| SMB SaaS (10–50) | 84 | 31% | $4,200 | 19 days | Volume engine — keep, automate |
| Mid-market SaaS (51–250) | 41 | 24% | $18,600 | 47 days | Best margin per rep hour — invest |
| Enterprise (250+) | 7 | 6% | $61,000 | 148 days | Sample too small — do not restructure around this |
| Agencies (any size) | 33 | 38% | $7,900 | 22 days | Underweighted in the strategy doc — expand |
| Non-tech verticals | 12 | 9% | $9,100 | 96 days | Deprioritize until a repeatable wedge exists |
Two findings jump out. First, agencies win most often and close fast. Yet they rarely show up in the strategy doc. That segment grew by accident. Second, leadership wants to bet the year on enterprise. The bet rests on seven deals. The table forces that talk.
Then comes sourcing. Can you reach the winning segment at volume? Most ICP work dies right here. You name agencies as the best fit. Then you learn your data vendor barely covers them. Test coverage before you add headcount. Run 200 target accounts through a domain search and count the verified, role-relevant contacts. A segment you cannot reach is not a segment.
Which Metrics Belong in the Analysis?#
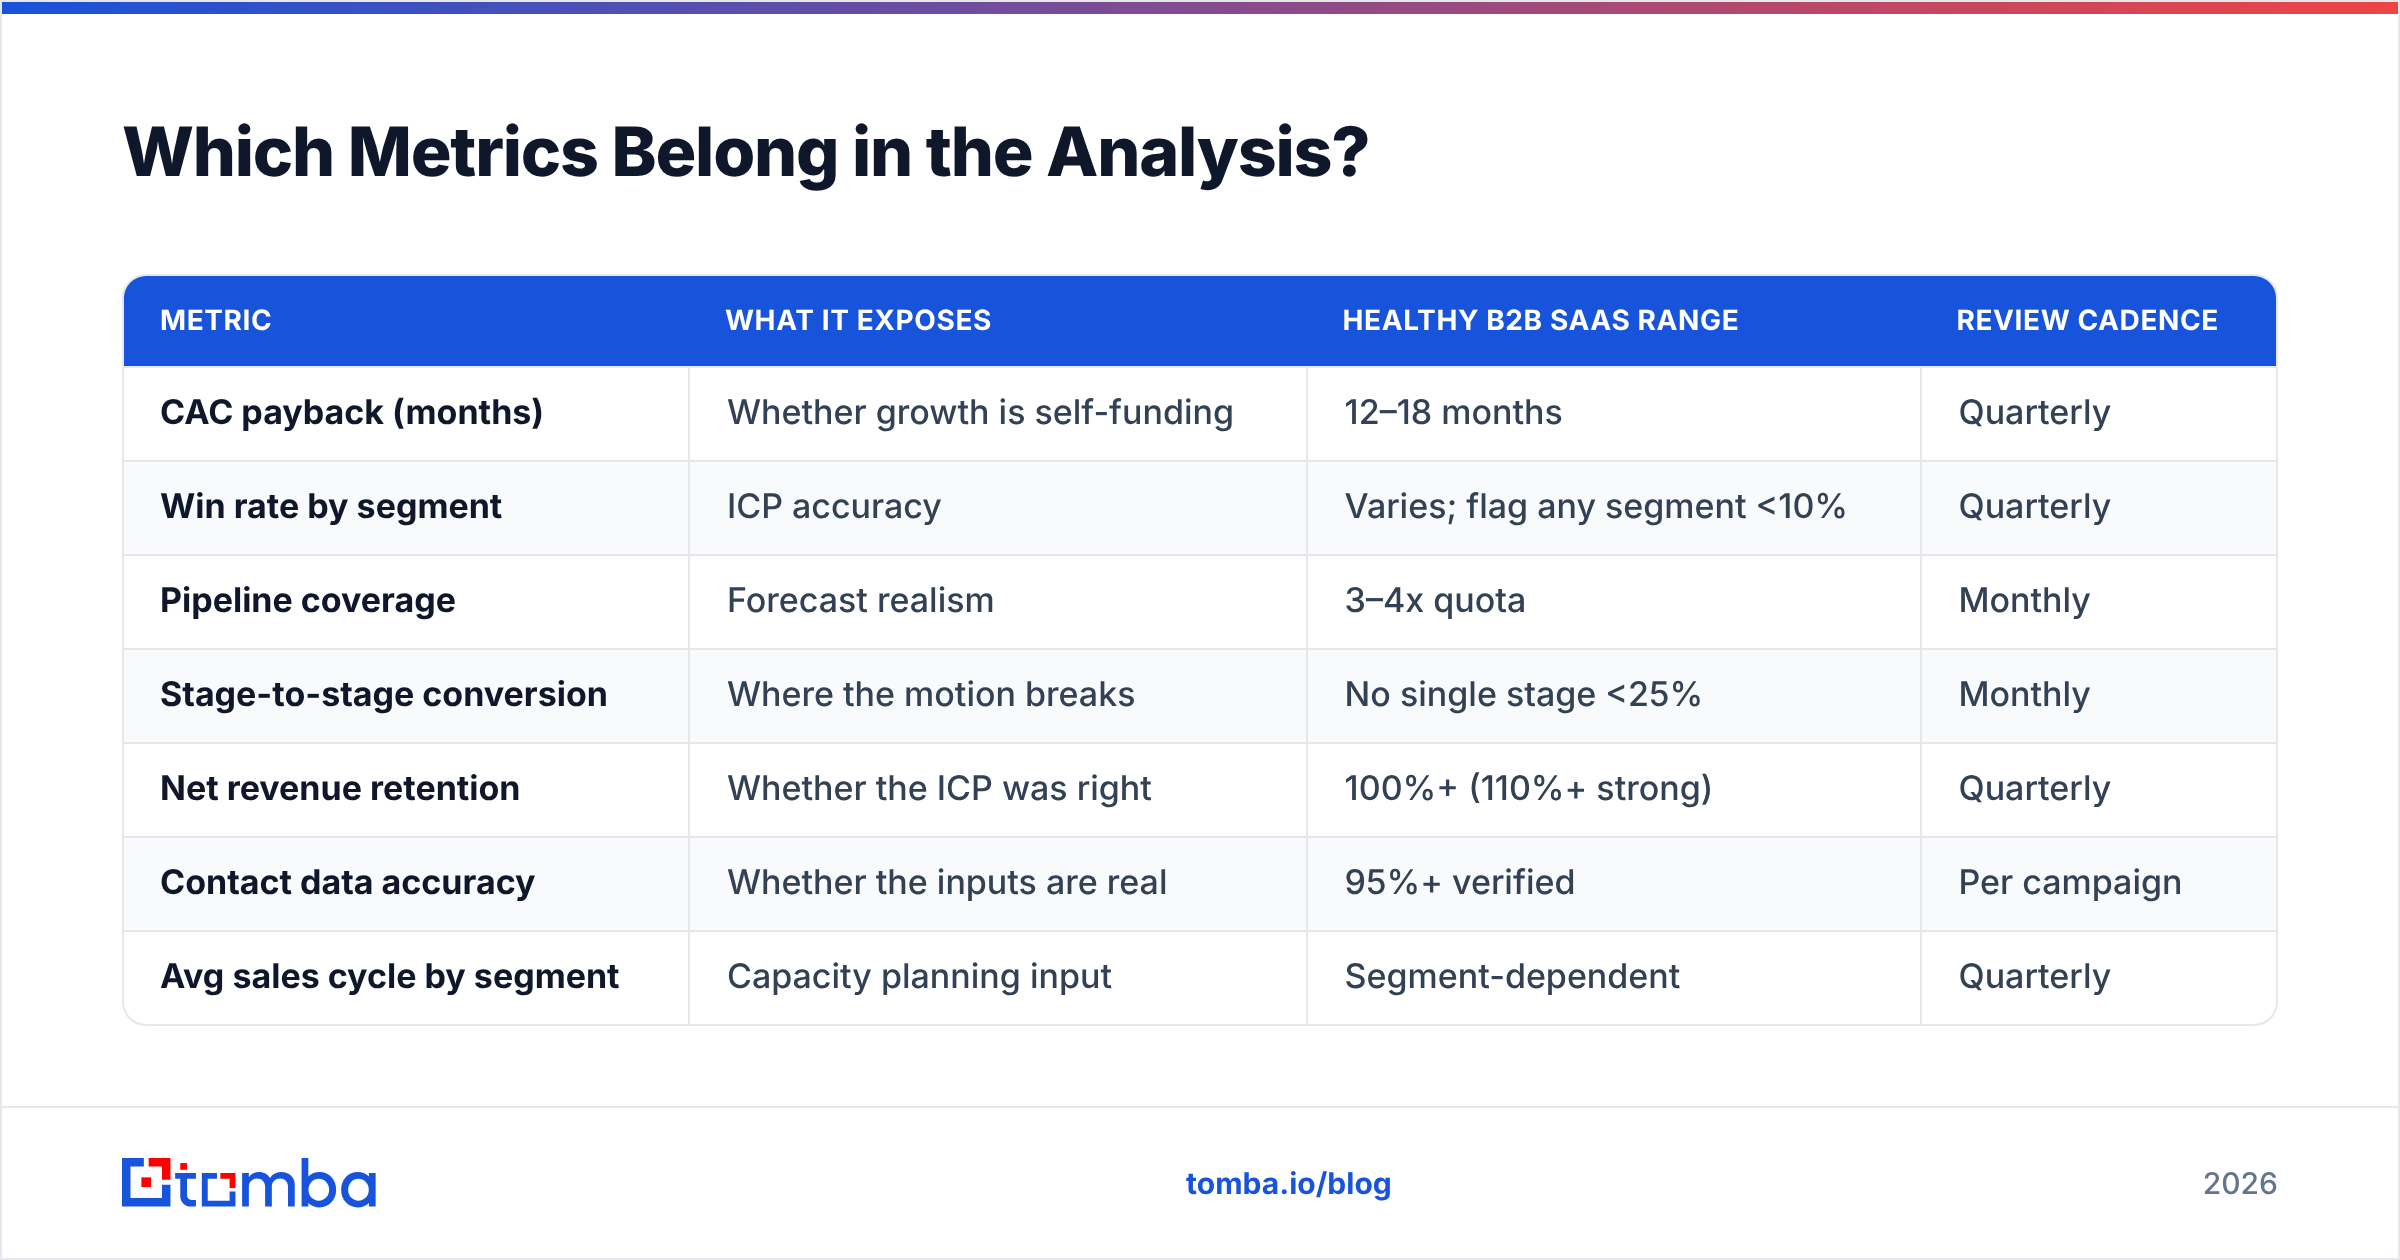
Fewer than you think. Forty metrics is a dashboard, not an analysis. These are the ones that change decisions.
| Metric | What it exposes | Healthy B2B SaaS range | Review cadence |
|---|---|---|---|
| CAC payback (months) | Whether growth is self-funding | 12–18 months | Quarterly |
| Win rate by segment | ICP accuracy | Varies; flag any segment <10% | Quarterly |
| Pipeline coverage | Forecast realism | 3–4x quota | Monthly |
| Stage-to-stage conversion | Where the motion breaks | No single stage <25% | Monthly |
| Net revenue retention | Whether the ICP was right | 100%+ (110%+ strong) | Quarterly |
| Contact data accuracy | Whether the inputs are real | 95%+ verified | Per campaign |
| Avg sales cycle by segment | Capacity planning input | Segment-dependent | Quarterly |
Net revenue retention deserves extra weight here. It is the honest verdict on targeting. You can win a segment and still be wrong about it. High signup plus high churn means you sold to the wrong people. HubSpot's yearly sales research keeps showing the same pattern. In mature B2B markets, keeping revenue beats adding logos. So NRR by segment is one of the sharpest cuts you can run.
The last row is the one nobody reports: contact data accuracy. Measure it. Take 500 random contacts from your outbound list. Run them through an email verifier. Record the share that come back valid. Under 90%? Then every metric above it is off by an unknown amount. Your reps are also burning hours on records that were never deliverable.
How Does Data Quality Change the Conclusions?#
A lot. And in a way that is easy to misread.
Say your outbound campaign gets a 1.8% reply rate. The instinct is to rewrite the copy. But 28% of the list bounced. Against contacts you can actually reach, the real rate is closer to 2.5%. The copy may be fine. You almost fixed the wrong layer.
It cuts both ways. Clean data can show that a "working" segment was carried by two lucky deals.
Three data checks belong in every go to market strategy analysis.
- Deliverability baseline. What share of your sends reach an inbox? Track bounce rate, spam complaints, and sender reputation on their own. They fail for different reasons and need different fixes.
- Record freshness. B2B contact data decays 22–30% a year from job changes alone. A list built 14 months ago is not the list you think you have.
- Coverage by segment. Vendor accuracy is not even. Coverage for 200-person US SaaS firms is usually strong. Coverage for 40-person European manufacturers often is not. Measure per segment first.
If you build lists at volume, verify in batches before launch. Waiting for bounce reports is too late. A bulk email finder that finds and verifies in one pass keeps the input layer clean with no extra step.
What Tools Support Each Layer?#
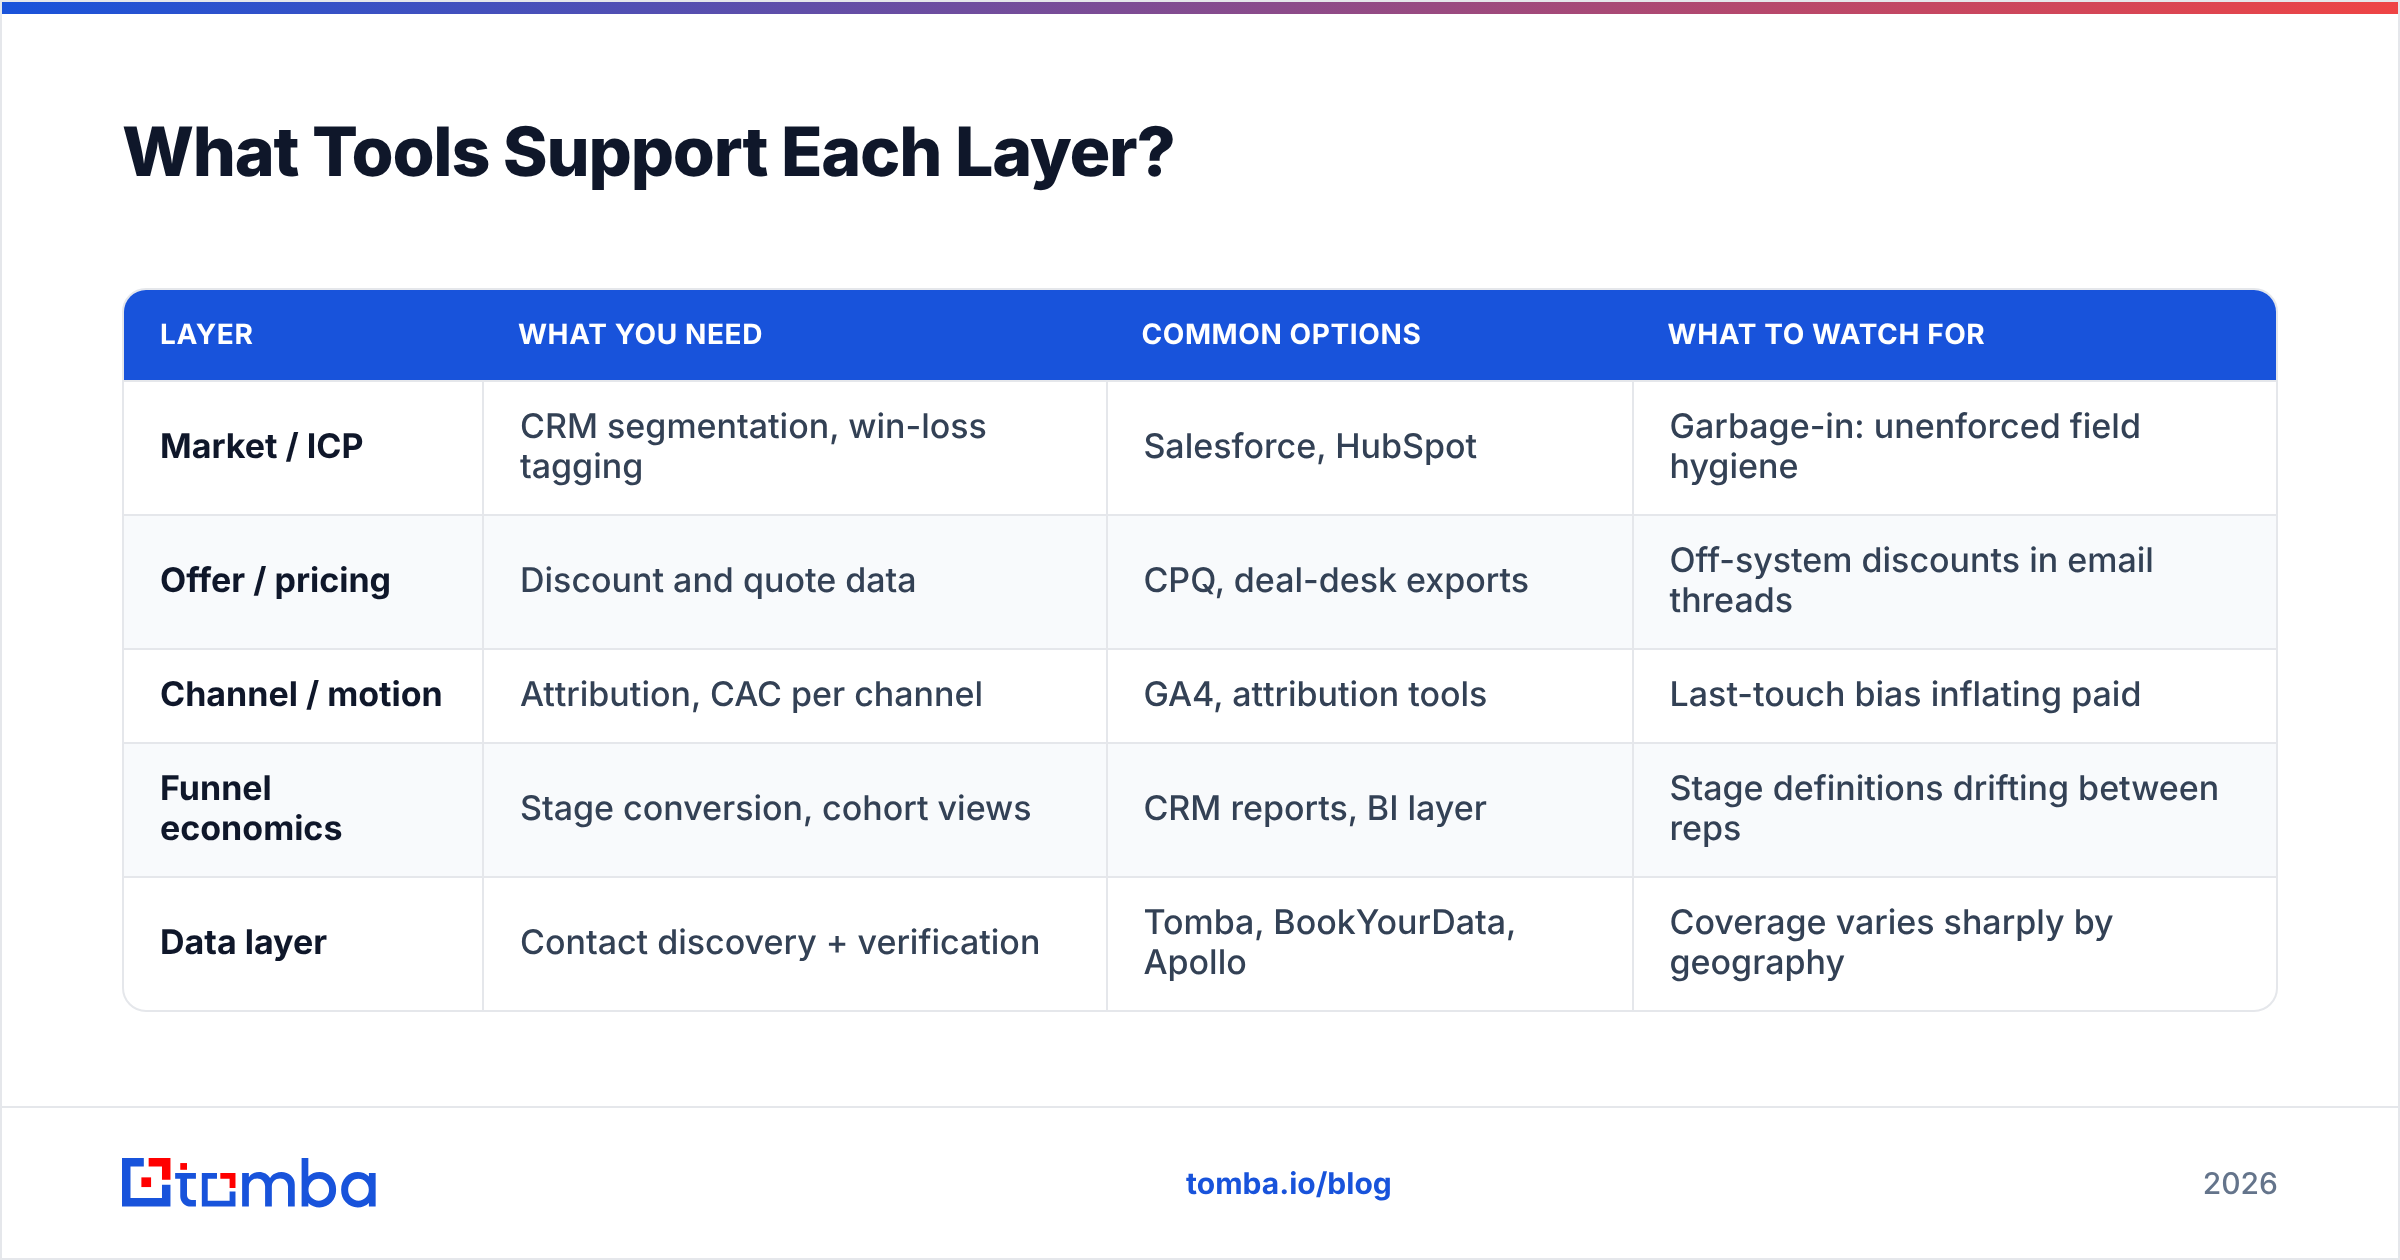
No single platform covers a full go to market strategy analysis. Vendors who claim otherwise are selling a dashboard. Map tools to layers instead.
| Layer | What you need | Common options | What to watch for |
|---|---|---|---|
| Market / ICP | CRM segmentation, win-loss tagging | Salesforce, HubSpot | Garbage-in: unenforced field hygiene |
| Offer / pricing | Discount and quote data | CPQ, deal-desk exports | Off-system discounts in email threads |
| Channel / motion | Attribution, CAC per channel | GA4, attribution tools | Last-touch bias inflating paid |
| Funnel economics | Stage conversion, cohort views | CRM reports, BI layer | Stage definitions drifting between reps |
| Data layer | Contact discovery + verification | Tomba, BookYourData, Apollo | Coverage varies sharply by geography |
The data layer has its own buying rules. You are not judging features. You are judging hit rate on your list. Run the same 200 accounts through each vendor. Compare how many verified contacts you get back. Published accuracy numbers are marketing. Your own sample is not.
Cost matters at volume. Tomba pricing starts free with 25 searches a month. Starter is $49/mo, Growth is $99/mo, and Pro is $249/mo. All paid plans include API access. That matters if you plan to wire enrichment into the CRM. BookYourData works differently, with pay-as-you-go credits and a large prebuilt database. That suits teams who buy lists now and then. Both are fine. The right one depends on whether your motion is campaign-based or always-on. User reviews on G2 help you sanity-check support and billing. They are less useful for accuracy claims.
How Often Should You Re-Run the Analysis?#
Quarterly for all five layers. Monthly for the funnel metrics. Per campaign for the data layer.
Annual reviews fail because markets move faster than the review. You present Q1 data in Q4. By then three of your five conclusions have expired. Quarterly catches drift without eating the year.
Freeze your metric definitions between runs. Silent drift is the quiet killer. Someone redefines "qualified opportunity" in Q2. Now the year-over-year view means nothing. Write the definitions down. Version them. Flag any change in the report.
Run each quarter the same way:
- Refresh the data — pull the standard queries, verify a contact sample, note the accuracy rate.
- Rebuild the segment table — same five tags, same window length.
- Flag the deltas — what moved more than 15% since last quarter, and why.
- Name three decisions — not fifteen findings. Three things the team will do differently, each with an owner.
- Set the review date — check those three decisions before the next full run.
Forcing exactly three decisions is what makes the work stick. Fifteen findings dilute. Three decisions get done.
What Does a Good Analysis Actually Change?#
Real moves, not new wording. A strong go to market strategy analysis produces changes like these. Two SDRs shift from enterprise to agencies. A paid channel with a 31-month payback gets cut. Qualification rules get rewritten, because disqualified accounts converted better than qualified ones. A data vendor gets replaced after covering only 41% of your best segment.
Does your review end with new positioning and no budget shift? Then it found nothing. Strategy work that costs nothing to act on was not strategy work.
The best output is often a negative one. It is the segment you were about to fund, that the data says to skip. Those calls pay for the whole exercise.
Where Should You Start?#
Start at layer five and work up. That feels backwards. Everyone wants to start with market size. But if the account and contact data is shaky, every number above it inherits the error. You will spend a quarter arguing about noise.
Pull 200 target accounts from your best segment. Count how many give you verified, role-relevant contacts. Below 70%? Then sourcing is your limit, not your positioning. Fix that first. Then run the funnel work on data you trust.
For sourcing, the Tomba Email Finder is built for this test. Search by domain, name, or company. Get verified work addresses back. Measure your real coverage per segment before you spend on a market you cannot reach. Use the free tier's 25 searches to run the sample. Scale once the numbers show which segment earns the headcount.
Related guides#
Ready to find emails that actually work?
Join 150,000+ professionals who stopped guessing and started sending. Free credits on signup — no credit card required.
Get the Tomba newsletter
Practical outbound tactics and product updates — once every two weeks.
About the author