Go To Market Strategy Definition: A 2026 Framework for B2B Teams
A go-to-market strategy is the operational plan that connects a specific segment to a specific motion. Here is the definition, the seven components, and the numbers that tell you it is working.

TL;DR
- A go-to-market strategy is a documented plan that connects one specific customer segment to one specific way of reaching, selling to, and retaining them. It is not a marketing plan, and it is not a business plan.
- Seven components make it operational: ICP, problem/value proposition, offer and pricing, sales motion, channels, message, and success metrics. Miss any one and the strategy stays a slide deck.
- The motion choice — product-led, sales-led, or partner-led — is dictated by deal size and buying-committee complexity, not by fashion.
- Most GTM plans fail at the data layer. Perfect positioning against a contact list with 30% bounce rates still produces zero pipeline.
- Review your GTM quarterly against four numbers: CAC payback, win rate by segment, pipeline coverage, and net revenue retention.
What Is the Go To Market Strategy Definition?#
A go-to-market (GTM) strategy is a documented plan that defines who you sell to, what you sell them, how you reach them, and how you know it worked. It converts an abstract commercial ambition ("grow enterprise revenue 40%") into a repeatable operating motion that marketing, sales, and customer success execute against the same targets.
The precise version most operators use: a GTM strategy is the alignment of a specific customer segment, a specific value proposition, and a specific distribution motion, measured by a specific set of unit economics.
Three things it is not:
- Not a marketing plan. A marketing plan covers demand generation tactics. GTM covers the entire commercial route to revenue, including pricing, sales process, and post-sale expansion.
- Not a business plan. A business plan describes the company. A GTM strategy describes one route to one market. A company with three products in two regions may run five distinct GTM strategies.
- Not a product launch checklist. Launches are events. GTM is the durable system that keeps working after launch week.
The scope distinction matters because it determines who owns the document. Product launches are owned by product marketing. GTM strategy is owned by the revenue operations function, or in smaller companies, the founder. When nobody owns it, each team invents its own definition of the target customer and the plan quietly fragments.
What Are the Seven Components of a Go To Market Strategy?#
Every workable GTM document answers the same seven questions. Skip one and you have a positioning statement, not a strategy.
- Ideal Customer Profile (ICP). The firmographic, technographic, and behavioural boundaries of who you sell to. Not "mid-market SaaS" but "Series B–D B2B SaaS companies, 80–400 employees, running HubSpot or Salesforce, with a named RevOps hire." Specific enough that a rep can disqualify in ten seconds.
- Problem and value proposition. The expensive, recurring, and urgent problem you remove. If the buyer would not put a budget line against it this quarter, you are describing a nice-to-have.
- Offer and pricing model. Packaging, tiers, contract length, and the expansion path. Pricing is a GTM decision, not a finance decision — per-seat pricing pushes you toward sales-led motions, usage pricing pushes you toward product-led.
- Sales motion. Self-serve, inside sales, field sales, or partner-led. Determined mainly by average contract value and the size of the buying committee.
- Channels. Where the ICP actually spends attention: outbound email, paid search, communities, events, marketplaces, integration partners. Two channels executed well beat six executed thinly.
- Message and content system. The narrative, proof points, objection handling, and the assets each stage of the funnel requires.
- Success metrics and review cadence. Leading indicators (meetings booked, activation rate) and lagging indicators (CAC payback, win rate, NRR), with a fixed review rhythm.
Component four is where most teams stall, because the honest answer often contradicts what the team wants to build.
Which Go To Market Motion Fits Your Deal Size?#
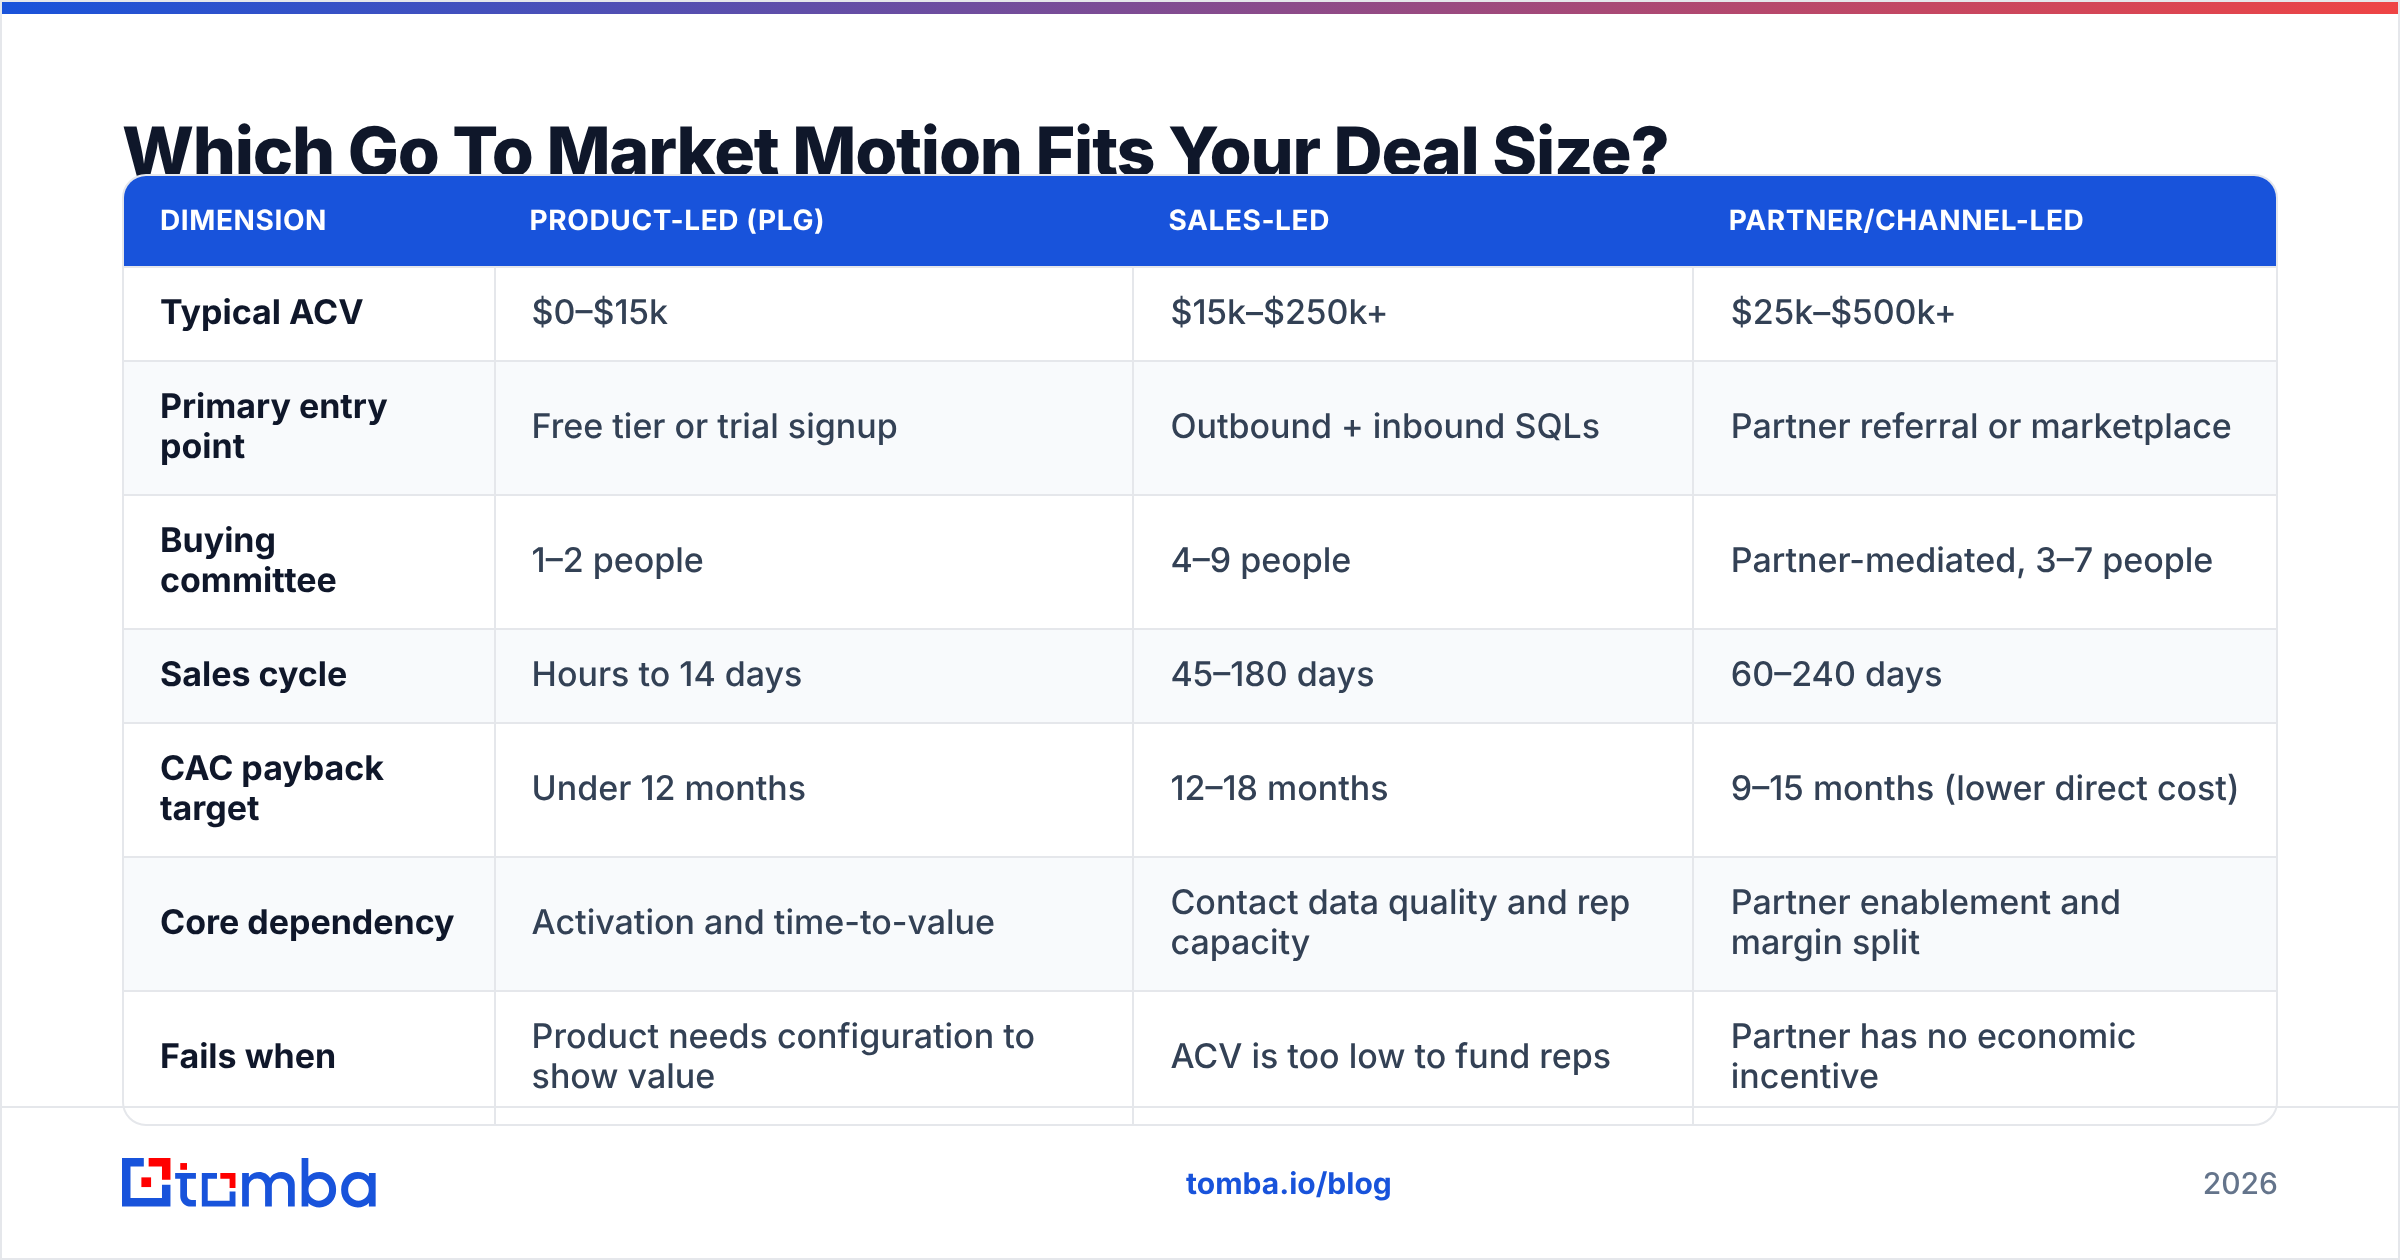
The motion is a math problem before it is a strategy problem. If your average contract value cannot fund the cost of the humans in the sale, the motion is wrong regardless of how good the positioning is.
| Dimension | Product-Led (PLG) | Sales-Led | Partner/Channel-Led |
|---|---|---|---|
| Typical ACV | $0–$15k | $15k–$250k+ | $25k–$500k+ |
| Primary entry point | Free tier or trial signup | Outbound + inbound SQLs | Partner referral or marketplace |
| Buying committee | 1–2 people | 4–9 people | Partner-mediated, 3–7 people |
| Sales cycle | Hours to 14 days | 45–180 days | 60–240 days |
| CAC payback target | Under 12 months | 12–18 months | 9–15 months (lower direct cost) |
| Core dependency | Activation and time-to-value | Contact data quality and rep capacity | Partner enablement and margin split |
| Fails when | Product needs configuration to show value | ACV is too low to fund reps | Partner has no economic incentive |
| Main leading metric | Activation rate | Meetings booked per rep per week | Partner-sourced pipeline |
Read this table as a set of constraints, not a menu. A $6k ACV product with a nine-person buying committee is a business model problem — no GTM strategy fixes it. Either raise the ACV or collapse the committee by targeting a smaller unit of the organisation.
Hybrid motions are normal at scale. The common pattern: PLG acquires the workspace, sales expands it once seat count or usage crosses a threshold. That threshold has to be a written trigger in your CRM, not a rep's intuition.
How Do You Define an ICP That Sales Will Actually Use?#
Build the ICP from closed-won data, not from aspiration. Pull your last 40–60 closed deals and split them into three buckets: fast wins, slow wins, and churned accounts. Then look for the attributes that separate bucket one from bucket three.
The attributes that usually matter:
- Firmographic — employee count, revenue band, industry, geography, funding stage.
- Technographic — the tools already in the stack that make you either necessary or redundant.
- Trigger events — a new hire in the buying role, a funding round, a compliance deadline, a competitor renewal date.
- Buying-role structure — who signs, who evaluates, who blocks. If your champion cannot access the signer, cycles stretch.
Then do the harder half: write the anti-ICP. List the segments you will decline. Teams that only document who they want to sell to end up chasing every inbound lead, and the strategy dissolves inside a quarter.
Once the ICP exists as criteria, it has to become a list. This is the step where most GTM documents die — the segment is defined beautifully and nobody can produce 800 matching contacts with verified email addresses. A domain search across your target account list, followed by email verification before anything enters a sequence, converts the ICP definition into an addressable list. Bounce rate above 5% will damage sender reputation fast enough to undo a quarter of outbound work.
How Is a GTM Strategy Different From a Marketing Plan?#
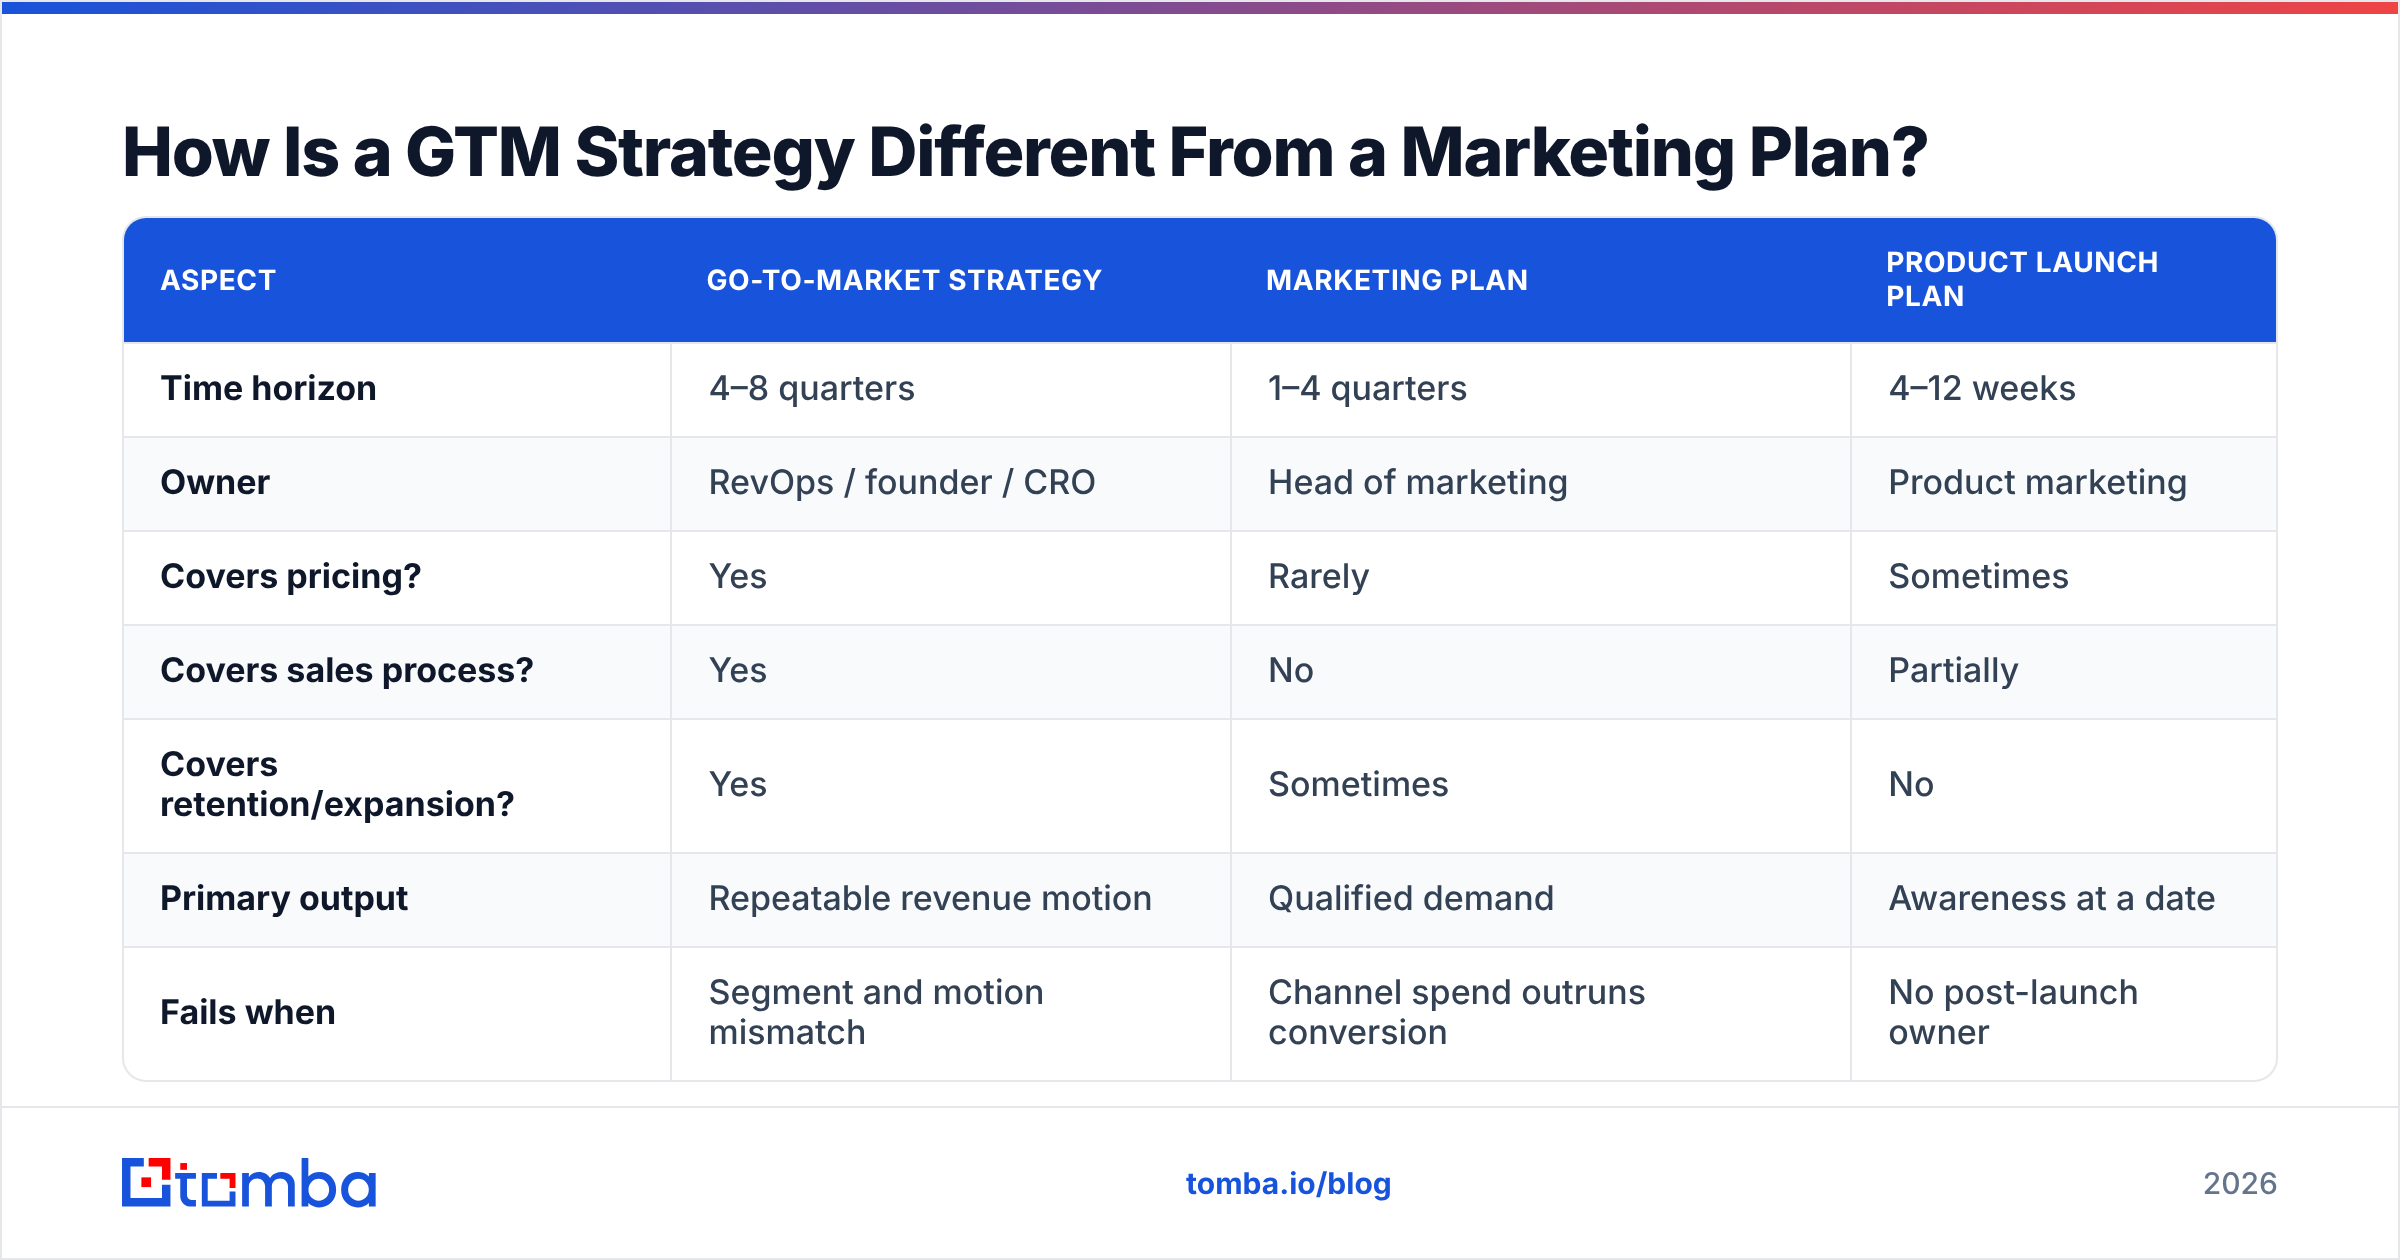
The two documents overlap on channels and messaging and diverge on everything else. Confusing them is the most common structural error in early-stage companies, because it leaves pricing, sales process, and retention unowned.
| Aspect | Go-To-Market Strategy | Marketing Plan | Product Launch Plan |
|---|---|---|---|
| Time horizon | 4–8 quarters | 1–4 quarters | 4–12 weeks |
| Owner | RevOps / founder / CRO | Head of marketing | Product marketing |
| Covers pricing? | Yes | Rarely | Sometimes |
| Covers sales process? | Yes | No | Partially |
| Covers retention/expansion? | Yes | Sometimes | No |
| Primary output | Repeatable revenue motion | Qualified demand | Awareness at a date |
| Fails when | Segment and motion mismatch | Channel spend outruns conversion | No post-launch owner |
The practical test: if your document says nothing about how a customer renews or expands, it is a marketing plan. GTM covers the full revenue lifecycle because acquisition economics only make sense against retention. A 14-month CAC payback is fine at 115% net revenue retention and fatal at 80%.
For a broader view of how GTM sits inside the wider revenue function, Gartner's sales and revenue research and HubSpot's go-to-market resources both track how the ownership boundary has shifted toward RevOps since 2023.
What Does a GTM Strategy Look Like in Practice?#
Here is the sequence a mid-market B2B software team would run over one quarter, compressed.
Weeks 1–2: Segment analysis. Export closed-won and churned accounts. Identify the two segments with the highest win rate and lowest churn. Write the ICP and the anti-ICP. Get sales leadership to sign off in writing.
Weeks 3–4: Message and offer. Draft the value proposition per segment. Rebuild pricing packaging if the current tiers force the wrong motion. Write objection-handling docs for the three objections that appear in every lost-deal note.
Weeks 5–6: List and data layer. Build the target account list against the ICP criteria. Enrich contacts for the buying committee — not just the champion. Verify every address before it enters a sequence. Route the whole thing into the CRM with segment tags so reporting works later. A bulk email finder run against the account list is the fastest path from "we know our ICP" to "we have 1,200 verified contacts in it."
Weeks 7–10: Channel execution. Launch two channels, not six. Outbound sequences to the named list plus one demand channel the ICP already uses. Hold the message constant for at least three weeks so you can read the results.
Weeks 11–13: Review. Compare actual against forecast on four metrics. Kill what underperformed by more than 40%. Double the budget on anything beating plan.

The reason the data step sits in the middle rather than the end: sequencing it last means the team spends weeks polishing a narrative that never reaches a real inbox. G2's category data on sales intelligence tools consistently shows data accuracy as the top-cited reason teams switch vendors — because the failure shows up as a pipeline shortfall two months later, long after the strategy was blamed.
Which Metrics Prove a Go To Market Strategy Is Working?#
Four numbers, reviewed monthly, tell you whether to persist or pivot. Everything else is diagnostic detail underneath them.
- CAC payback period. Fully loaded acquisition cost divided by gross-margin-adjusted monthly revenue per new customer. Under 12 months for PLG, under 18 for sales-led. Rising payback with flat win rates usually means channel saturation.
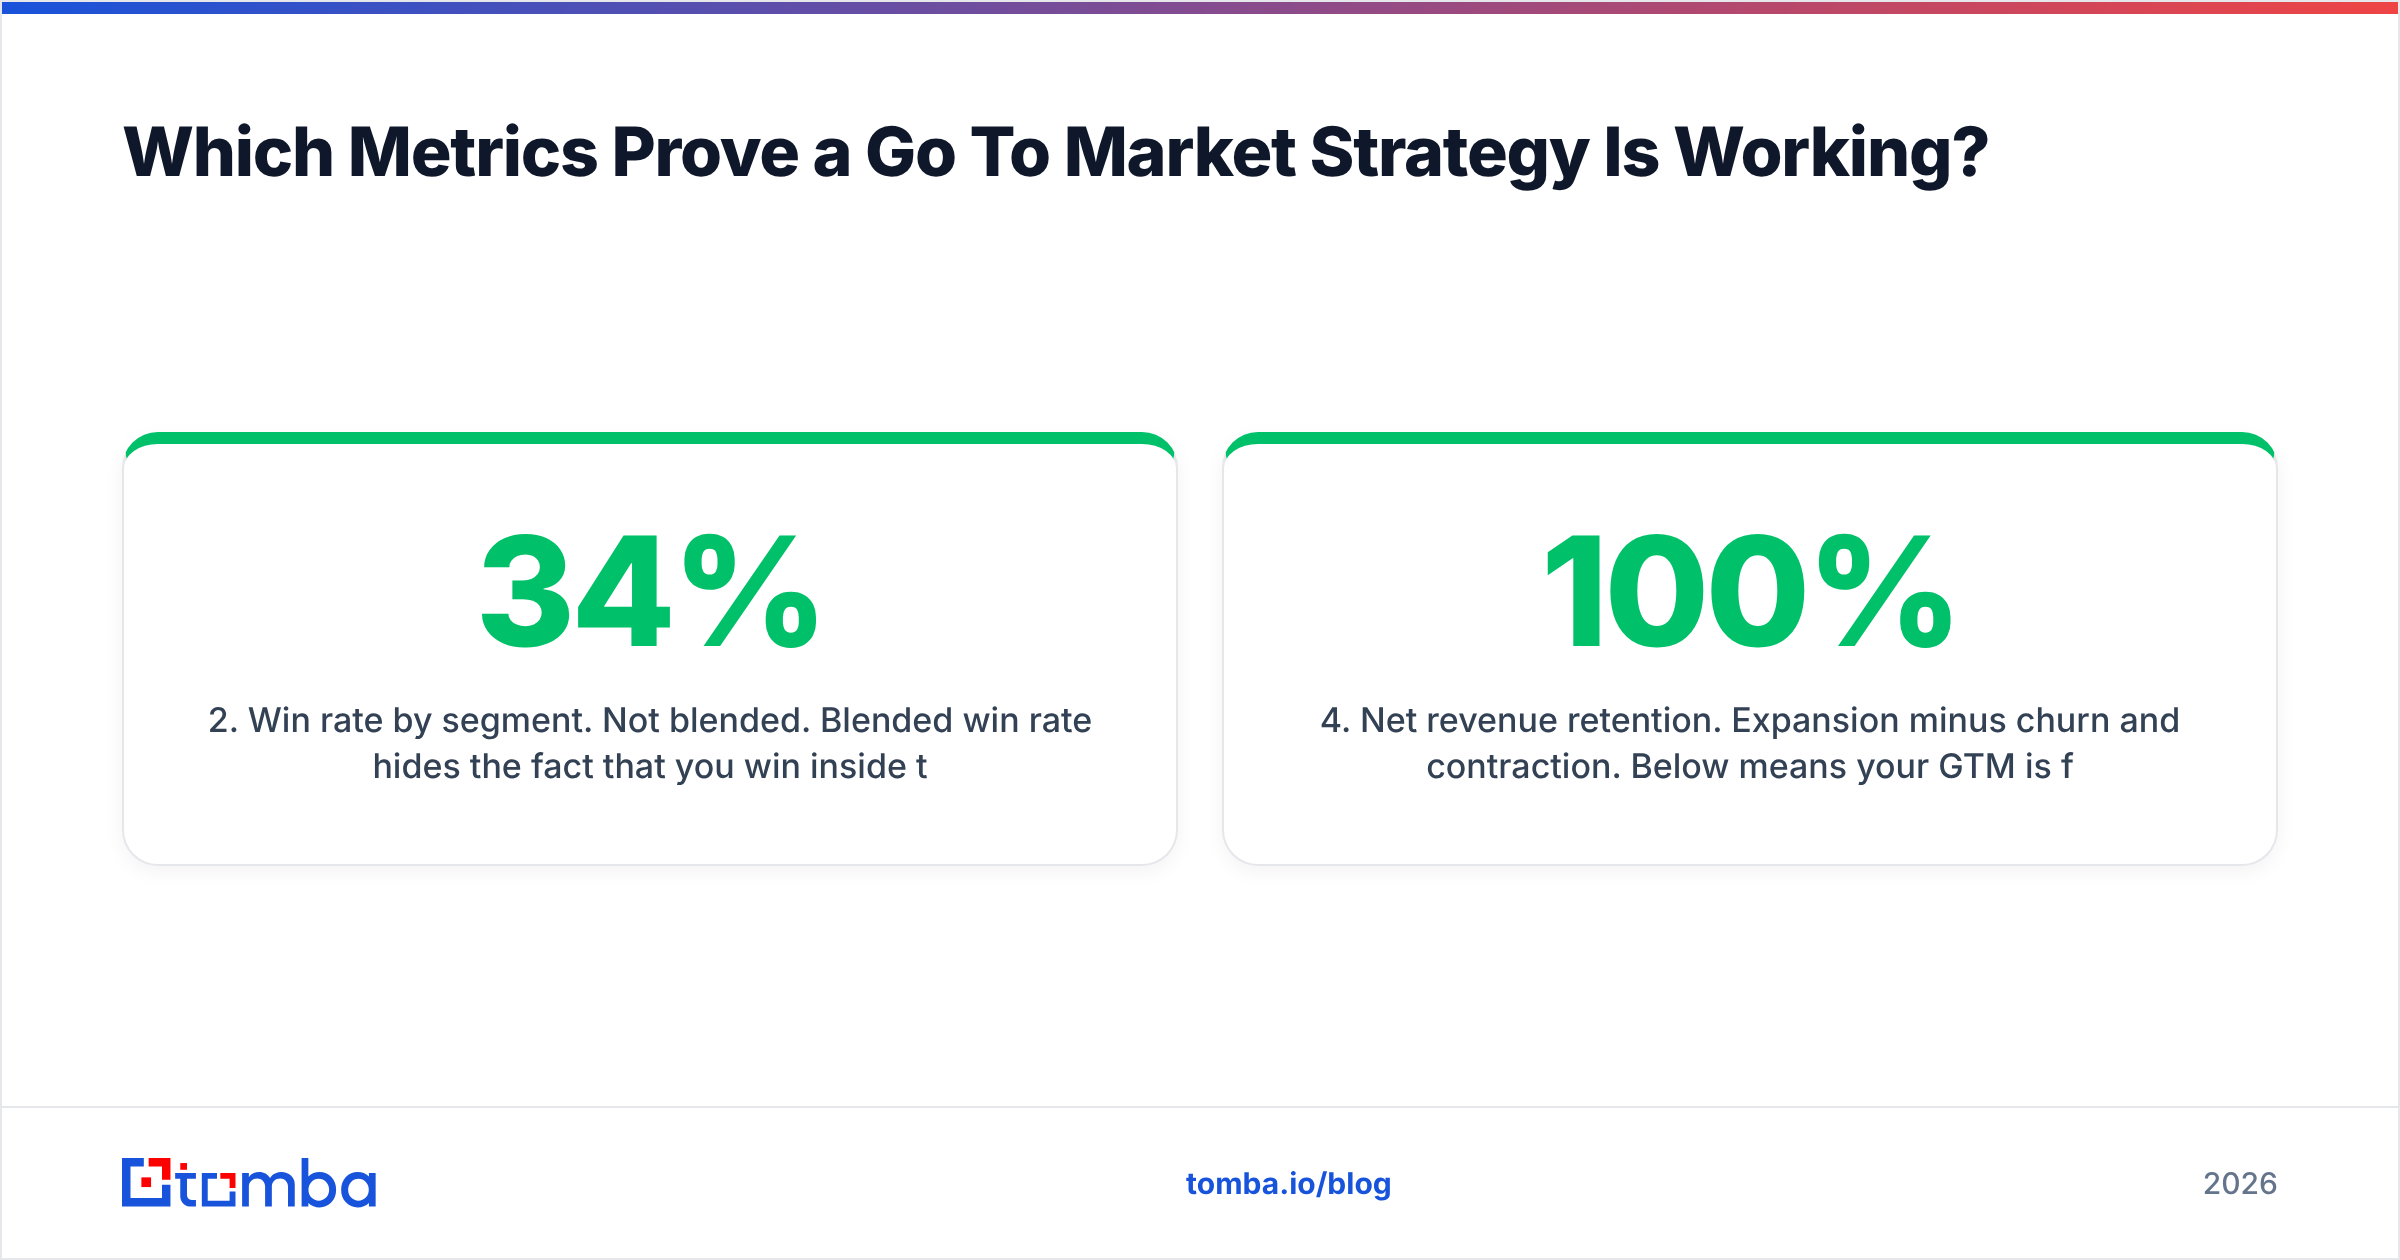
- Win rate by segment. Not blended. Blended win rate hides the fact that you win 34% inside the ICP and 6% outside it — which is the single most actionable number in the whole document.
- Pipeline coverage. Open pipeline divided by the quarter's target. Below 3x for a sales-led motion means the problem is at the top of the funnel, not in closing.
- Net revenue retention. Expansion minus churn and contraction. Below 100% means your GTM is filling a leaking bucket, and no acquisition improvement will outrun it.
Two supporting diagnostics worth tracking weekly: response rate on outbound (tells you whether the message matches the segment) and bounce rate (tells you whether your data layer is intact). A response rate collapse with a stable bounce rate is a messaging problem. Both moving together is a data problem, and no rewrite will fix it.
Set the review cadence before you need it. Monthly on the four core metrics, quarterly on the strategy document itself, annually on the segment choice. Strategies that get reviewed only when results are bad get abandoned instead of corrected.
What Are the Most Common GTM Mistakes?#
- Segment too broad. "SMBs in North America" is not a segment. It produces generic messaging that converts on nobody.
- Motion mismatched to ACV. Hiring AEs for a $4k product, or expecting self-serve to close a $180k deal with security review.
- No anti-ICP. Reps chase every lead, the data gets noisy, and win rate by segment becomes unreadable.
- Data layer treated as procurement. Contact data is a GTM dependency, not an office supply. Stale or unverified data caps every downstream metric.
- Channel sprawl. Six channels at 20% effort each produce no readable signal on any of them.
- No written review cadence. Without a fixed date, the strategy is reviewed only in a crisis, which is when the worst decisions get made.
The recoverable ones are the segment and the motion. The one that quietly compounds is the data layer, because it degrades continuously — B2B contact data decays roughly 22–30% per year through job changes alone, so a list built in Q1 is materially worse by Q4 even if nothing else changed.
Where Should You Start?#
Start with the closed-won analysis. It takes two days, requires no new tooling, and it usually contradicts at least one assumption the leadership team holds about who the customer is. From there, write the seven components in a single document — no longer than four pages — and make one named person accountable for it.
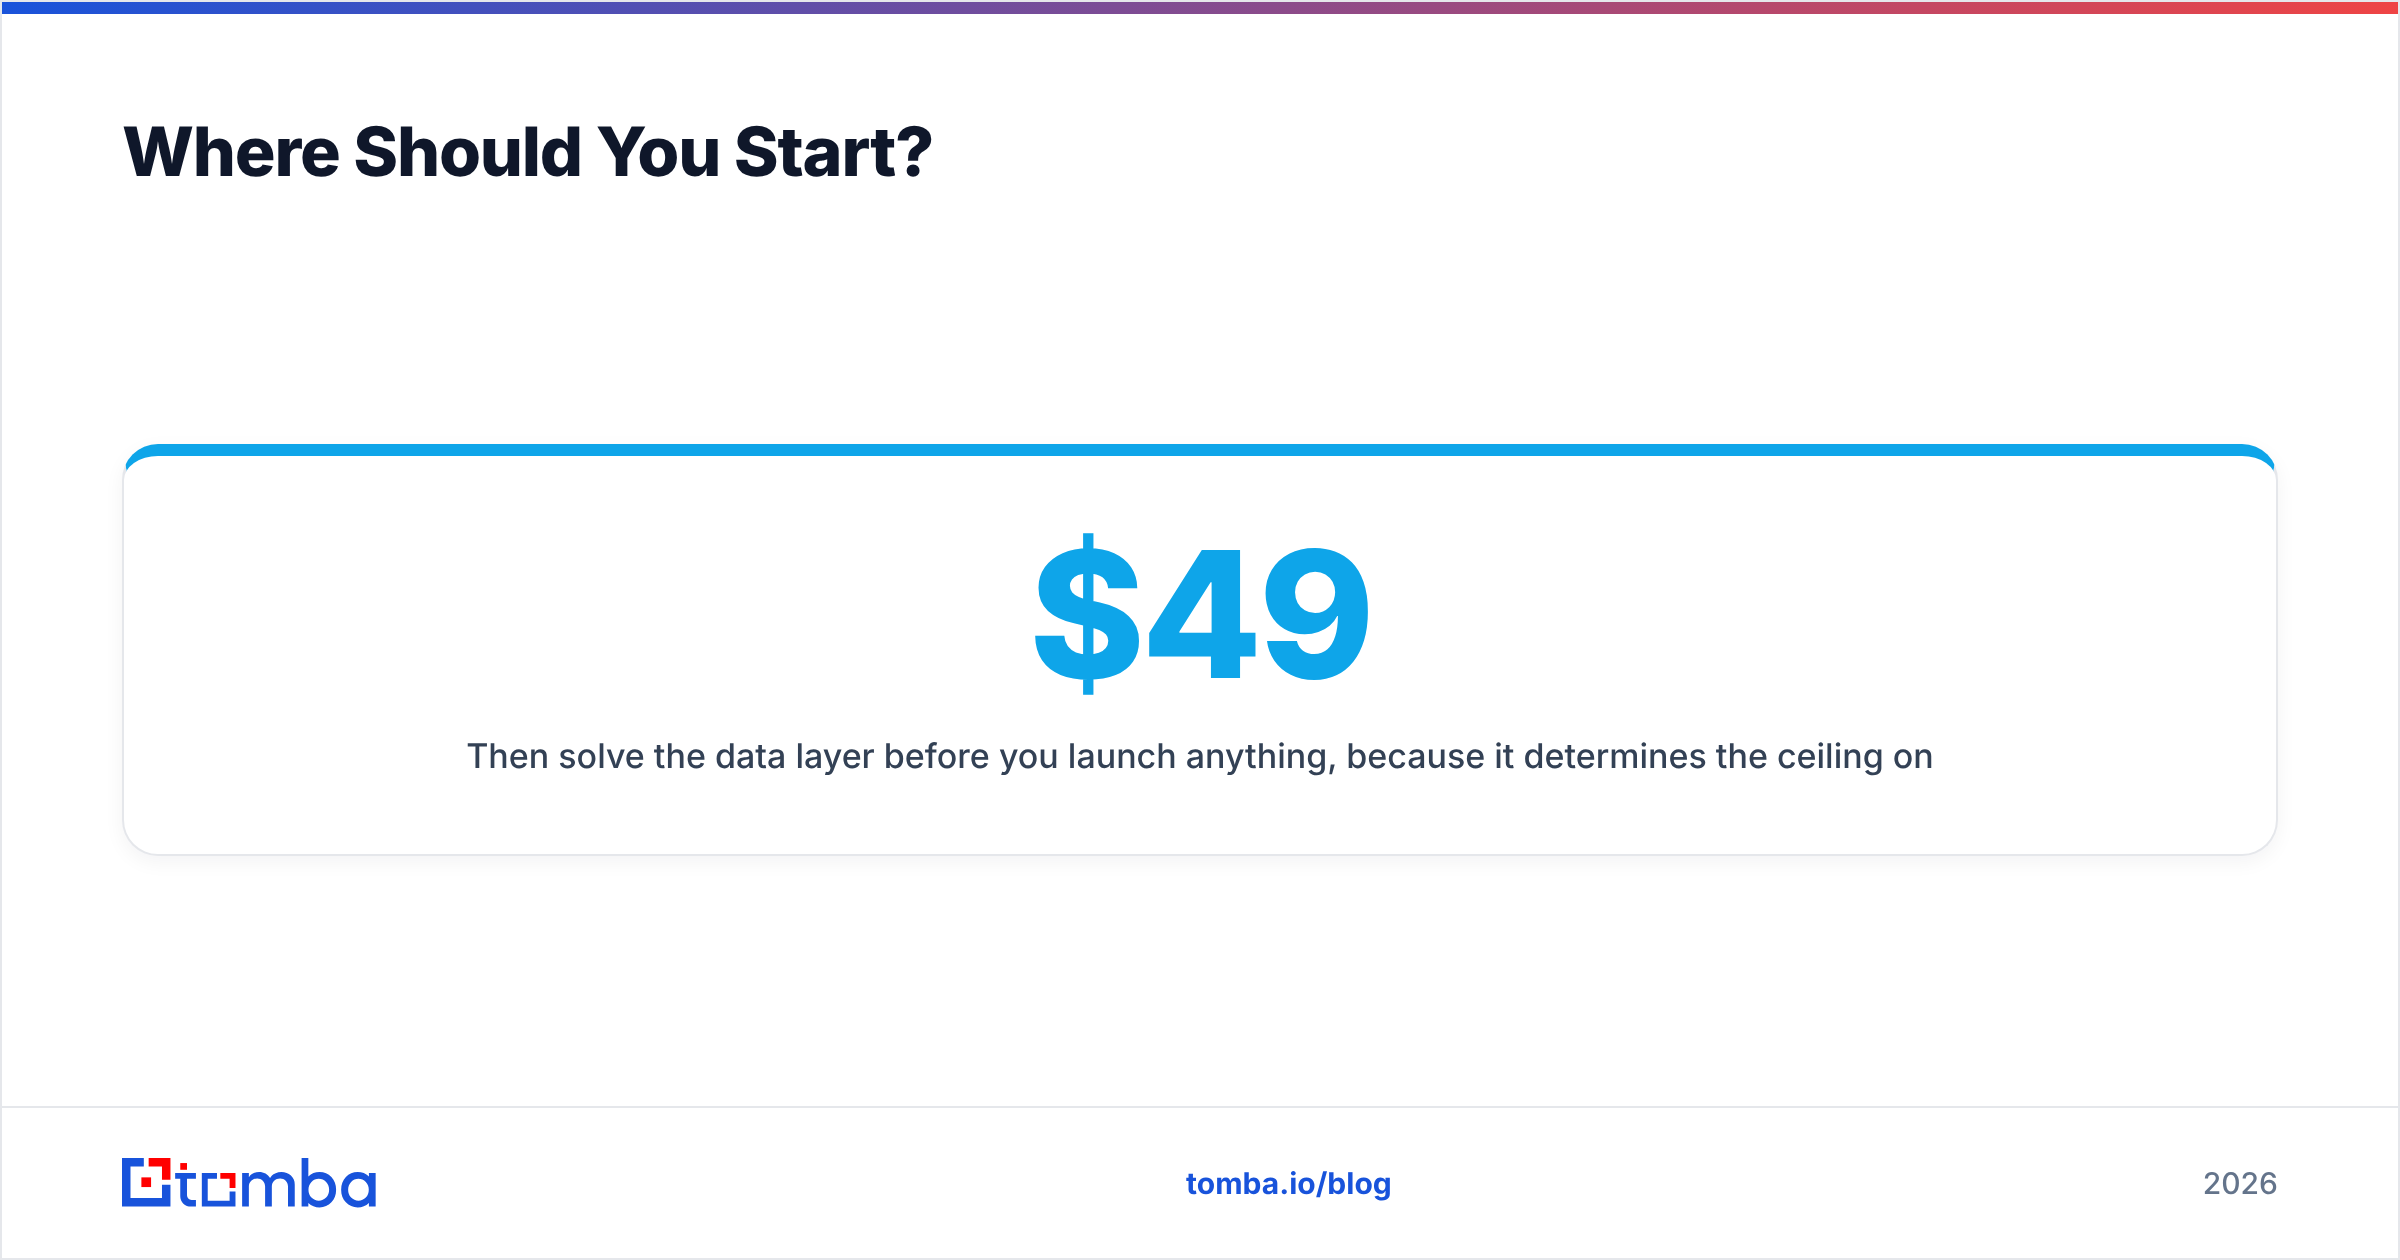
Then solve the data layer before you launch anything, because it determines the ceiling on every other decision. Once your ICP is defined, Tomba's Email Finder turns that definition into verified, reachable contacts — search by domain or by name across your target account list, verify before sending, and push straight into your CRM through the Tomba API or a native integration. The free tier covers 25 searches a month for testing the workflow, and paid plans start at $49/mo; full Tomba pricing scales to Growth at $99/mo and Pro at $249/mo as your list volume grows. A precise strategy pointed at a clean list is what separates a GTM document from GTM results.
Related guides#
Ready to find emails that actually work?
Join 150,000+ professionals who stopped guessing and started sending. Free credits on signup — no credit card required.
Get the Tomba newsletter
Practical outbound tactics and product updates — once every two weeks.
About the author