Go To Market Strategy For Technology Products (2026 Guide)
Most tech GTM plans fail because the motion doesn't match the price point. Here's how to pick PLG, sales-led, or hybrid — with a decision table, budget splits, and the metrics that actually predict traction.
TL;DR
- Your go-to-market motion is decided by your annual contract value, not by taste. Under $2k ACV, self-serve or PLG; $2k–$25k, inside sales with product-assisted trials; above $25k, sales-led with an SDR layer and multi-threaded buying committees.
- The most common failure is a mismatch: a $15k product sold with a "sign up free" button, or a $300/year tool with two SDRs burning $180k in payroll to close it.
- Segment before you spend. A tight ICP of 2,000 accounts you can actually name beats a TAM slide claiming 400,000 companies.
- Positioning is a competitive claim, not an adjective. "The fastest way to X for Y-sized teams already using Z" beats "modern, powerful, AI-native."
- Instrument six metrics from day one: activation rate, time-to-first-value, CAC payback, logo retention, pipeline coverage, and win rate against your top named competitor.
Most technology GTM plans read like a wish. They list channels, name a launch date, drop a TAM number pulled from a Gartner headline, and stop. Then the first 90 days arrive, nothing converts, and the team blames "awareness."
The fix is unglamorous. A go to market strategy for technology products is four decisions made in order: who you sell to, what motion moves them, what it costs to acquire them, and what proof you need before you scale spend. Get those four right and the channel mix mostly solves itself. Get them wrong and no amount of content, ads, or outbound volume rescues the plan.
What is a go-to-market strategy for a technology product?#
A go-to-market strategy is the operating plan that connects a specific product to a specific buyer through a specific motion at a cost you can sustain. That last clause is what separates it from marketing strategy. Marketing strategy asks how you'll be perceived. GTM asks how a dollar becomes a customer and how many dollars it takes.
For technology products, three characteristics change the math versus physical goods:
- Near-zero marginal cost — you can afford freemium, trials, and generous usage tiers that a hardware company cannot. This makes product-led motions viable in a way they aren't elsewhere.
- Long evaluation cycles at the high end — enterprise software buying committees now average 6 to 10 stakeholders, and technical evaluation (security review, SOC 2, data residency) adds weeks that no amount of sales pressure compresses.
- Switching costs compound — once your product holds data or sits in a workflow, retention becomes your cheapest growth lever. Expansion revenue in healthy B2B SaaS typically contributes 20–40% of net new ARR.
- Distribution is winner-take-most in search and marketplaces — the top three results for a category keyword capture the majority of clicks, and the same concentration applies inside app marketplaces.
Those four facts should shape every downstream decision. If your product has genuinely near-zero marginal cost and a fast time-to-value, withholding it behind a demo form is throwing away your structural advantage.

Which GTM motion fits your product?#
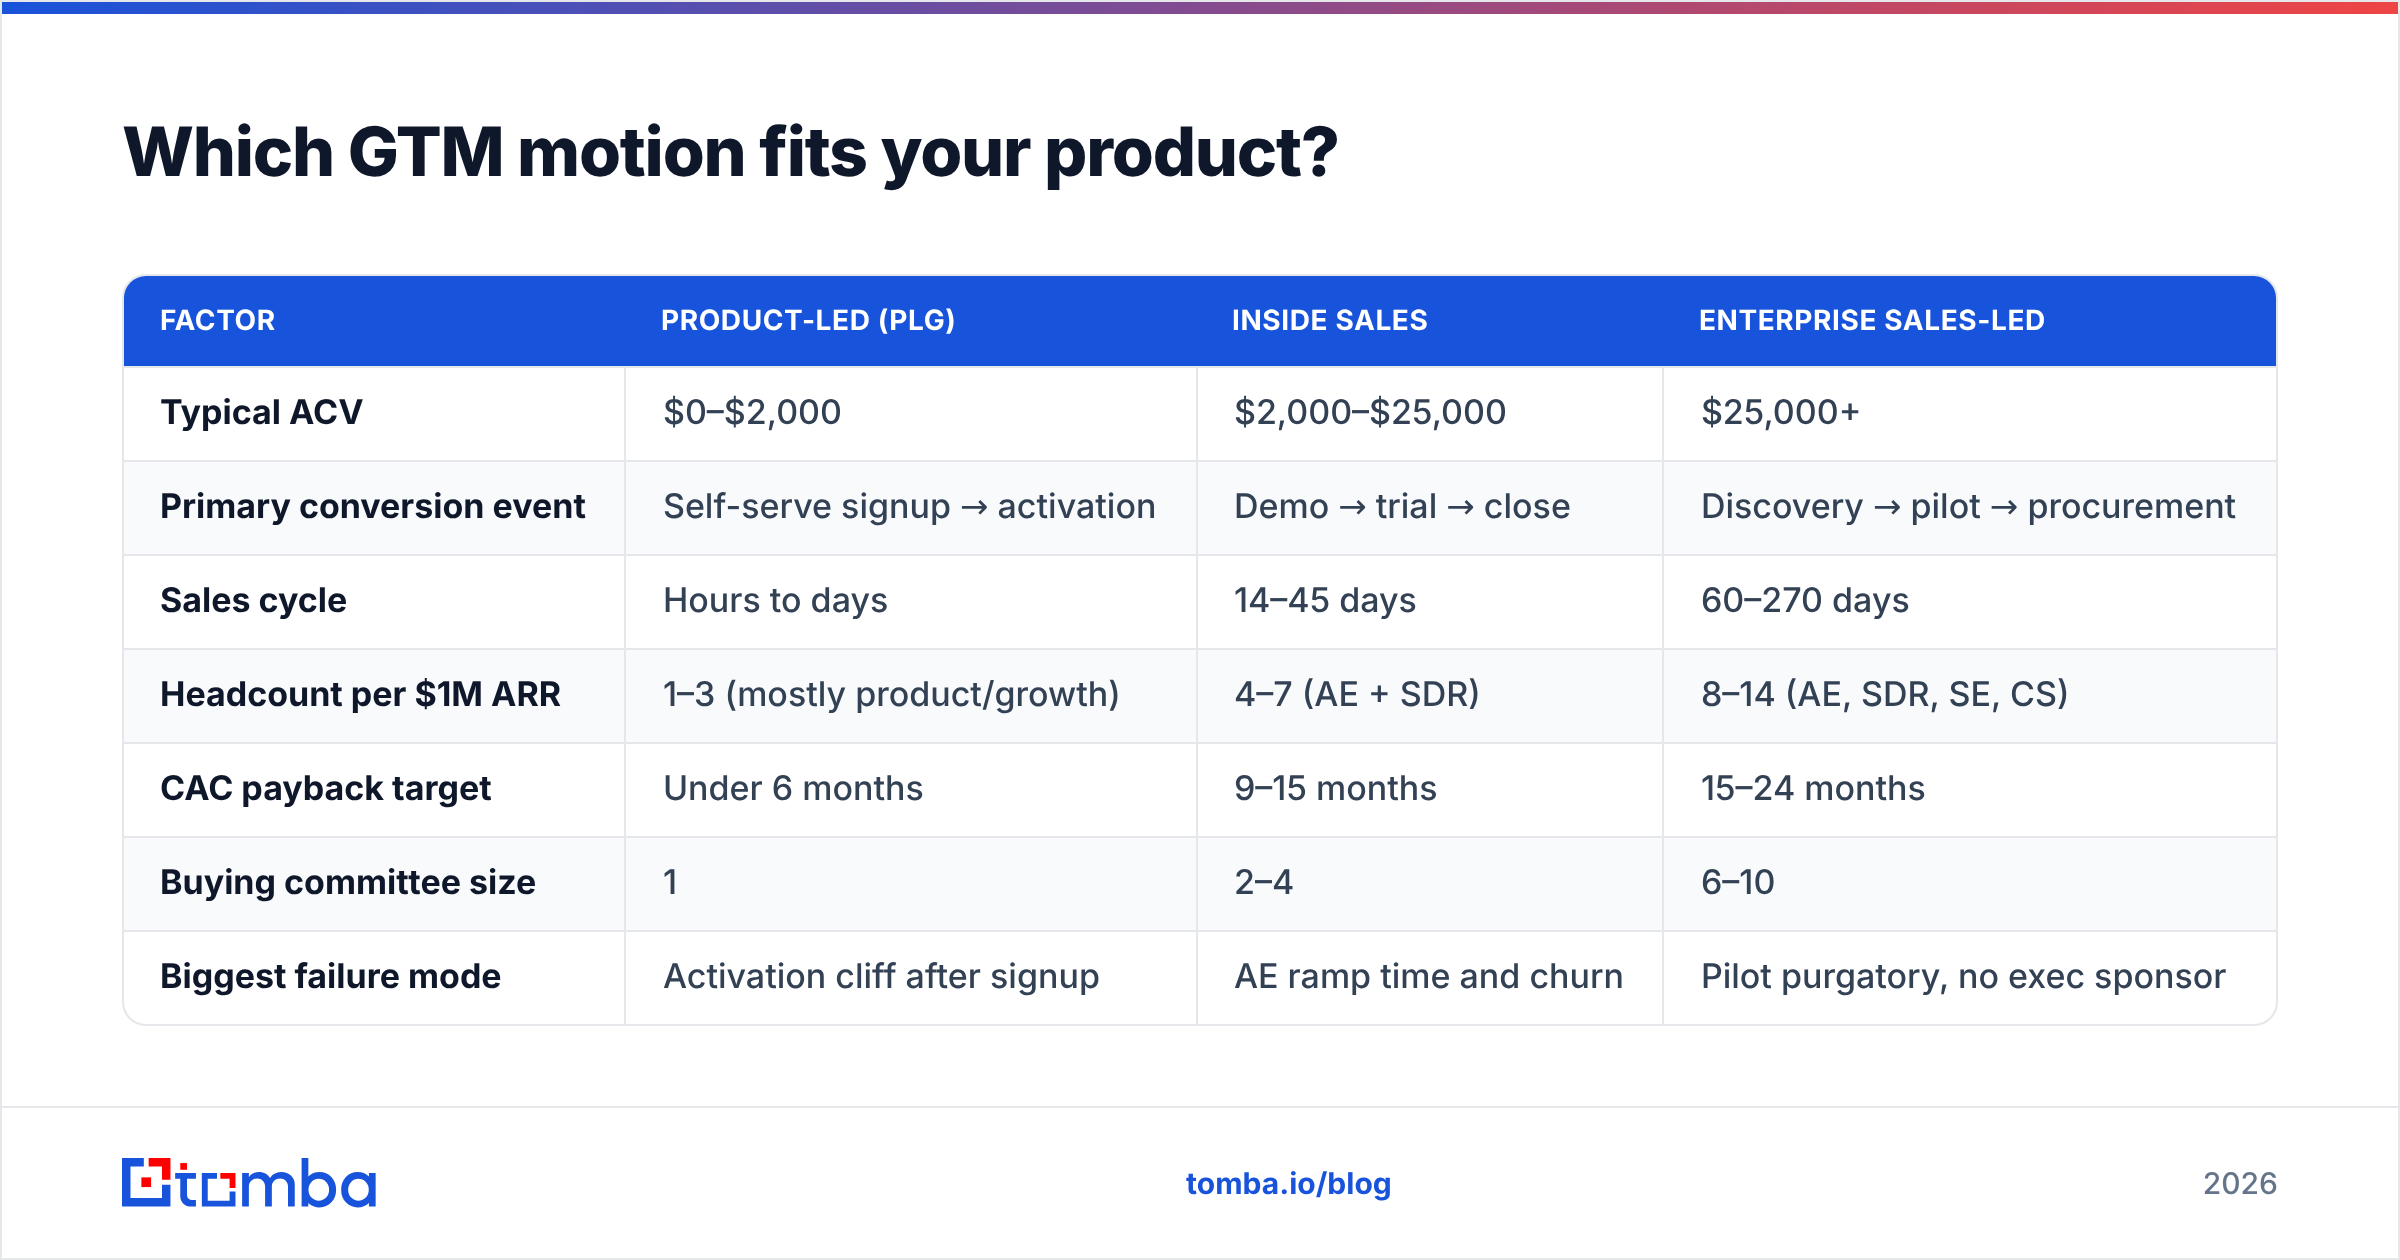
Pick by ACV first, then adjust for complexity. Here's the decision table most teams should start from.
| Factor | Product-Led (PLG) | Inside Sales | Enterprise Sales-Led |
|---|---|---|---|
| Typical ACV | $0–$2,000 | $2,000–$25,000 | $25,000+ |
| Primary conversion event | Self-serve signup → activation | Demo → trial → close | Discovery → pilot → procurement |
| Sales cycle | Hours to days | 14–45 days | 60–270 days |
| Headcount per $1M ARR | 1–3 (mostly product/growth) | 4–7 (AE + SDR) | 8–14 (AE, SDR, SE, CS) |
| CAC payback target | Under 6 months | 9–15 months | 15–24 months |
| Buying committee size | 1 | 2–4 | 6–10 |
| Biggest failure mode | Activation cliff after signup | AE ramp time and churn | Pilot purgatory, no exec sponsor |
| Content that moves deals | Docs, templates, free tools | Comparison pages, ROI calculators | Security docs, reference calls, analyst reports |
Two notes on reading this table. First, the boundaries are soft — plenty of companies run PLG at $8k ACV because the product genuinely sells itself and sales only handles expansion. Second, hybrid is now the default, not the exception. The common pattern is self-serve at the bottom to generate usage signal, then a sales-assist layer that reaches out when an account crosses a usage threshold (five seats, a certain API volume, an enterprise email domain).
The hybrid model breaks when the handoff is undefined. If your PLG funnel produces 400 signups a month and nobody has written the rule for which ones get a human, you have two disconnected motions, not one hybrid.
How do you define an ICP you can actually sell to?#
Stop at the account list. A useful ideal customer profile ends with names you can look up, not a description you can nod at.
Build it in this order:
- Firmographics — industry, employee count, revenue band, geography. Be narrow enough that the list is under 5,000 accounts for your first year.
- Technographics — what they already run. If you integrate with HubSpot, "uses HubSpot" is a harder qualifier than "mid-market SaaS." Tools like BuiltWith or a website tech stack check turn this into a filter.
- Trigger events — new funding, a relevant executive hire, a job posting for the role your product replaces, a pricing page change at a competitor. Triggers beat static fit because they add timing.
- Pain evidence — a public artifact showing the problem exists. A support forum thread, a G2 review complaining about the incumbent, a conference talk.
- Buying authority — who signs. If your champion is an individual contributor and the signer is a VP two levels up, your cycle is longer than your forecast assumes.
Once you have the criteria, the work becomes mechanical: build the list, find the contacts, verify them, and route them. This is where most teams quietly lose weeks. Scraping LinkedIn by hand produces a list with a 20–35% bounce rate, which torches sender reputation before your first campaign finishes sending.
A cleaner path is to run domain search against your target account list to pull the contacts and email patterns per company, then push everything through an email verifier before it touches a sequencer. Keeping bounce rate under 2% is not a nice-to-have — mailbox providers use it as a direct reputation input, and Google's own bulk sender guidelines spell out the thresholds.
What does positioning look like when it works?#
Positioning is a claim your competitor cannot honestly copy. Test yours against three questions:
- Can a competitor say the same sentence? If Salesforce, HubSpot, and three startups could all write your headline, it isn't positioning — it's category description.
- Does it name an alternative? Strong positioning implies what you're replacing: a spreadsheet, a legacy vendor, an internal script, a manual process.
- Is there a proof point in the next 30 words? A number, a customer name, a benchmark, a guarantee.
April Dunford's framing — that positioning is context-setting, not messaging — is the most useful model here. Your product's value depends entirely on which category the buyer files it under. A tool positioned as "a CRM" gets compared to Salesforce and loses. The same tool positioned as "pipeline visibility for agencies that live in Google Sheets" gets compared to a spreadsheet and wins.
Write the positioning statement, then pressure-test it against real category pages. Read your top three competitors' G2 category listings and note the exact phrases reviewers use to describe the problem. Those phrases are your buyers' language, unfiltered by your own marketing team.
How should you sequence launch channels?#
Sequence by feedback speed, not by reach. Early on you need signal, not volume.
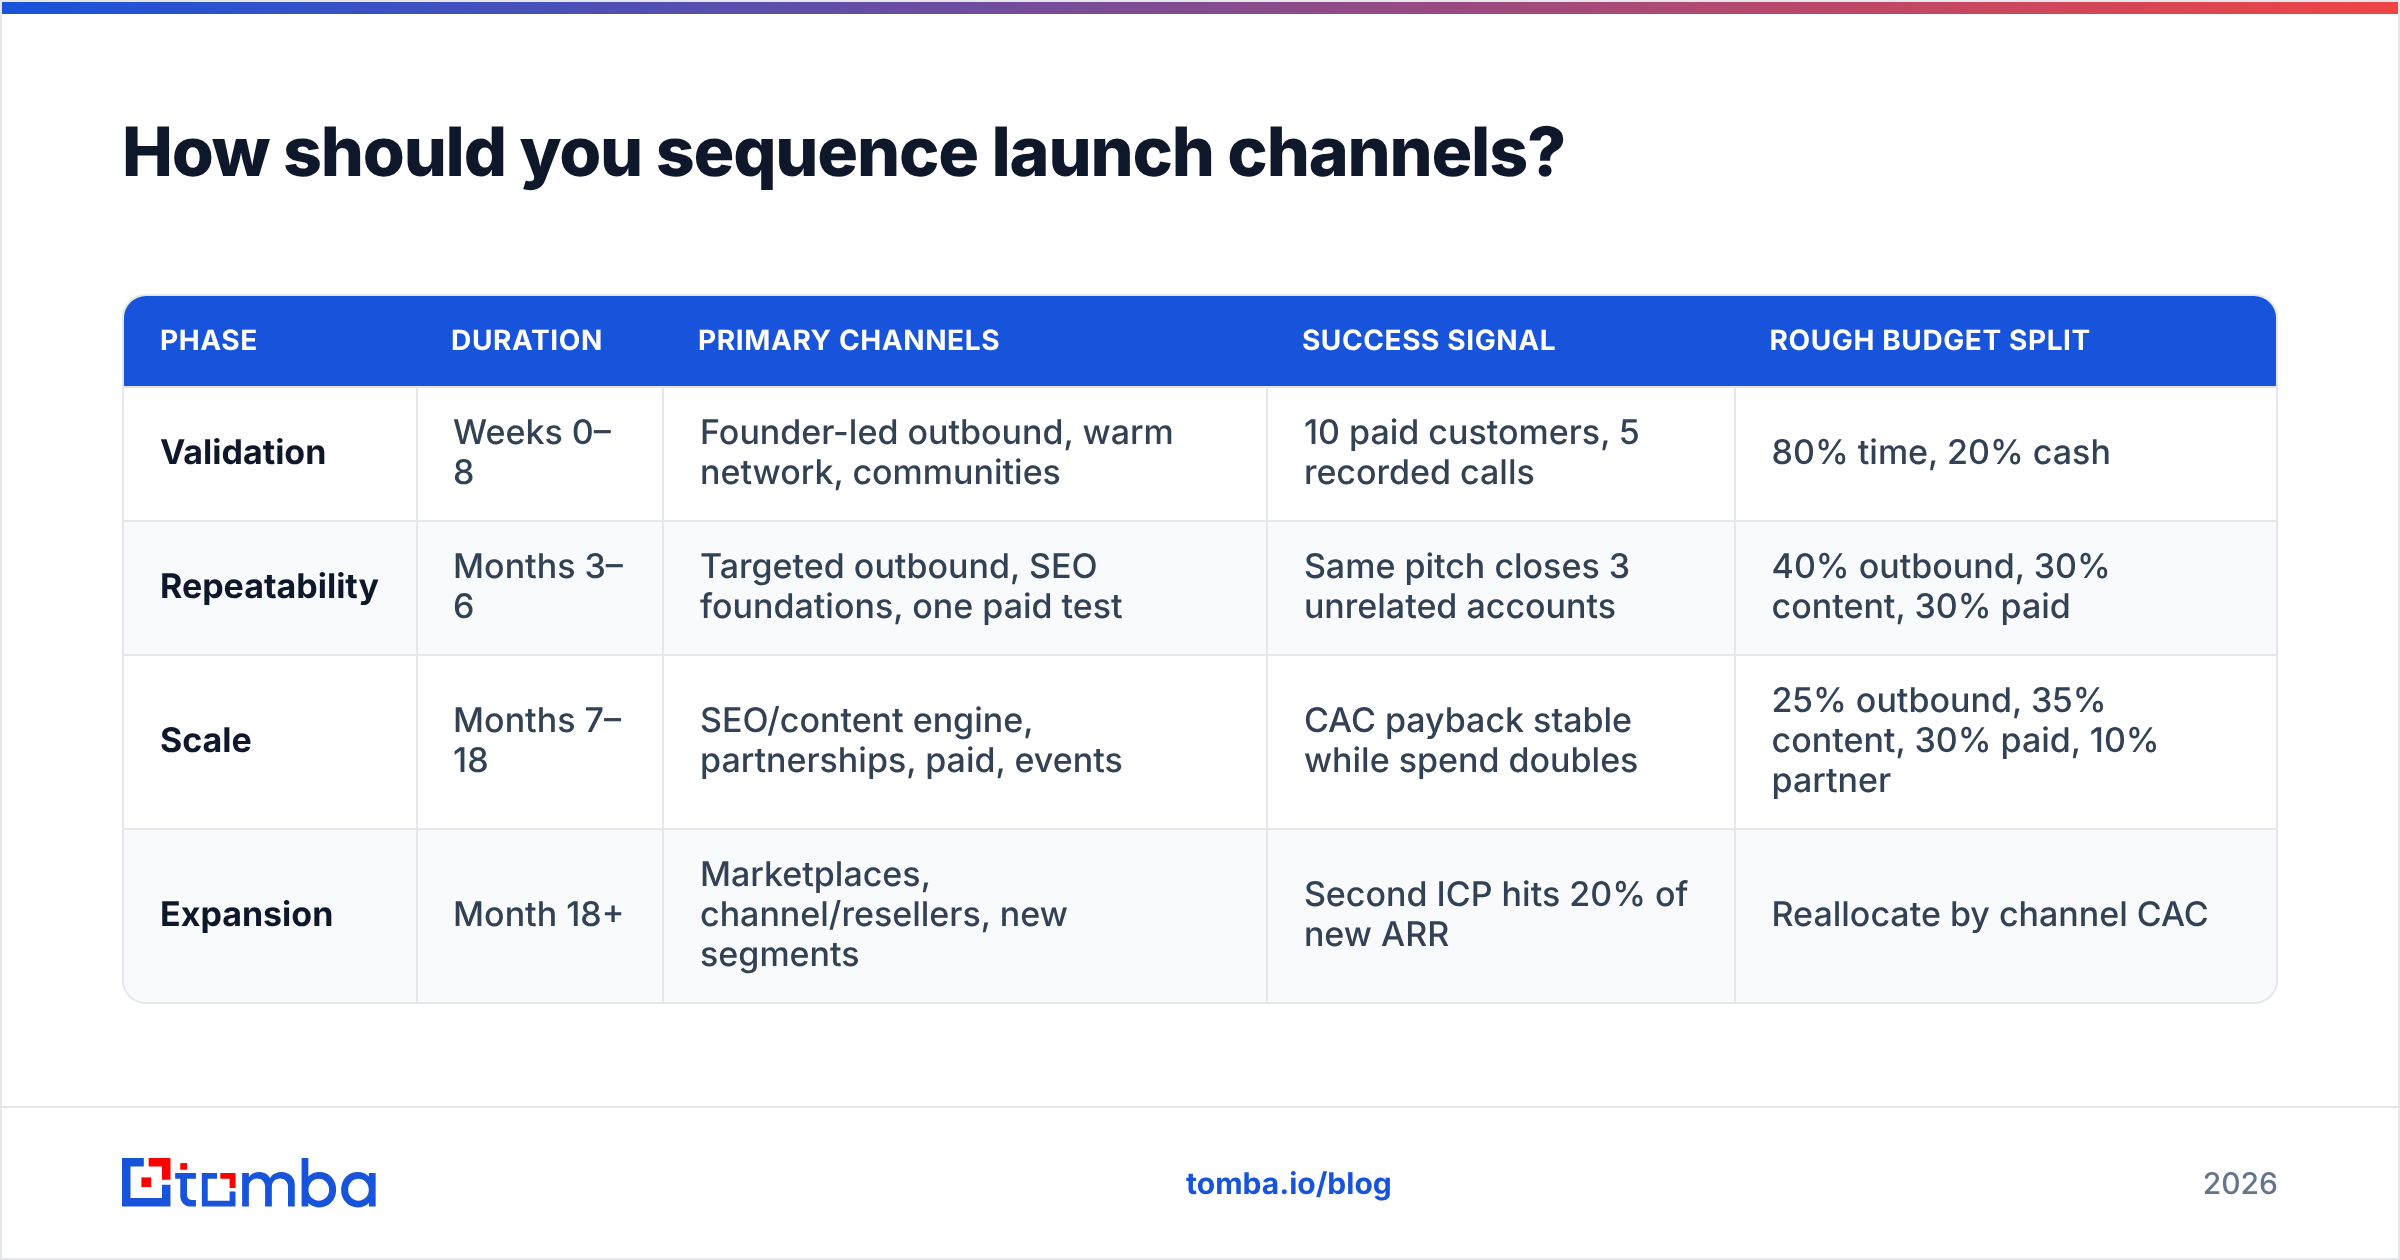
| Phase | Duration | Primary channels | Success signal | Rough budget split |
|---|---|---|---|---|
| Validation | Weeks 0–8 | Founder-led outbound, warm network, communities | 10 paid customers, 5 recorded calls | 80% time, 20% cash |
| Repeatability | Months 3–6 | Targeted outbound, SEO foundations, one paid test | Same pitch closes 3 unrelated accounts | 40% outbound, 30% content, 30% paid |
| Scale | Months 7–18 | SEO/content engine, partnerships, paid, events | CAC payback stable while spend doubles | 25% outbound, 35% content, 30% paid, 10% partner |
| Expansion | Month 18+ | Marketplaces, channel/resellers, new segments | Second ICP hits 20% of new ARR | Reallocate by channel CAC |
Founder-led outbound in the validation phase is non-negotiable, and most teams skip it because it feels unscalable. That's the point. Fifty personalized emails that generate twelve replies and four calls teach you more about objection patterns than a $20k ad test ever will.
For outbound at that stage, precision beats volume by a wide margin. Pull the exact 200 accounts that match your ICP, find the two or three right people at each, and write to them individually. A bulk email finder run handles the contact layer in minutes so your time goes into the message, not into hunting for addresses.

What should you actually measure?#
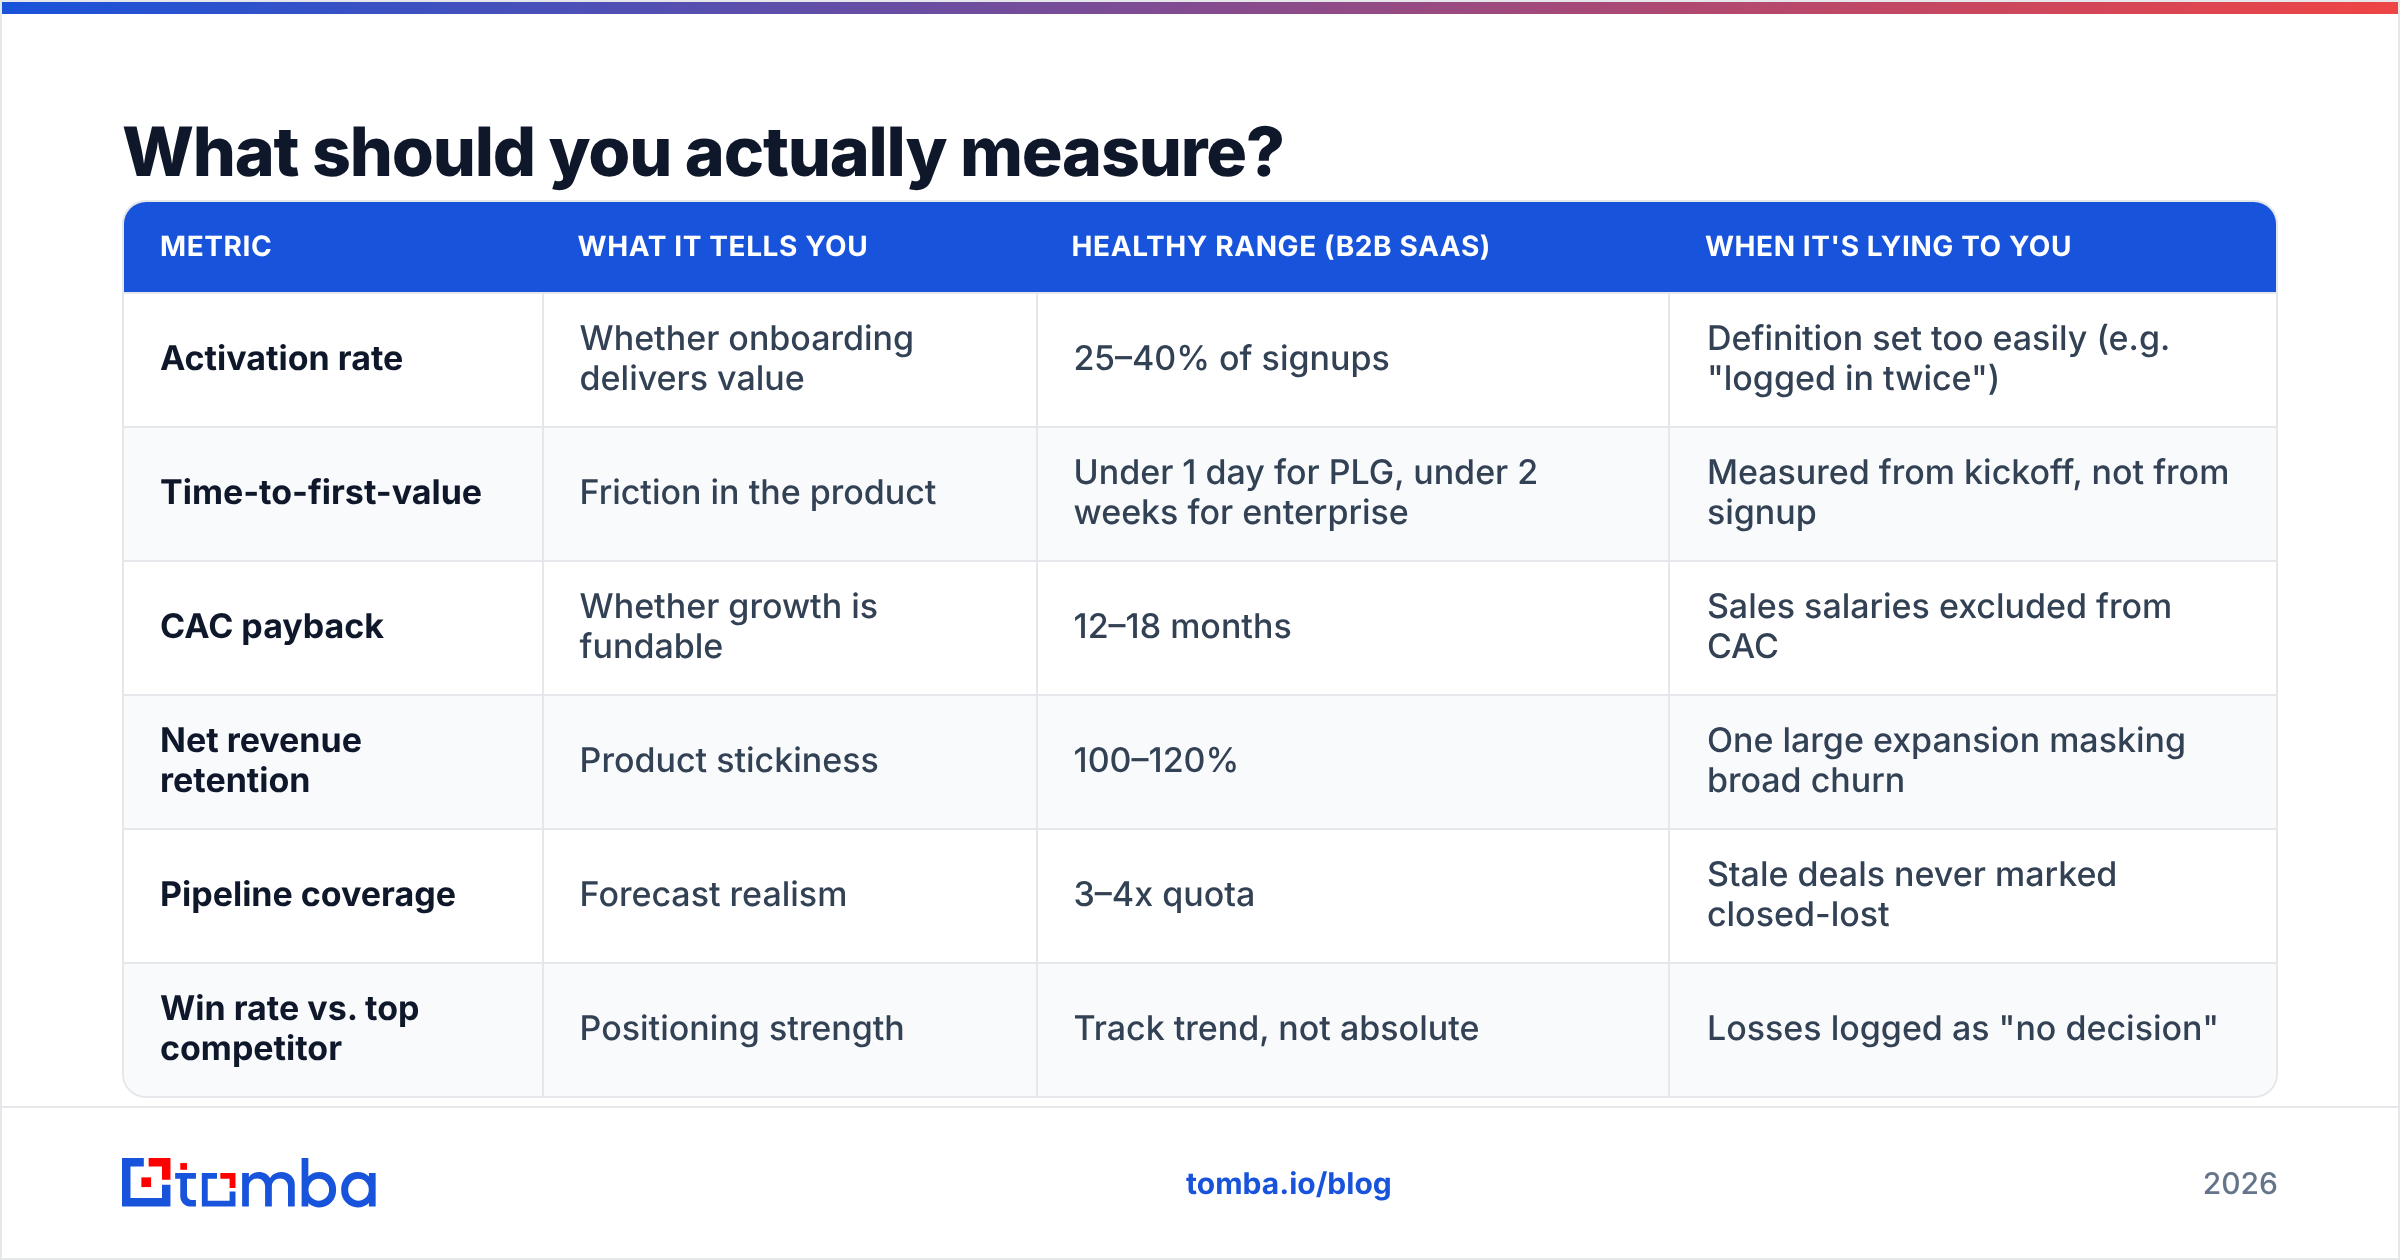
Six metrics. Adding more before these are stable creates dashboards nobody reads.
| Metric | What it tells you | Healthy range (B2B SaaS) | When it's lying to you |
|---|---|---|---|
| Activation rate | Whether onboarding delivers value | 25–40% of signups | Definition set too easily (e.g. "logged in twice") |
| Time-to-first-value | Friction in the product | Under 1 day for PLG, under 2 weeks for enterprise | Measured from kickoff, not from signup |
| CAC payback | Whether growth is fundable | 12–18 months | Sales salaries excluded from CAC |
| Net revenue retention | Product stickiness | 100–120% | One large expansion masking broad churn |
| Pipeline coverage | Forecast realism | 3–4x quota | Stale deals never marked closed-lost |
| Win rate vs. top competitor | Positioning strength | Track trend, not absolute | Losses logged as "no decision" |
Two of these deserve special attention. CAC payback is the single number that determines whether you can raise or must retrench, and it's the one most frequently understated by omitting fully loaded sales and marketing salaries. And win rate against a named competitor — not aggregate win rate — is the fastest positioning feedback loop you have. If you're losing to the same company for the same reason three months running, that's a product or positioning problem, not a sales-skill problem.
Forrester and Gartner both publish periodic B2B buying research worth reading against your own funnel; Gartner's sales research hub is a reasonable starting point for benchmark context, though treat any published median as directional rather than a target.
Where do most tech GTM plans break?#
Five failure patterns, in rough order of frequency.
- Motion/price mismatch. Selling a $600/year product with a demo-request-only funnel, or a $40k platform through self-serve checkout. Fix by re-reading the ACV table above and moving one column.
- ICP too broad. "Any company with a sales team" is not an ICP. The tell is that your messaging has to stay generic to fit everyone, which makes it convert for no one.
- Bad contact data. Bounce rates over 5% get your domain throttled, which makes every downstream channel metric unreadable. Verify before you send, always — and if you're targeting large orgs, check whether the domain is catch-all with a catch-all verifier before assuming a valid-looking address will land.
- Premature scaling. Hiring three AEs before one person has closed repeatably means you're paying to discover the playbook three times in parallel. Wait for the same pitch to close three unrelated accounts.
- No expansion motion. Teams spend 100% of GTM budget on new logos while sitting on a base that would expand with a single quarterly check-in. Expansion CAC is typically a fraction of new-logo CAC.
The data quality point is worth expanding. Every GTM metric you track downstream — reply rate, meeting rate, pipeline coverage — is computed on a denominator of contacts you believed were real. If 30% of that list is invalid, your reply rate is understated by roughly the same margin, and you'll kill a channel that was actually working. Clean the list first; interpret the metrics second.
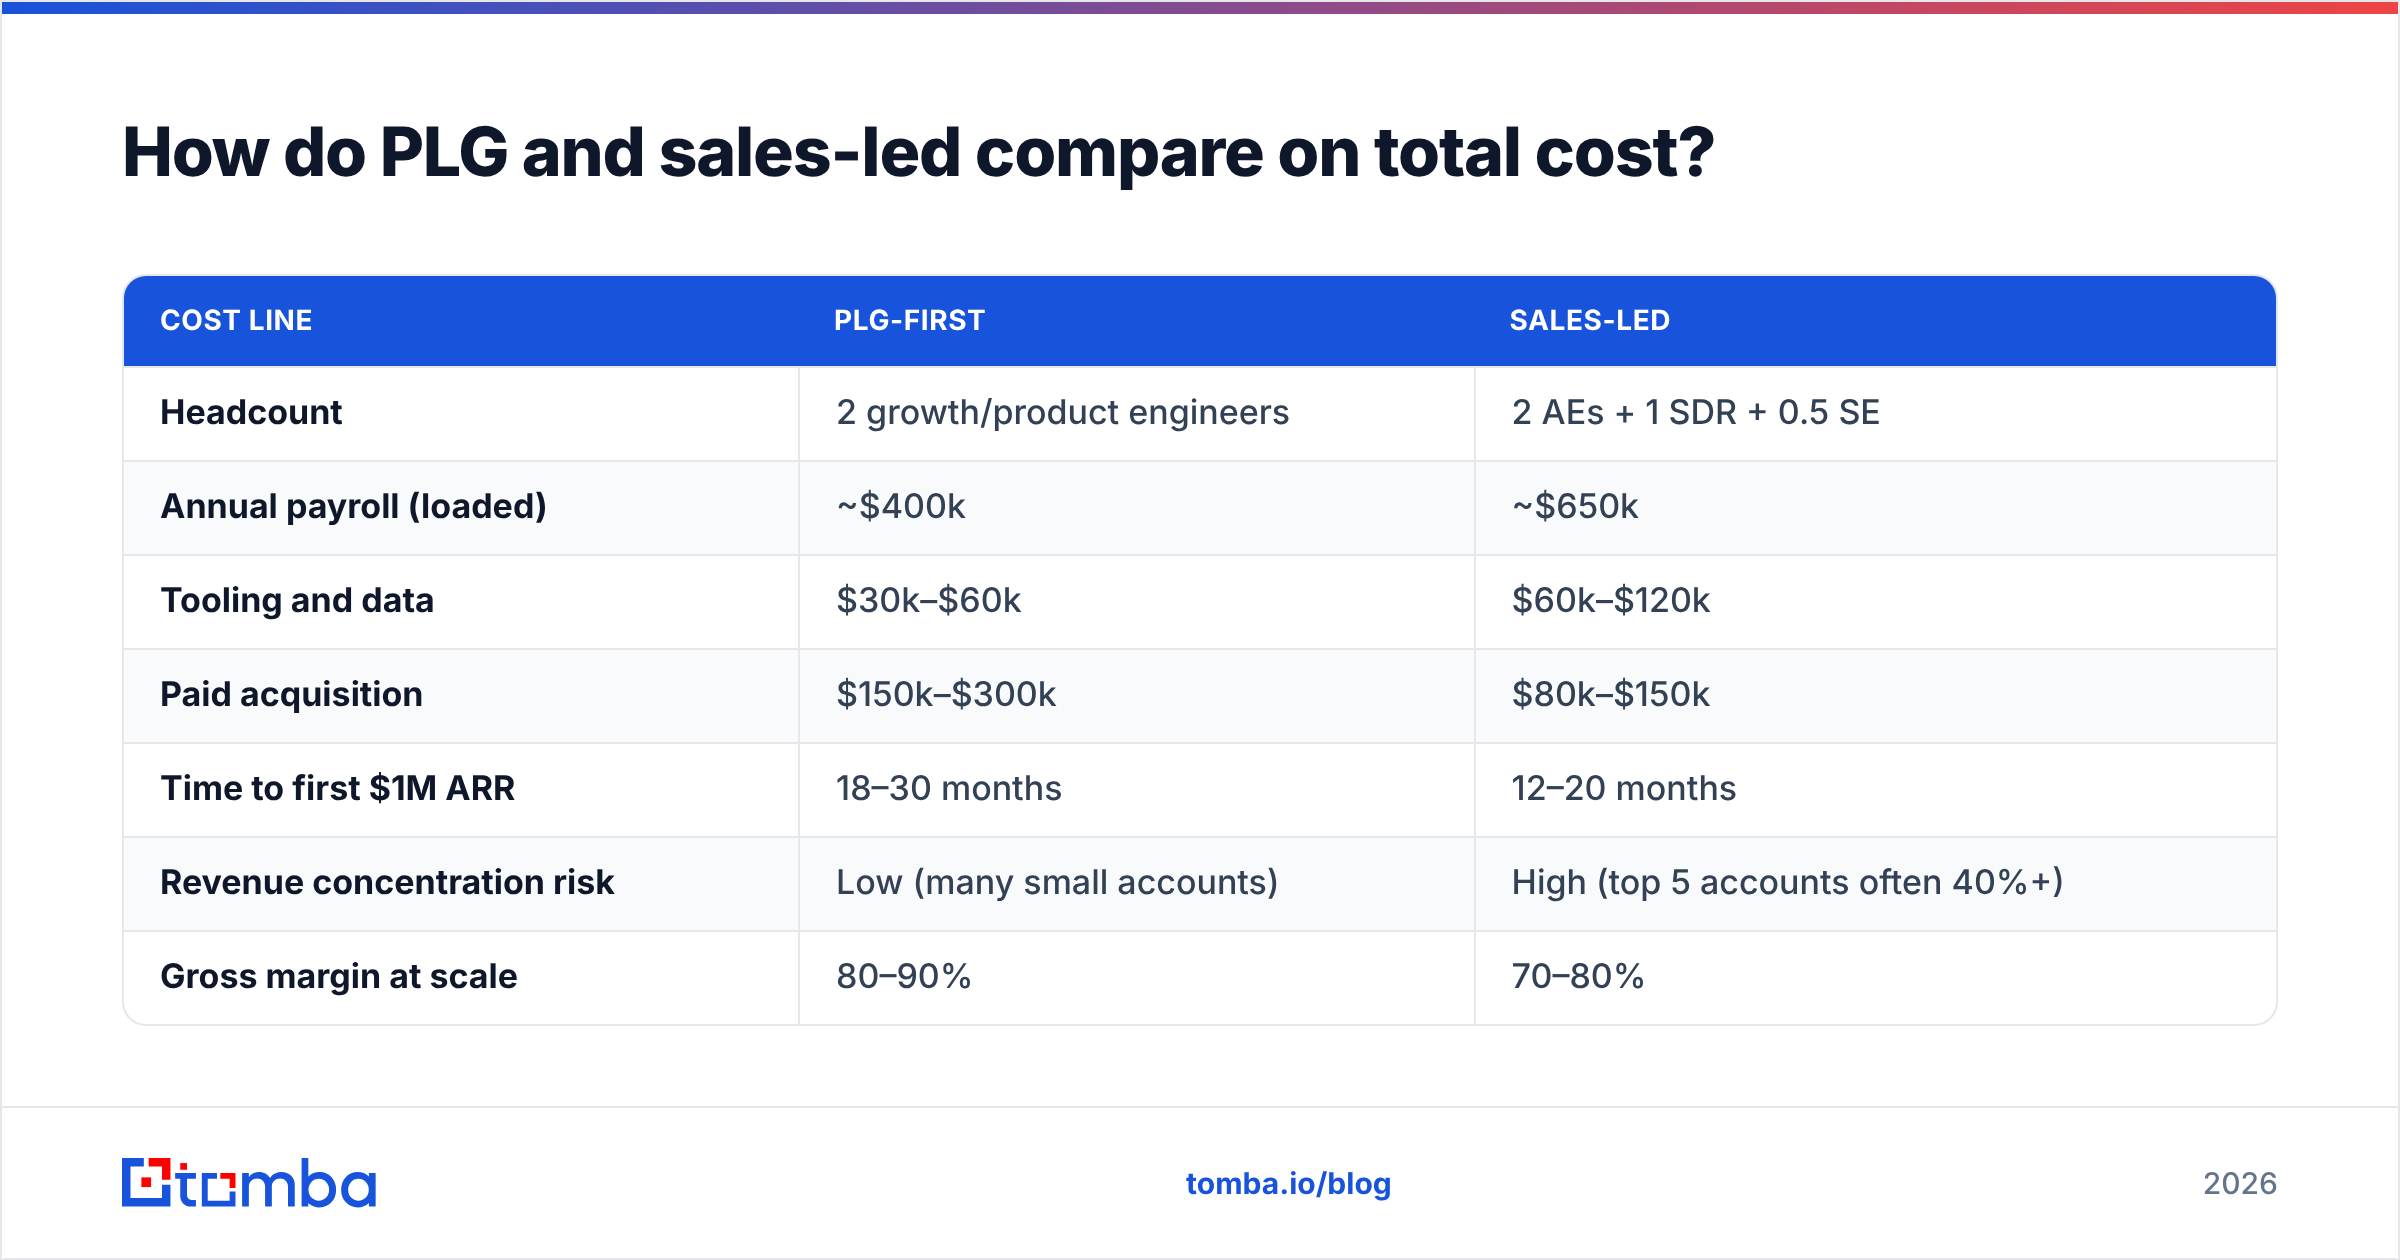
How do PLG and sales-led compare on total cost?#
Run the arithmetic before you commit headcount. A simplified two-year view at $1M ARR target:
| Cost line | PLG-first | Sales-led |
|---|---|---|
| Headcount | 2 growth/product engineers | 2 AEs + 1 SDR + 0.5 SE |
| Annual payroll (loaded) | ~$400k | ~$650k |
| Tooling and data | $30k–$60k | $60k–$120k |
| Paid acquisition | $150k–$300k | $80k–$150k |
| Time to first $1M ARR | 18–30 months | 12–20 months |
| Revenue concentration risk | Low (many small accounts) | High (top 5 accounts often 40%+) |
| Gross margin at scale | 80–90% | 70–80% |
Neither column is universally better. PLG trades slower early revenue for better margins and lower concentration risk. Sales-led buys speed with payroll and accepts concentration. What you cannot do is budget for PLG and staff for sales-led, which is exactly what happens when a team adds AEs "to accelerate" a self-serve product without changing the price point.
What's the 90-day starting plan?#
If you're starting from zero, this sequence works across most technology products:
- Days 1–14: Define and build the account list. Lock firmographic and technographic criteria. Produce a named list of 500–2,000 accounts. Enrich with contacts and verify every address before it enters your system — data enrichment at this stage saves weeks of manual research later.
- Days 15–30: Write and test the pitch. Founder sends 50 individually written emails. Target: 10+ replies, 4+ calls. Record every call. If reply rate is under 8%, the problem is the message or the list, not the volume.
- Days 31–60: Find the repeatable objection. Catalog objections from calls. The one that appears in 60%+ of conversations becomes your primary content and positioning target.
- Days 61–90: Build one channel deeper. Whichever channel produced the most qualified conversations gets doubled. Do not add a second channel until the first has a documented, repeatable process.
Resist the urge to run all channels simultaneously in month one. With low volume across five channels, none produces statistically meaningful signal, and you'll spend month four arguing about which one to cut based on noise.
Getting the contact layer right#
Every motion described above — outbound, PLG sales-assist, partner co-selling, expansion — runs on accurate contact data. The account list is strategy; the verified email address is execution. Teams that treat the second half as an afterthought end up with beautiful GTM decks and a 6% deliverability problem.
Tomba Email Finder handles that layer: find professional email addresses by domain, name, or company, verify them before they hit your sequencer, and export straight into your CRM. The free tier gives you 25 searches a month to test the data quality against accounts you already know, and paid plans start at $49/mo on Starter with Growth at $99/mo — see Tomba pricing for the full breakdown. Build the list right once, and every metric downstream starts telling you the truth.
Related guides#
Ready to find emails that actually work?
Join 150,000+ professionals who stopped guessing and started sending. Free credits on signup — no credit card required.
Get the Tomba newsletter
Practical outbound tactics and product updates — once every two weeks.
About the author