Go To Market Strategy Template Excel: 2026 Build Guide
Most GTM templates are pretty slides that die after week two. Here is a working Excel go-to-market strategy template — tabs, formulas, and the data feed that keeps it accurate.

TL;DR
- A go to market strategy template excel only works if it connects three things: a segment list, a contact-level target account list, and a weekly actuals tab. Slides can't do that.
- Build seven tabs: Assumptions, ICP & Segments, Target Account List, Channel Plan, Capacity Model, Budget, and Weekly Scorecard. Everything else is decoration.
- The single biggest failure mode is a target account list with no contact data. You end up with 400 company names and no one to email.
- Excel beats a dedicated GTM platform for the first 6–12 months because you can change the model in 30 seconds. Move to a CRM-native model once your motion stops changing weekly.
- Fill the contact columns programmatically — a bulk email finder or the Excel add-in turns a company list into an executable account list in one pass.
What Is a Go-To-Market Strategy Template in Excel?#
A go-to-market strategy template in Excel is a single workbook that holds the assumptions, the target list, the channel plan, and the weekly actuals for a product launch or a new segment push. It is a model, not a document.
Think of it like a restaurant's prep sheet versus its menu. The menu — the pretty deck you show the board — describes what you intend to serve. The prep sheet says how many portions of each dish you need by 5pm, who's making them, and what's already in the walk-in. Most teams build the menu and skip the prep sheet, then wonder why the launch stalls in week three.
The Excel version wins on one specific attribute: recalculation. When you learn that your reply rate is 4% and not 12%, you change one cell and the whole plan re-forecasts. In a slide deck you'd rewrite nine slides and quietly avoid it.
What an Excel GTM template is not: it is not a CRM, not a sequencer, and not a source of truth for closed-won revenue. It's the planning layer that sits above those systems and gets reconciled against them weekly.

What Tabs Should the Template Actually Contain?#
Seven tabs. Fewer and you're hiding assumptions inside formulas; more and nobody updates it.
- Assumptions — every number a human guessed lives here and nowhere else. Deal size, sales cycle days, reply rate, meeting-to-opp rate, win rate, ramp time. Every other tab references these cells. If a number appears hardcoded in another tab, it's a bug.
- ICP & Segments — one row per segment with firmographic filters (employee band, industry code, region, tech stack signal), estimated segment size, and a priority score. Three to five segments maximum for a first launch.
- Target Account List — one row per account, with contact-level columns: company, domain, segment, tier, decision-maker name, title, verified email, phone, LinkedIn, owner, status. This is the tab that makes the workbook executable instead of theoretical.
- Channel Plan — one row per channel (outbound email, cold calls, LinkedIn, paid, partner, events) with volume, expected conversion, cost per touch, and the owner's name.
- Capacity Model — reps × working days × touches per day, cross-checked against the volume the Channel Plan demands. This tab exists to catch the classic error: a plan that requires 900 calls a week from two SDRs.
- Budget — spend by channel by month, with a cost-per-opportunity column that pulls from actuals once you have them.
- Weekly Scorecard — plan vs. actual, by week, by channel. Six columns, no charts until month two.
The Capacity Model tab is the one people skip and the one that saves launches. A plan that fails a capacity check on paper will fail harder in the field.
How Do You Build the Assumptions Tab Without Guessing?#
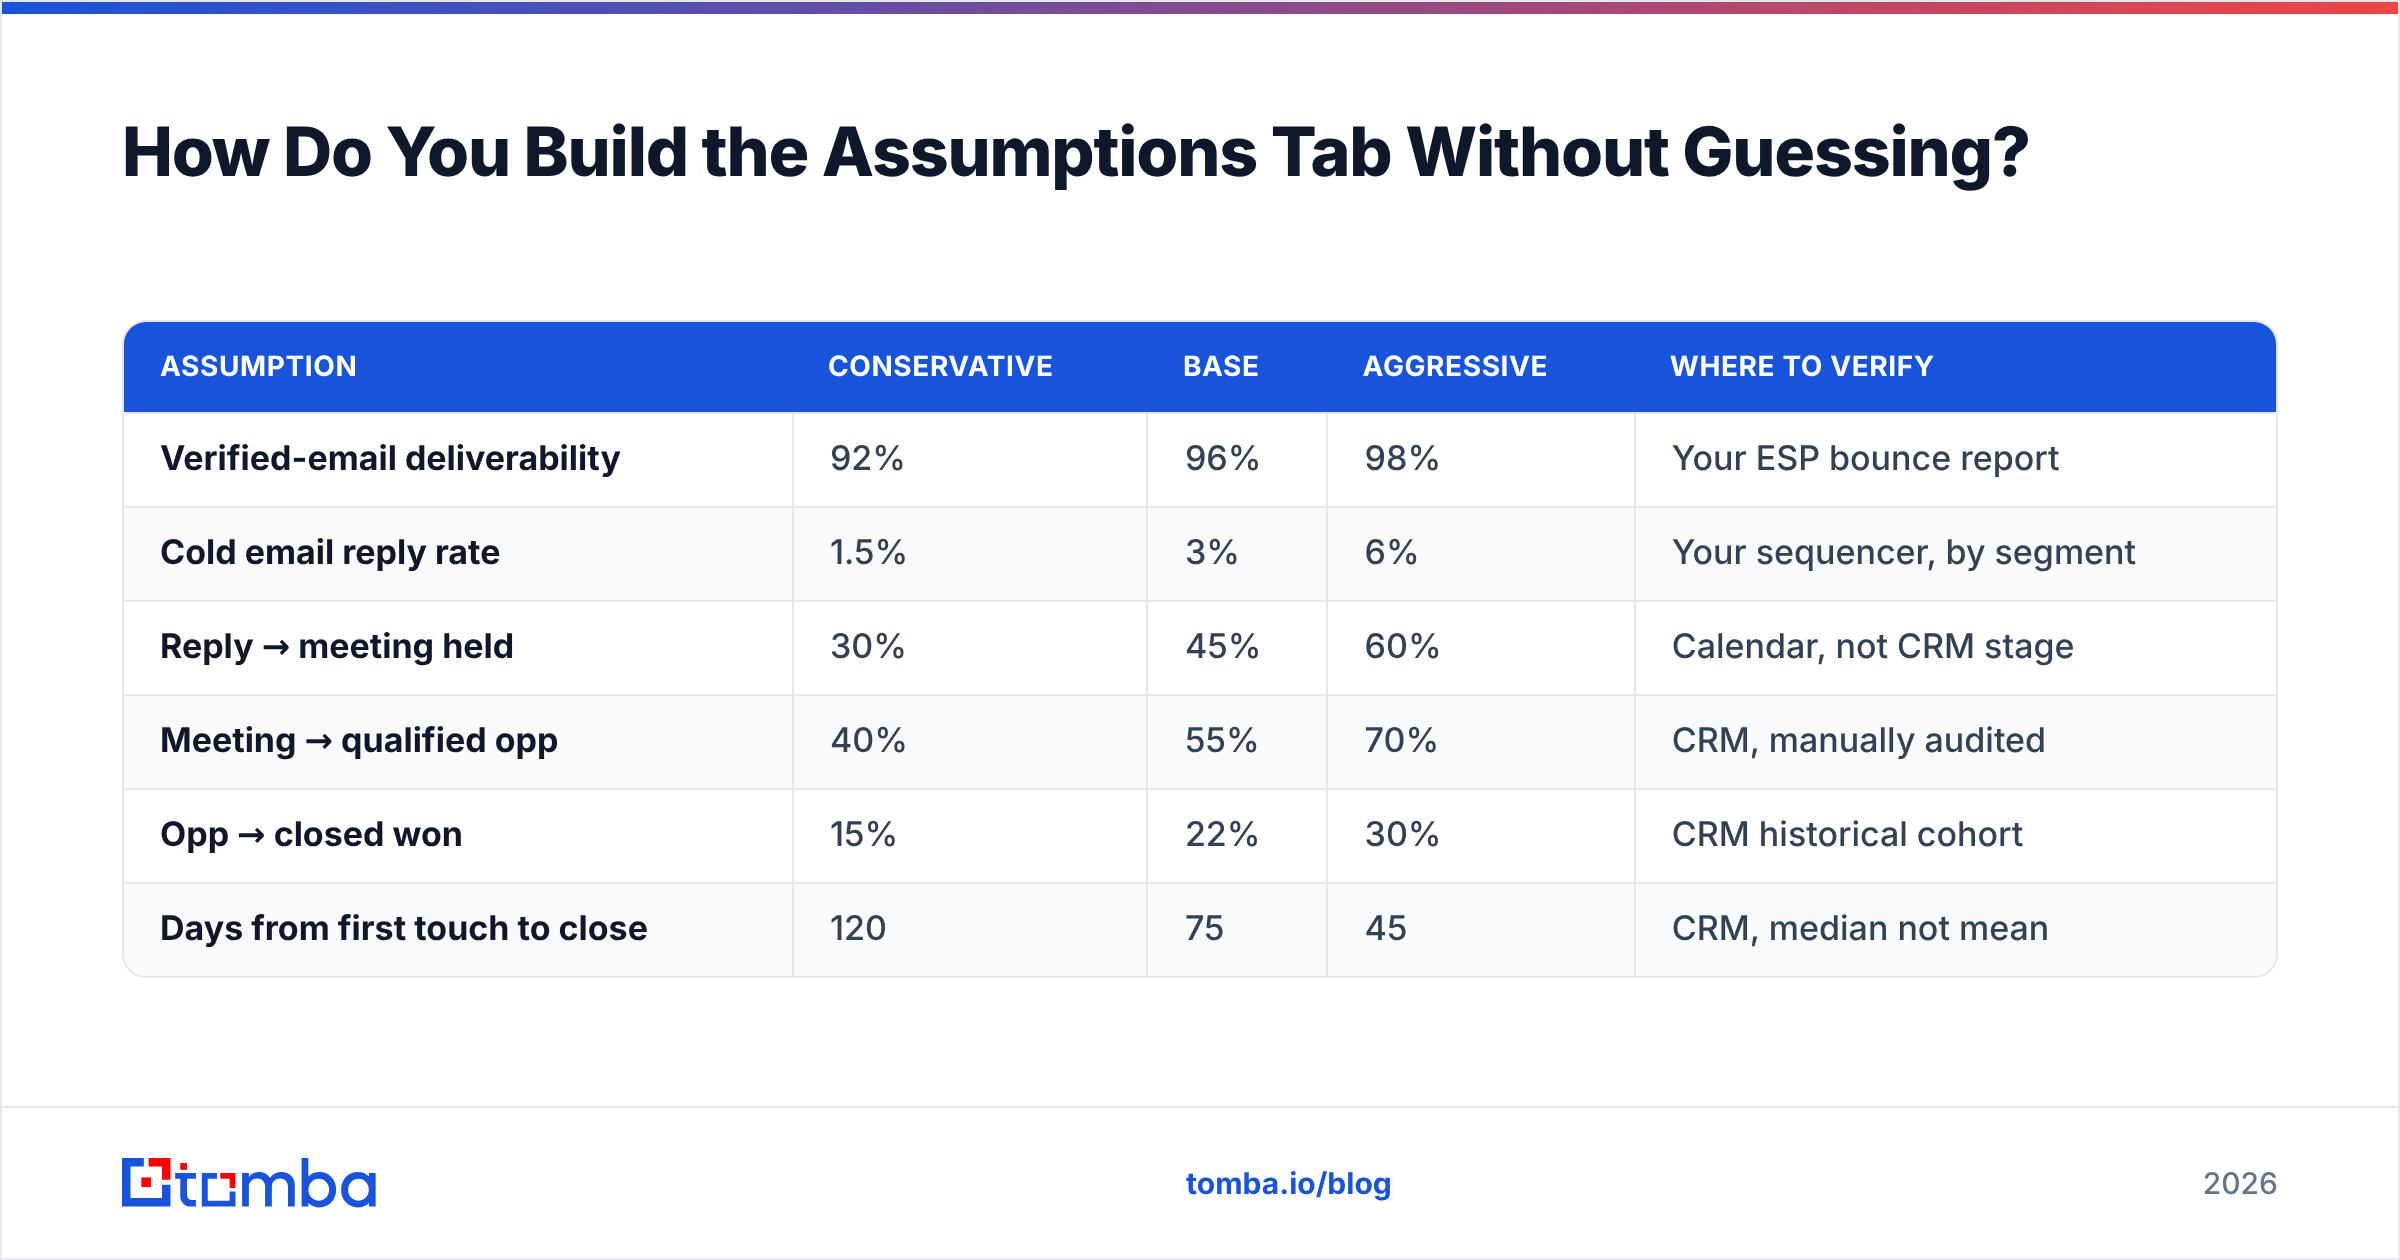
Anchor every assumption to either your own historical data or a published benchmark, and label which one it is. Add a column called Source with values like Internal Q3, Benchmark, or Guess. Anything marked Guess gets reviewed after 30 days of real data.
Reasonable starting anchors for a B2B outbound-led motion, all of which you should replace with your own numbers as soon as you have 200+ touches:
| Assumption | Conservative | Base | Aggressive | Where to verify |
|---|---|---|---|---|
| Verified-email deliverability | 92% | 96% | 98% | Your ESP bounce report |
| Cold email reply rate | 1.5% | 3% | 6% | Your sequencer, by segment |
| Reply → meeting held | 30% | 45% | 60% | Calendar, not CRM stage |
| Meeting → qualified opp | 40% | 55% | 70% | CRM, manually audited |
| Opp → closed won | 15% | 22% | 30% | CRM historical cohort |
| Days from first touch to close | 120 | 75 | 45 | CRM, median not mean |
Use the median, never the mean, for cycle length. One 400-day enterprise deal will wreck a mean and make your whole capacity model wrong.
For benchmark sanity checks that aren't vendor marketing, Gartner's sales research and buyer-behavior data from HubSpot's sales research are two of the more defensible public sources. Treat any single-vendor "average reply rate is 12%" claim as marketing until you can reproduce it.
How Do You Turn a Segment List Into an Executable Target Account List?#
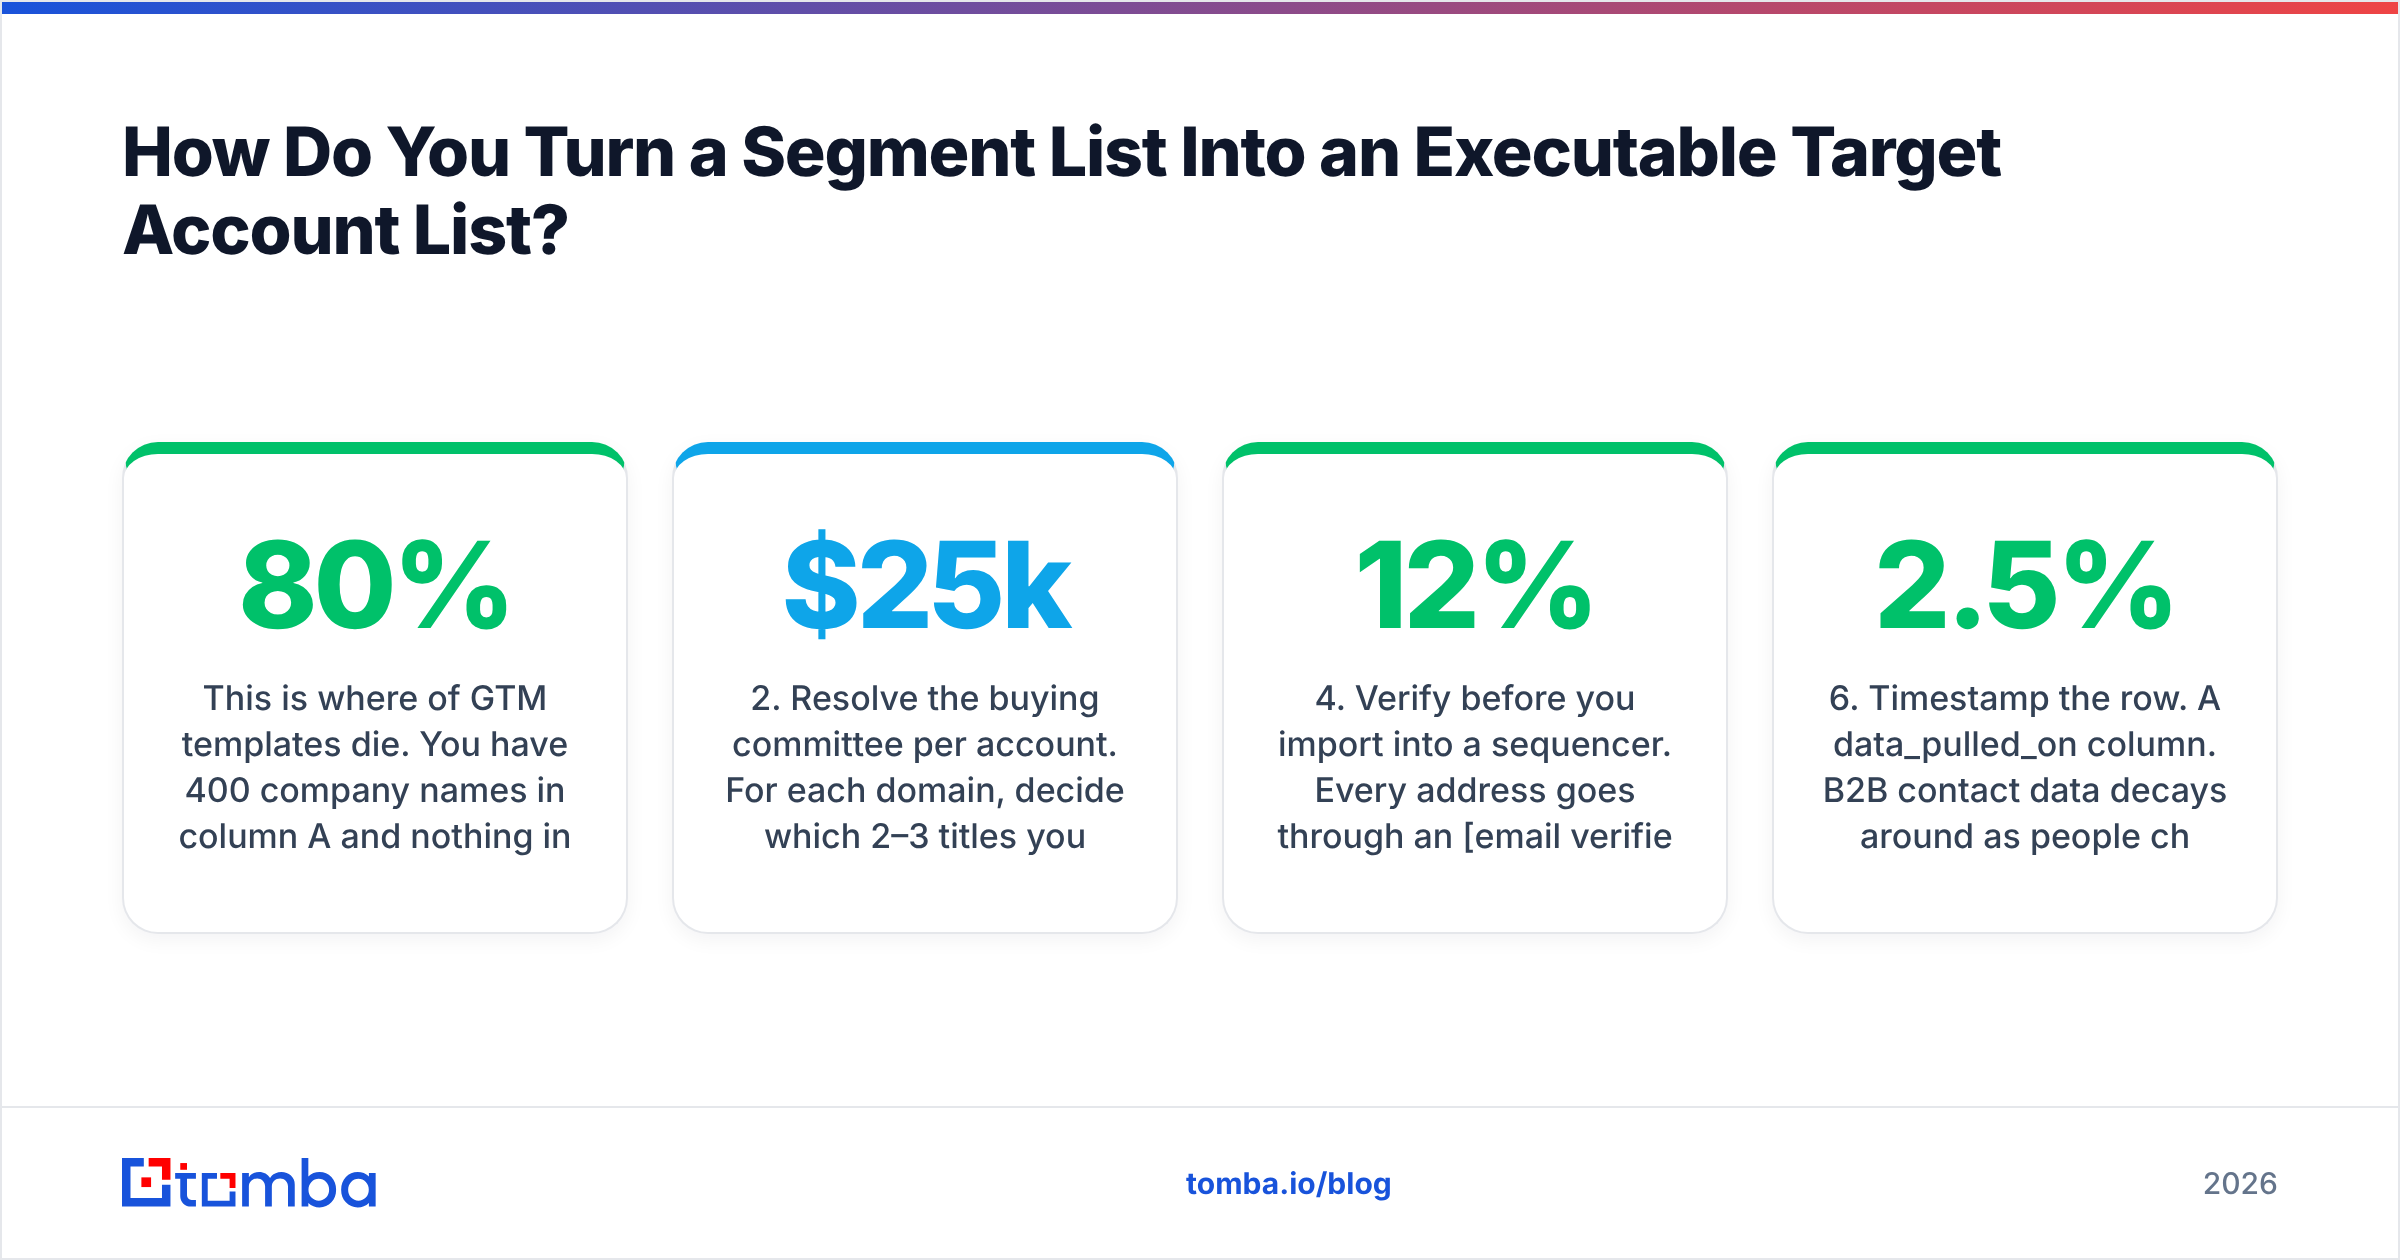
This is where 80% of GTM templates die. You have 400 company names in column A and nothing in columns D through H.
The sequence that works:
- Define the account, not the company. Filter your segment on the ICP tab, then export the matching companies with their domains. Domain is the join key for everything downstream — never build the list on company name alone, because "Acme Inc", "Acme, Inc." and "ACME" will fragment your data.
- Resolve the buying committee per account. For each domain, decide which 2–3 titles you need. Not one — a single champion who goes on parental leave kills the account. Two titles minimum, three for anything above $25k ACV.
- Populate contact data at scale. Run the domain list through a domain search to pull the people and email patterns at each company, then fill the name/title/email columns. Doing this by hand is roughly four minutes per account; at 400 accounts that's 26 hours you don't have.
- Verify before you import into a sequencer. Every address goes through an email verifier and gets a status column: valid, catch-all, risky, invalid. Filter to valid + reviewed catch-all before launch. A 12% bounce rate on a new domain will damage your sender reputation for months.
- Add a tier and an owner. Tier 1 gets manual research and a personalized first line. Tier 3 gets a template. Never let an untiered list into a sequencer — you'll spend Tier 1 effort on Tier 3 accounts.
- Timestamp the row. A
data_pulled_oncolumn. B2B contact data decays around 2.5% per month as people change jobs; a list you built in January is measurably worse in June.
If you work in Excel natively, the Excel email finder add-in lets you fill the email column with a formula rather than a CSV round-trip, which matters when your list is a living tab and not a one-off export.
Excel vs. Google Sheets vs. a Dedicated GTM Tool — Which Should You Use?#
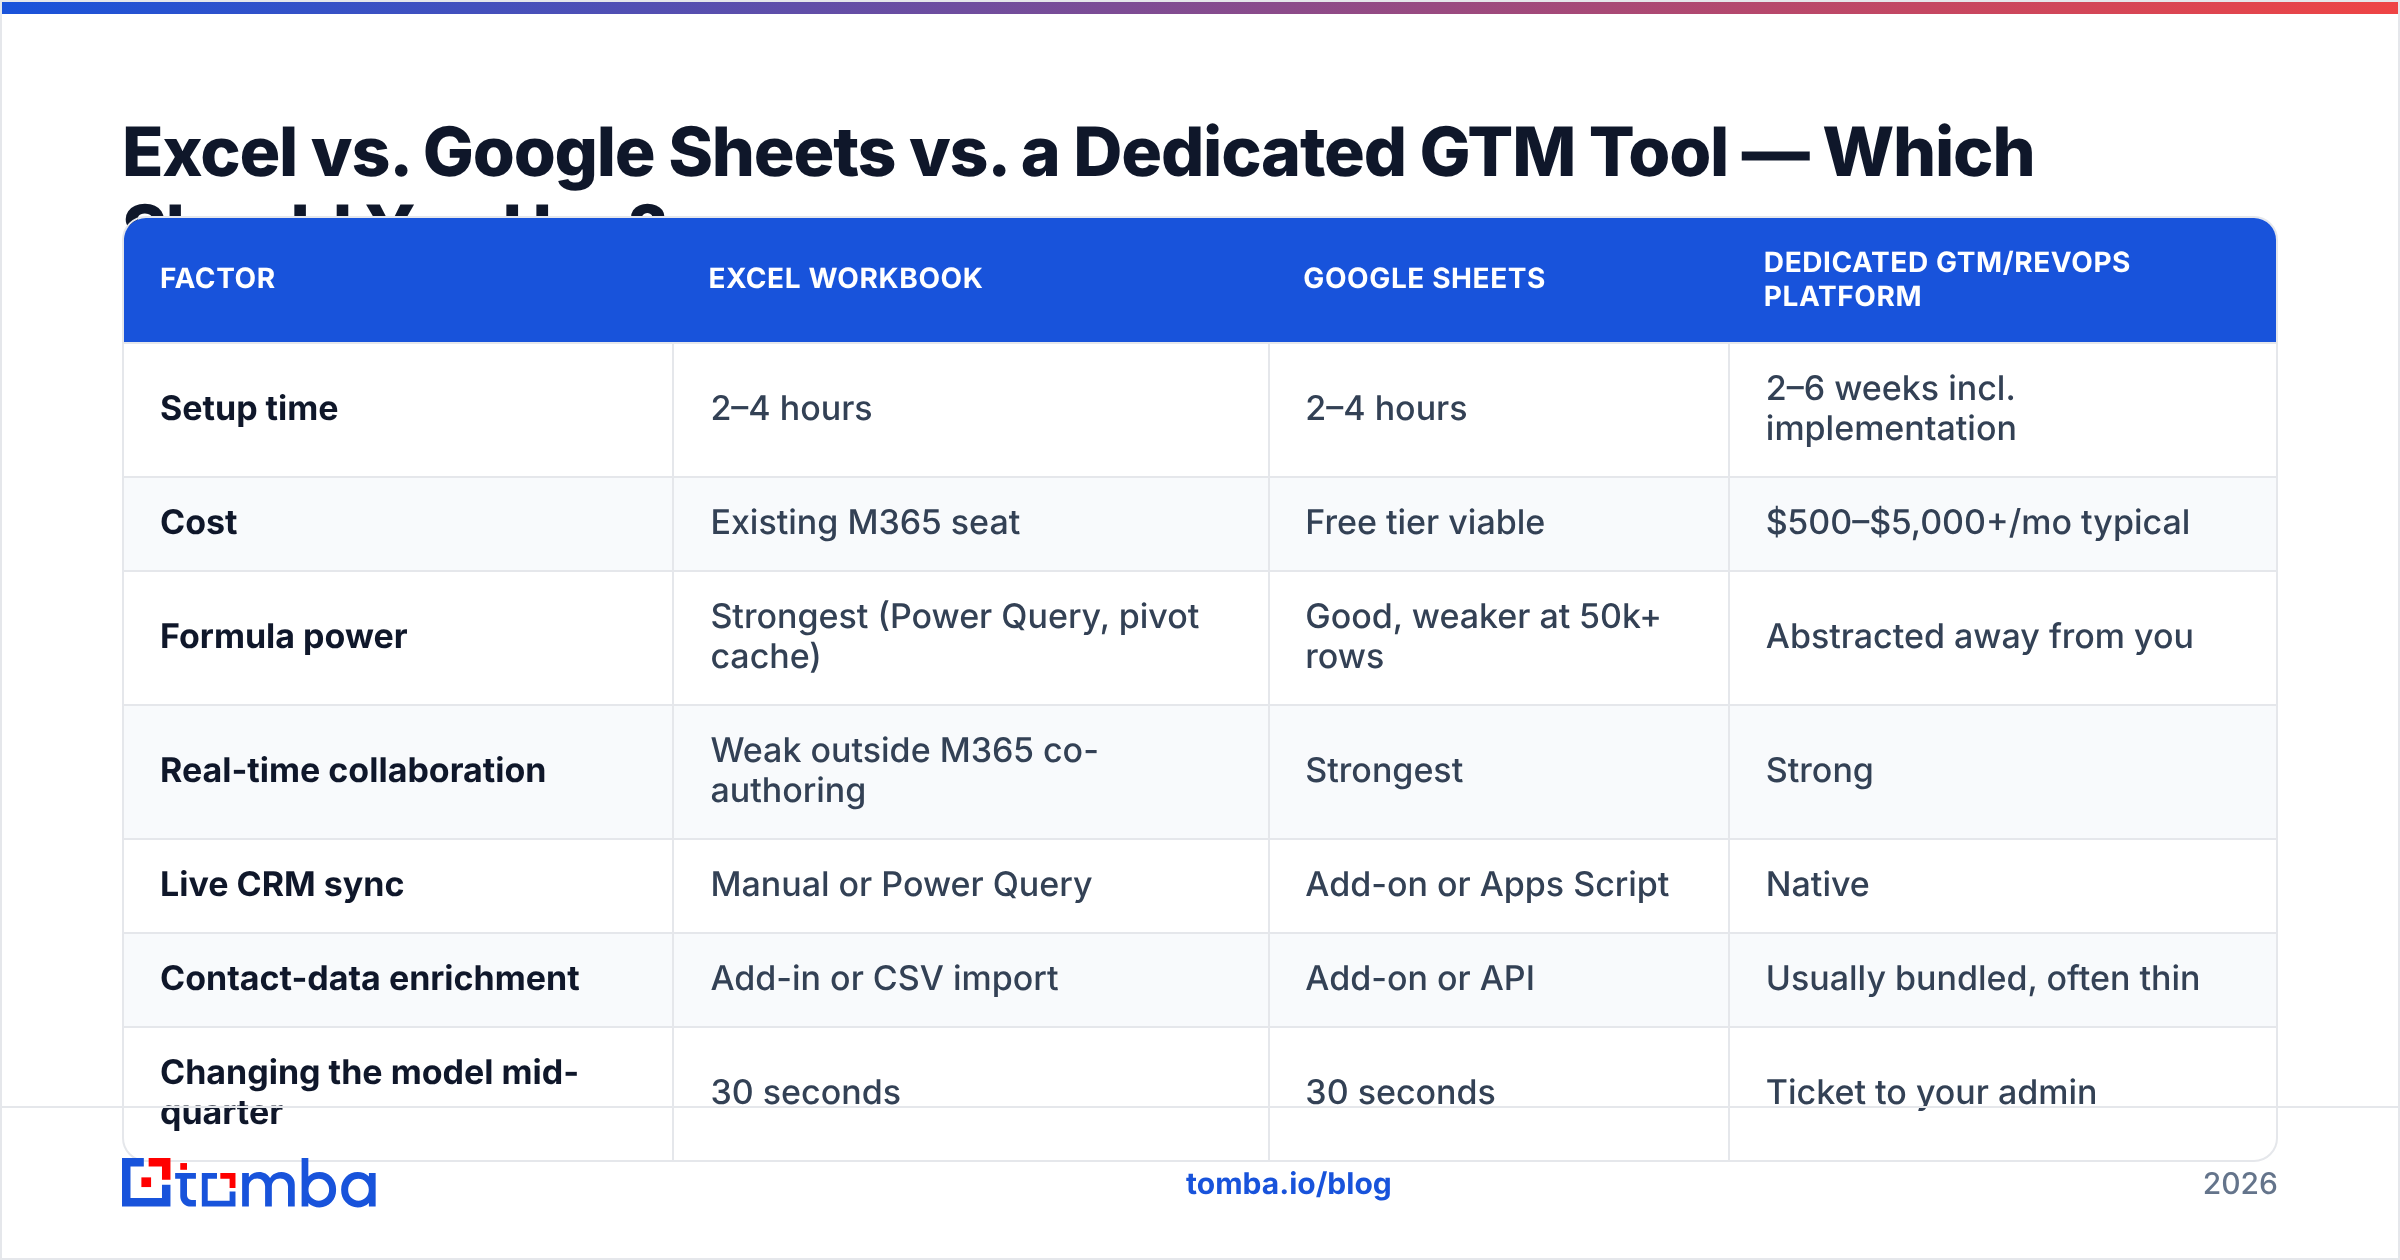
The honest answer depends on how often your motion is still changing. Here's the comparison most posts skip:
| Factor | Excel workbook | Google Sheets | Dedicated GTM/RevOps platform |
|---|---|---|---|
| Setup time | 2–4 hours | 2–4 hours | 2–6 weeks incl. implementation |
| Cost | Existing M365 seat | Free tier viable | $500–$5,000+/mo typical |
| Formula power | Strongest (Power Query, pivot cache) | Good, weaker at 50k+ rows | Abstracted away from you |
| Real-time collaboration | Weak outside M365 co-authoring | Strongest | Strong |
| Live CRM sync | Manual or Power Query | Add-on or Apps Script | Native |
| Contact-data enrichment | Add-in or CSV import | Add-on or API | Usually bundled, often thin |
| Changing the model mid-quarter | 30 seconds | 30 seconds | Ticket to your admin |
| Auditability of assumptions | Excellent — you see every cell | Excellent | Poor — logic is hidden |
| Breaks at | ~100k rows | ~50k rows | Rarely |
Pick Excel when your ICP is still moving, your team is under ten people, and you need to explain the model to a board. Pick Sheets when three people edit simultaneously and your row count is modest — the Google Sheets email finder add-on covers the enrichment gap. Move to a platform when the model has been stable for two quarters and the bottleneck is data sync, not thinking.
Most teams migrate too early, buy a $30k platform to model a motion they haven't validated, and end up exporting to Excel anyway to do the actual thinking.
What Formulas Make the Template Self-Updating?#
Four patterns cover almost everything you need.
Reverse funnel from a revenue target. Put the target in one cell and derive the required volume backward:
=ROUNDUP(Target_Revenue / Avg_Deal_Size / Win_Rate / Opp_Rate / Meeting_Rate / Reply_Rate, 0)
That's your required contacts touched. When it returns 84,000 for a two-SDR team, you've learned something important before spending a dollar.
Capacity check as a hard flag. In the Capacity Model tab:
=IF(Required_Touches > (Reps * Working_Days * Touches_Per_Day), "OVER CAPACITY", "OK")
Conditional-format that cell red. It's the only alarm in the workbook that should be impossible to ignore.
Ramp-weighted rep output. New reps don't produce at 100% on day one. Multiply each rep's monthly output by a ramp factor — 0.25, 0.5, 0.75, 1.0 across four months — instead of assuming instant productivity. This single correction is why most launch plans miss Q1 and hit Q3.
Weekly variance with a rolling window. =AVERAGE(OFFSET(actual_range,COUNT(actual_range)-4,0,4,1)) gives you a four-week trailing average that ignores blank future weeks, so your scorecard doesn't read as "0% to plan" every Monday morning.
Keep every one of these referencing the Assumptions tab. If a stakeholder asks "what if the win rate is 15%?", you should be able to answer live, in the meeting, by typing one number.

Why Do Most GTM Templates Fail by Week Three?#
Five reliable causes, roughly in order of frequency.
- No owner per row. Every account, channel, and weekly metric needs a named human. "The team" owns nothing.
- The target account list has no contacts. A list of logos is a wish, not a plan. This is the enrichment gap described above and it's the most common single cause.
- Actuals never get entered. If updating the scorecard takes more than ten minutes on Monday, it won't happen in week three. Design for a ten-minute update: paste one CRM export, everything else calculates.
- TAM math that nobody believes. A top-down "1% of a $4B market" line kills credibility. Build bottom-up: countable accounts × realistic penetration × your actual deal size. If the bottom-up number embarrasses you, that's information.
- The template models an ideal quarter, not a real one. No holidays, no ramp, no churn in the SDR seat, no product delay. Add a 15% friction discount to any first-launch plan and you'll be closer than the optimists.
There's a sixth, subtler one: the workbook models activity but not conversion quality. Hitting 100% of planned sends with a 0.4% reply rate is not success — it's an expensive way to burn a domain. Track quality metrics (response rate, meeting-held rate) with the same prominence as volume.
How Do You Keep the Data in the Template Fresh?#
Set a decay policy and automate the refresh, or accept that the workbook has a shelf life of about one quarter.
A workable cadence:
- Weekly: paste CRM actuals into the Scorecard tab. Ten minutes, same person, same time.
- Monthly: re-verify any contact in the target list that has been emailed and never opened. Job changes look like disengagement.
- Quarterly: re-pull the full target account list, compare against last quarter, and flag new-hire changes in target titles. New executives in a target role are the strongest buying signal you can get cheaply.
- On launch: verify 100% of the list. Not a sample.
If you'd rather not run this by hand, the Tomba API can drive the refresh from a script or a scheduled job and write results straight back into the sheet's source CSV. For teams already in a CRM, syncing enriched data through the HubSpot integration keeps the workbook and the CRM from drifting apart — the drift is what eventually makes people stop trusting the model.
One more discipline: version the workbook by quarter. GTM_Model_2026Q1.xlsx, not GTM_Model_final_v3_REAL.xlsx. You want to compare what you predicted against what happened, and that requires a frozen copy.
What Does a Finished Template Look Like in Practice?#
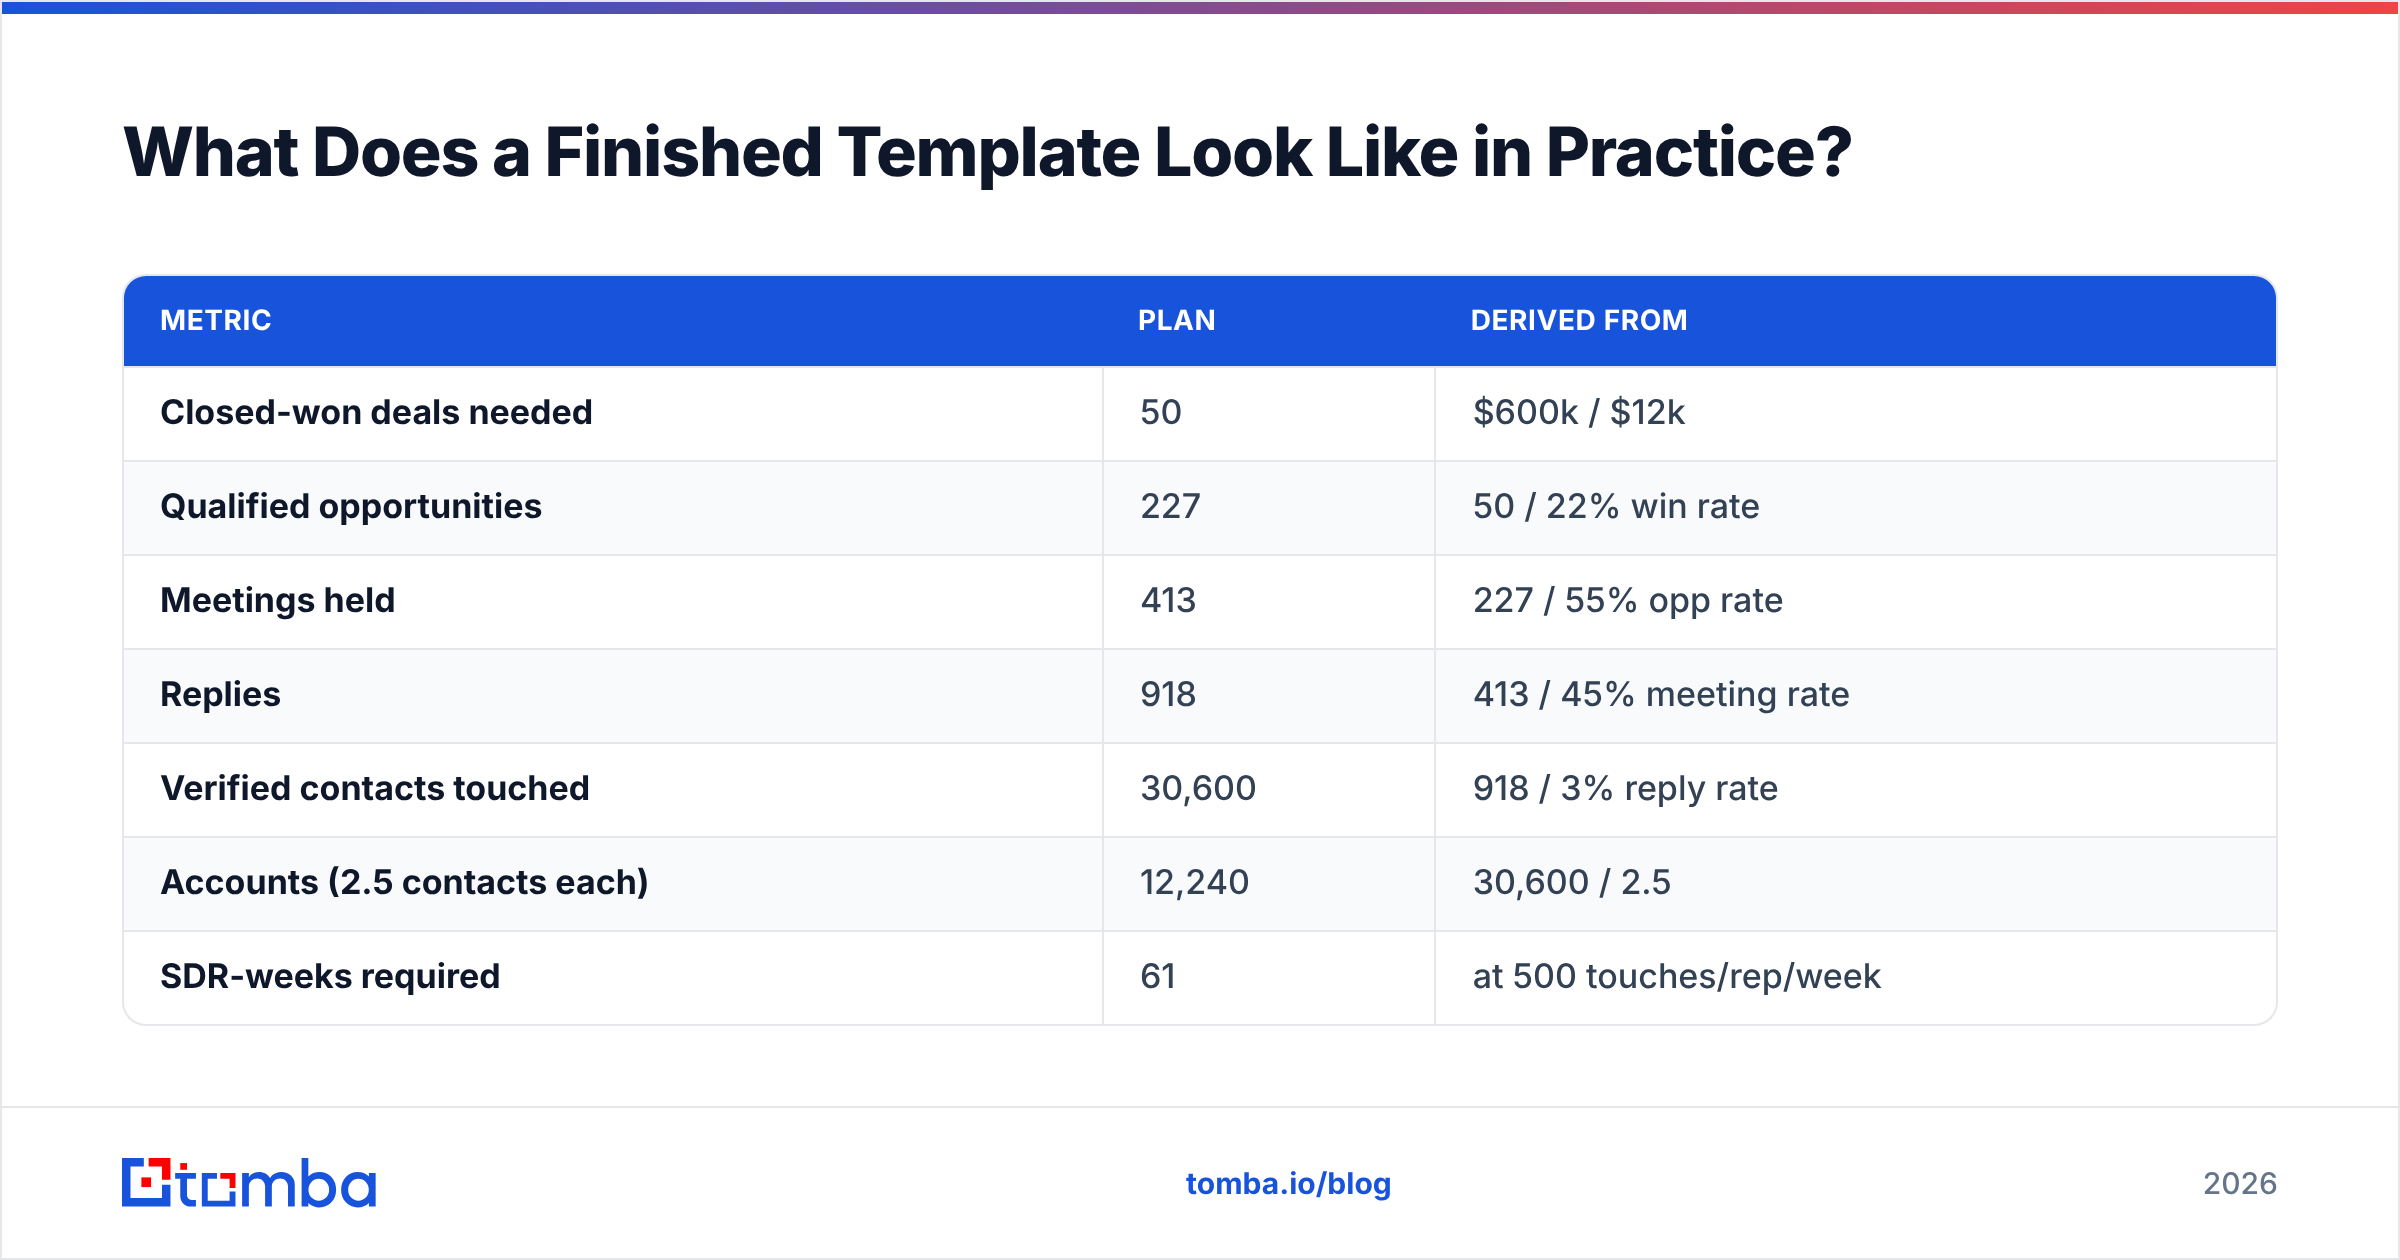
A useful gut check — for a team targeting $600k of new ARR in two quarters at a $12k average deal size:
| Metric | Plan | Derived from |
|---|---|---|
| Closed-won deals needed | 50 | $600k / $12k |
| Qualified opportunities | 227 | 50 / 22% win rate |
| Meetings held | 413 | 227 / 55% opp rate |
| Replies | 918 | 413 / 45% meeting rate |
| Verified contacts touched | 30,600 | 918 / 3% reply rate |
| Accounts (2.5 contacts each) | 12,240 | 30,600 / 2.5 |
| SDR-weeks required | 61 | at 500 touches/rep/week |
That last row is the punchline. Sixty-one SDR-weeks across 26 calendar weeks means you need roughly 2.4 fully-ramped reps — so with ramp, three hires starting now. If you only planned for two, the model just told you the launch misses before you sent a single email.
It also tells you that you need 12,240 accounts with verified contacts, which is a data problem, not a sales problem. That's the conversation the Excel model forces and the slide deck avoids.
Where Should You Start?#
Build the Assumptions tab first, the Target Account List second, and everything else after. Most people do it backwards — they design a beautiful Scorecard for data they don't have yet.
The gating constraint is almost always contact data. A GTM model with 12,000 accounts and no verified emails is a spreadsheet, not a strategy. Start with a domain list, resolve the buying committee, verify every address, and then let the formulas tell you whether the plan is achievable.
Fill the columns that make the model executable. Tomba's Email Finder turns a domain and a name into a verified professional email, works directly inside Excel and Google Sheets, and starts free at 25 searches a month so you can test the workflow on a single segment before committing. Paid plans start at $49/mo (Starter), $99/mo (Growth), and $249/mo (Pro) — see the Tomba pricing page for credit volumes. Build the target account list once, verify it properly, and the rest of the template starts doing its job.
Related guides#
Ready to find emails that actually work?
Join 150,000+ professionals who stopped guessing and started sending. Free credits on signup — no credit card required.
Get the Tomba newsletter
Practical outbound tactics and product updates — once every two weeks.
About the author