Go To Market Team: Roles, Structure, and 2026 Playbook
A go to market team is the cross-functional group that turns a product into revenue. Here is how the roles, structures, budgets, and data stack actually fit together in 2026.
TL;DR
- A go to market team is the cross-functional unit — sales, marketing, RevOps, product marketing, customer success, and increasingly data engineering — accountable for one number: revenue from a defined segment.
- Most GTM teams fail at handoffs, not at hiring. Lead-to-SDR, SDR-to-AE, and AE-to-CS are where pipeline leaks the fastest.
- Four structures dominate in 2026: functional silos, the pod (or "GTM squad"), the RevOps-led hub, and the product-led hybrid. Each has a headcount floor below which it stops working.
- Budget reality: a fully loaded 5-person GTM pod runs roughly $55K–$85K/month in salary alone. Tooling is 4–8% of that. Bad contact data is the cheapest thing to fix and the most expensive thing to ignore.
- Measure the team on pipeline coverage, segment win rate, and CAC payback — not on activity counts.
What is a go to market team?#
A go to market team is the group of people accountable for taking a specific product to a specific segment and converting that segment into paying, retained customers. It is not "the sales team." Sales is one seat at the table.
Think of it like a restaurant kitchen during service. The line cook (AE) is the one who plates the dish the customer sees, but the dish only leaves the pass because prep (marketing), the expediter (RevOps), the menu designer (product marketing), and the front of house (customer success) all ran on the same ticket. If prep runs out of an ingredient at 7pm, the AE's plating skill is irrelevant.
Technically: a GTM team is a cross-functional revenue unit with shared targets, a shared definition of an ideal customer profile (ICP), and a shared data layer. The last one is what separates a real GTM team from a group of departments that sit near each other.
Here is the standard role map for a mid-market B2B SaaS company:
- GTM lead / CRO — owns the number, arbitrates between segments, and decides where the next dollar of headcount goes. Usually the only person who sees the full funnel without filtering.
- Demand generation — paid, organic, events, and lifecycle. Accountable for sourced pipeline, not MQL volume. If they are still reporting on raw marketing qualified lead counts, the incentives are broken.
- Product marketing — positioning, competitive intelligence, sales enablement content, launch orchestration. The most under-hired role on this list.
- SDR / BDR — outbound prospecting and inbound qualification. Owns meetings booked and, in better setups, meetings held.
- Account executive — discovery through close. Owns win rate and average contract value.
- RevOps — the systems, data, routing rules, forecast hygiene, and attribution model. In 2026 this function is increasingly the center of gravity rather than a support role.
- Customer success / post-sale — onboarding, expansion, and churn prevention. Their input into ICP definition is usually the highest-signal data the team has and the least-used.
Why do most go to market teams underperform?#
Because the org chart is complete and the handoff map is not.
Gartner's research on B2B buying behavior has consistently shown that buyers spend a minority of their purchase journey with any single supplier's sales reps — most of the process happens in independent research and internal consensus-building (Gartner's B2B buying journey research). If your GTM team is designed around rep-controlled conversations, you're optimizing a small slice of the actual decision.
Three failure patterns show up over and over:
Failure 1 — The definition drift. Marketing's ICP is "companies with 50–500 employees in fintech." Sales' working ICP is "whoever answers." CS's ICP, derived from who actually renews, is "series B fintech with an in-house data team." Three ICPs, one team, no alignment. Run a quarterly exercise where CS presents the retention-weighted ICP and let that override the aspirational one.
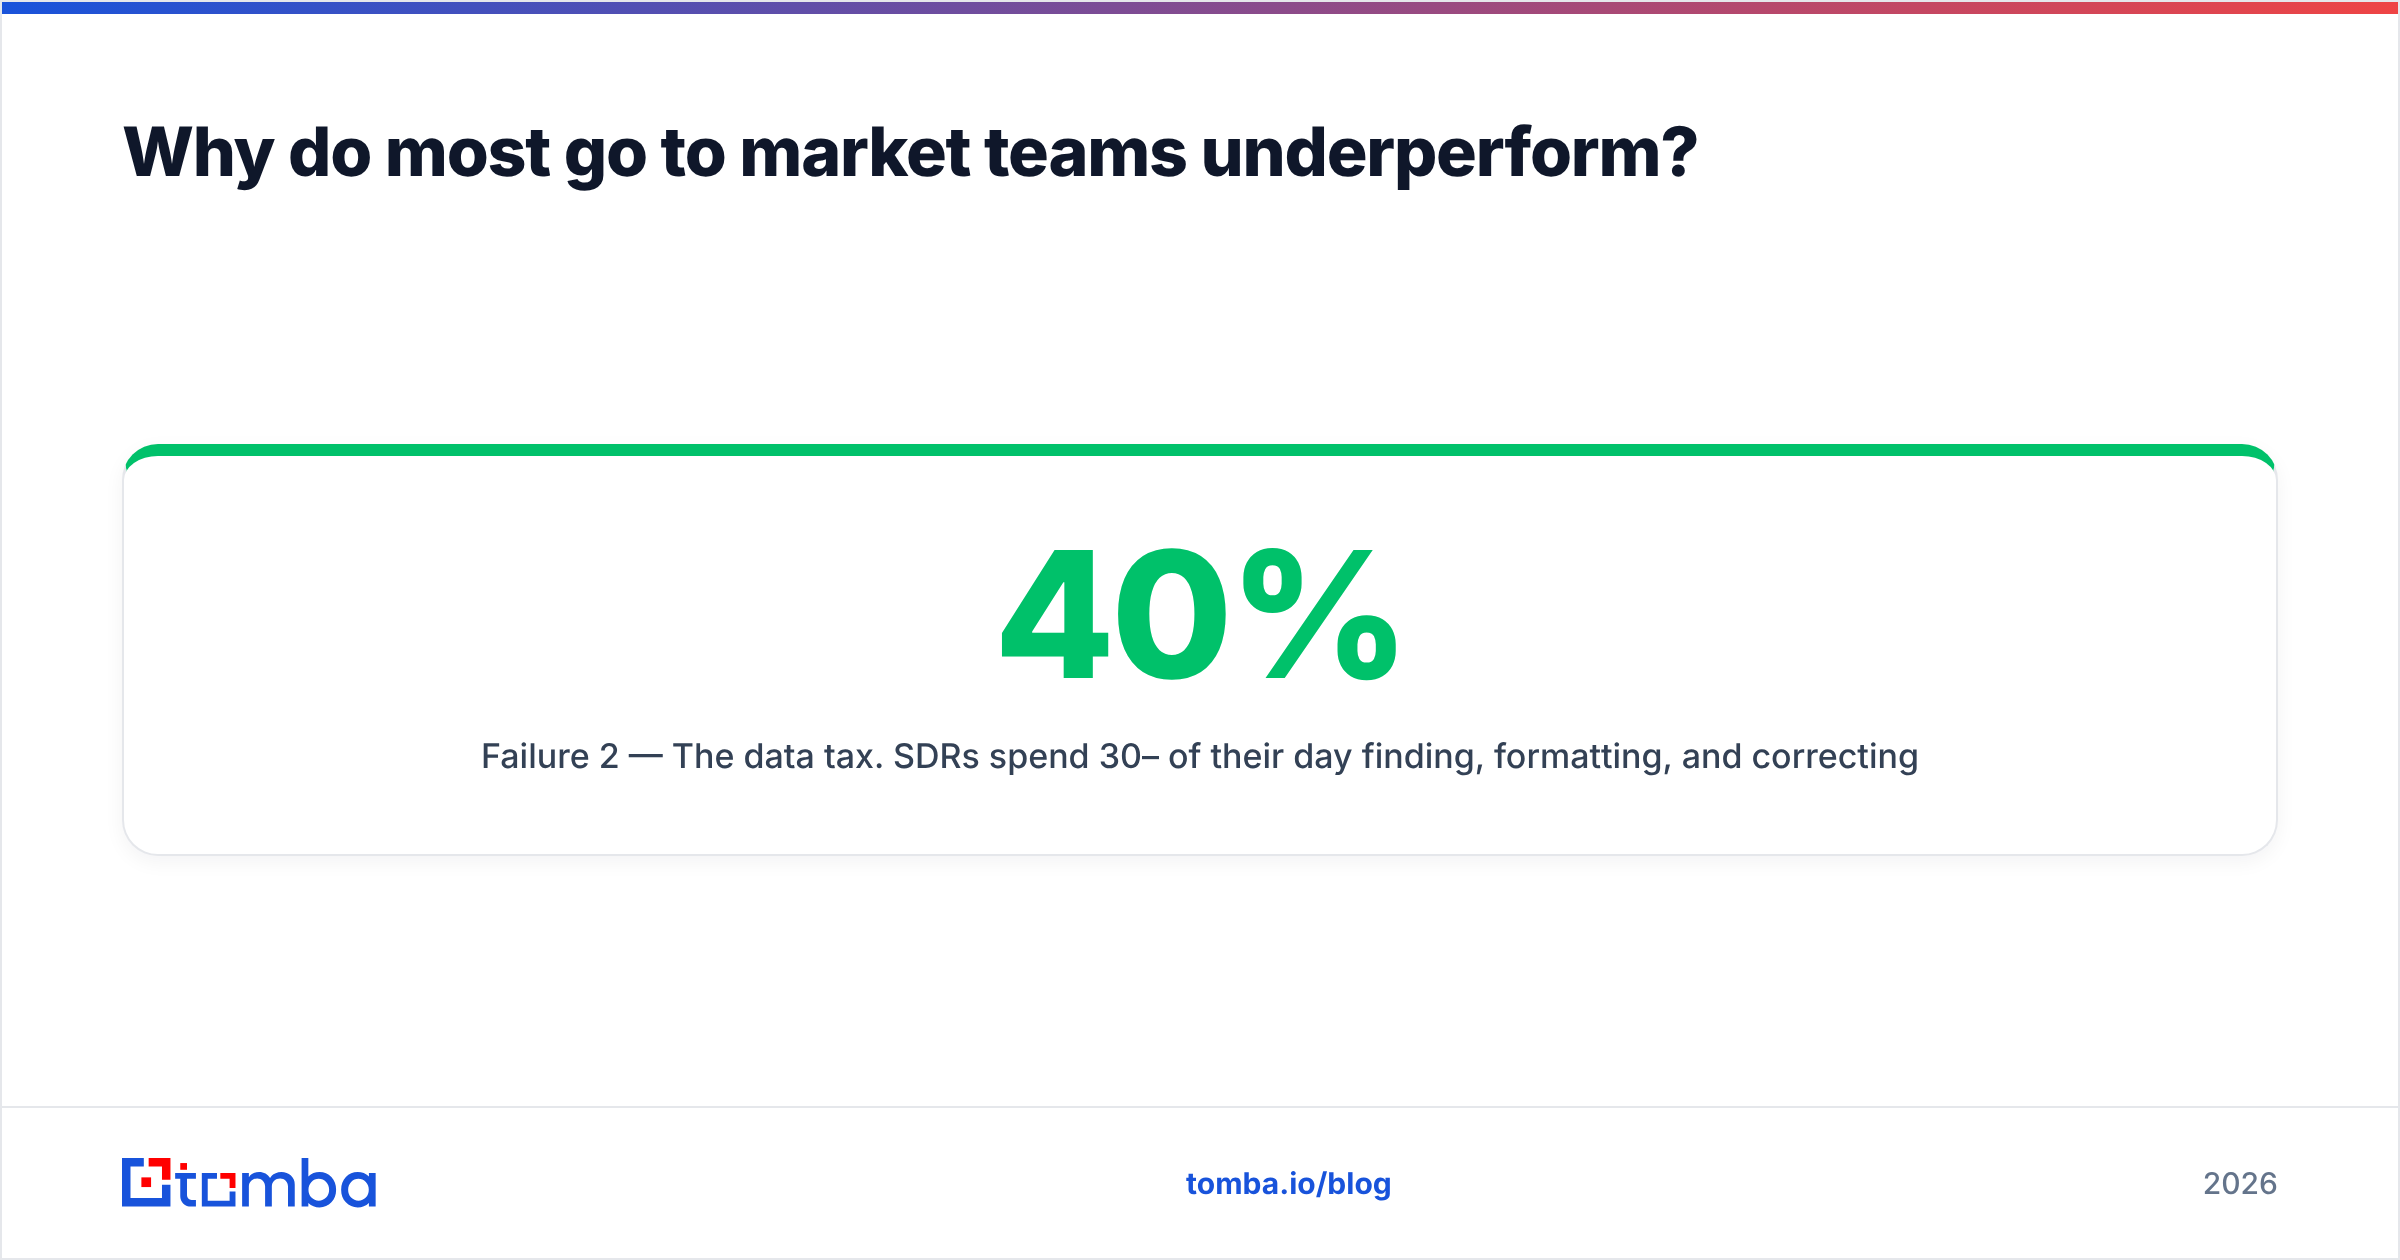
Failure 2 — The data tax. SDRs spend 30–40% of their day finding, formatting, and correcting contact data. That is a research job being performed by a job that costs $60K–$80K fully loaded. The fix is boring and structural: centralize enrichment, verify before send, and let reps touch only clean records. Tools like a bulk email finder or an email verifier exist precisely so that the human hours go to conversation instead of spreadsheet janitorial work.
Failure 3 — The metric mismatch. SDRs are paid on meetings booked, AEs on closed revenue, marketing on MQLs, CS on NRR. Four scoreboards, four behaviors. The moment an SDR is compensated on meetings booked rather than pipeline created, you have paid for no-shows.
What are the four go to market team structures?#
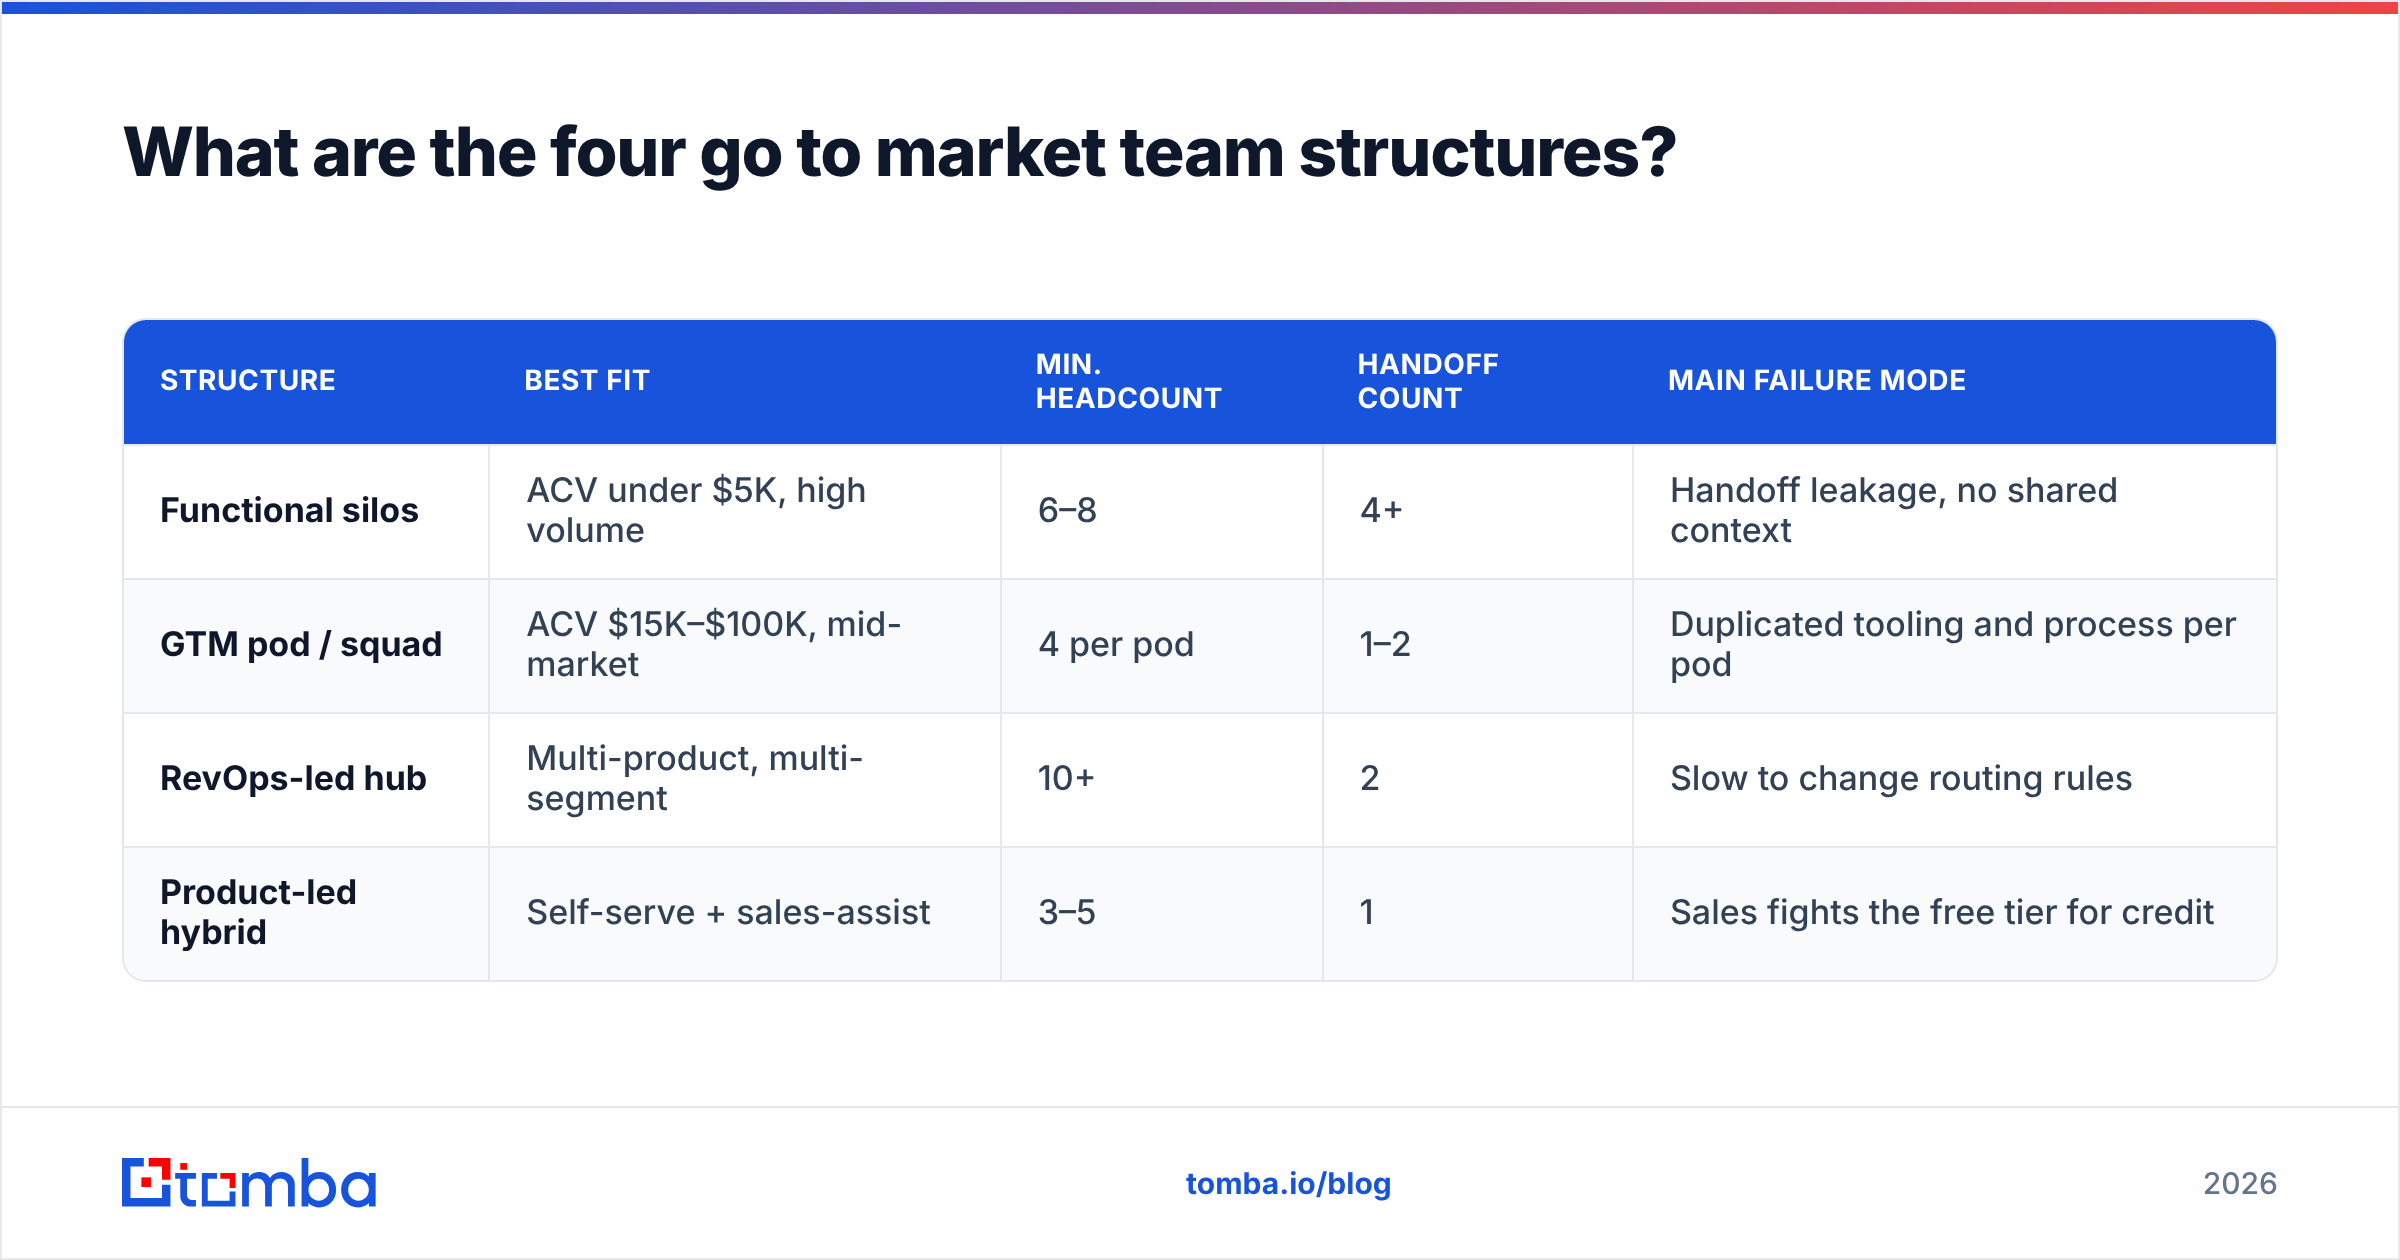
Pick the structure that matches your ACV and deal complexity, not the one your last company used.
| Structure | Best fit | Min. headcount | Handoff count | Main failure mode |
|---|---|---|---|---|
| Functional silos | ACV under $5K, high volume | 6–8 | 4+ | Handoff leakage, no shared context |
| GTM pod / squad | ACV $15K–$100K, mid-market | 4 per pod | 1–2 | Duplicated tooling and process per pod |
| RevOps-led hub | Multi-product, multi-segment | 10+ | 2 | Slow to change routing rules |
| Product-led hybrid | Self-serve + sales-assist | 3–5 | 1 | Sales fights the free tier for credit |
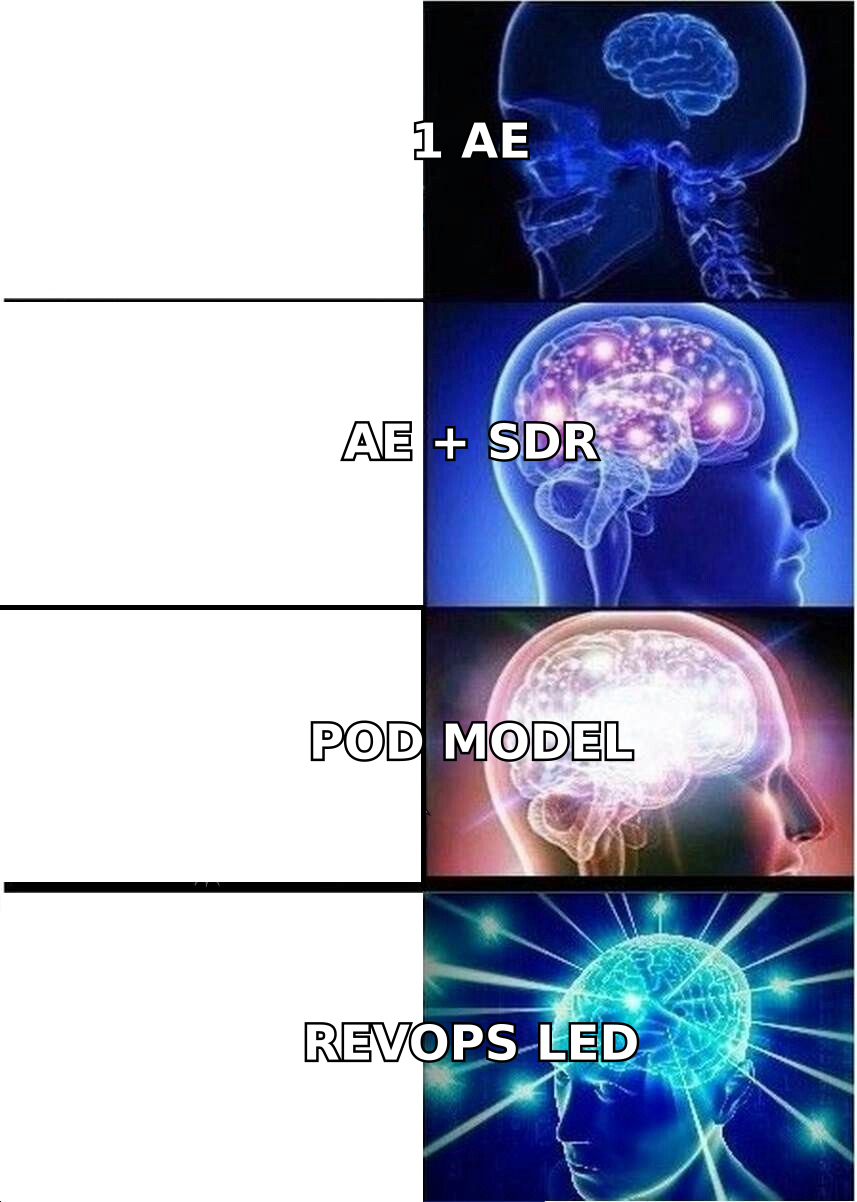
Functional silos are the default: a marketing team, an SDR team, an AE team, a CS team, each with its own manager. It scales headcount well and context poorly. Every handoff is a place where the buyer repeats themselves.
The GTM pod assigns one AE, one or two SDRs, a fractional marketer, and a CS contact to a single segment or territory. Everyone in the pod shares a pipeline target. This is the structure most $10M–$50M ARR companies converge on because it kills the biggest handoff without adding management layers. The cost is duplication: three pods means three people asking for the same tool.
The RevOps-led hub puts systems and data at the center. Routing, scoring, enrichment, and forecasting are centrally owned; sales and marketing consume from that layer rather than each maintaining their own. This is heavier and slower to spin up, but it is the only model that survives multi-product complexity without the forecast becoming fiction. It leans hard on revenue operations maturity.
The product-led hybrid runs self-serve acquisition alongside a small sales-assist motion that intercepts high-intent accounts. It has the fewest handoffs and the hardest attribution problem. The perennial fight is whether a self-serve signup that later upgrades counts as sales-sourced.
How do you staff a go to market team by company stage?#
Headcount decisions should follow deal size and sales cycle length, not revenue milestones alone. Here is a working sequence:
- Pre-$1M ARR — founder-led sales plus one generalist marketer. Do not hire an SDR yet. The founder needs the raw objection data that a junior rep will filter out.
- $1M–$5M ARR — first two AEs, one SDR, one demand gen. Add a part-time or contract RevOps resource before you think you need one; retrofitting a CRM at $8M ARR is a two-quarter project.
- $5M–$15M ARR — move to pods. Add product marketing (this is the hire companies delay too long) and a dedicated CS lead. First full-time RevOps hire.
- $15M–$50M ARR — segment the pods by ICP tier, add sales enablement, add a data/analytics resource inside RevOps, formalize the forecast cadence.
- $50M+ ARR — specialize aggressively: partner-led motion, expansion AEs, competitive intel, and a GTM systems team that owns the stack as a product.
The ratio worth watching at every stage is SDR-to-AE. For mid-market ACVs, 1:1 is generous, 2:1 is common in high-volume outbound, and 1:2 works when marketing sources most of the pipeline. If your AEs are prospecting more than 20% of their week, either the ratio is wrong or your data pipeline is.
What does a go to market team actually cost?#
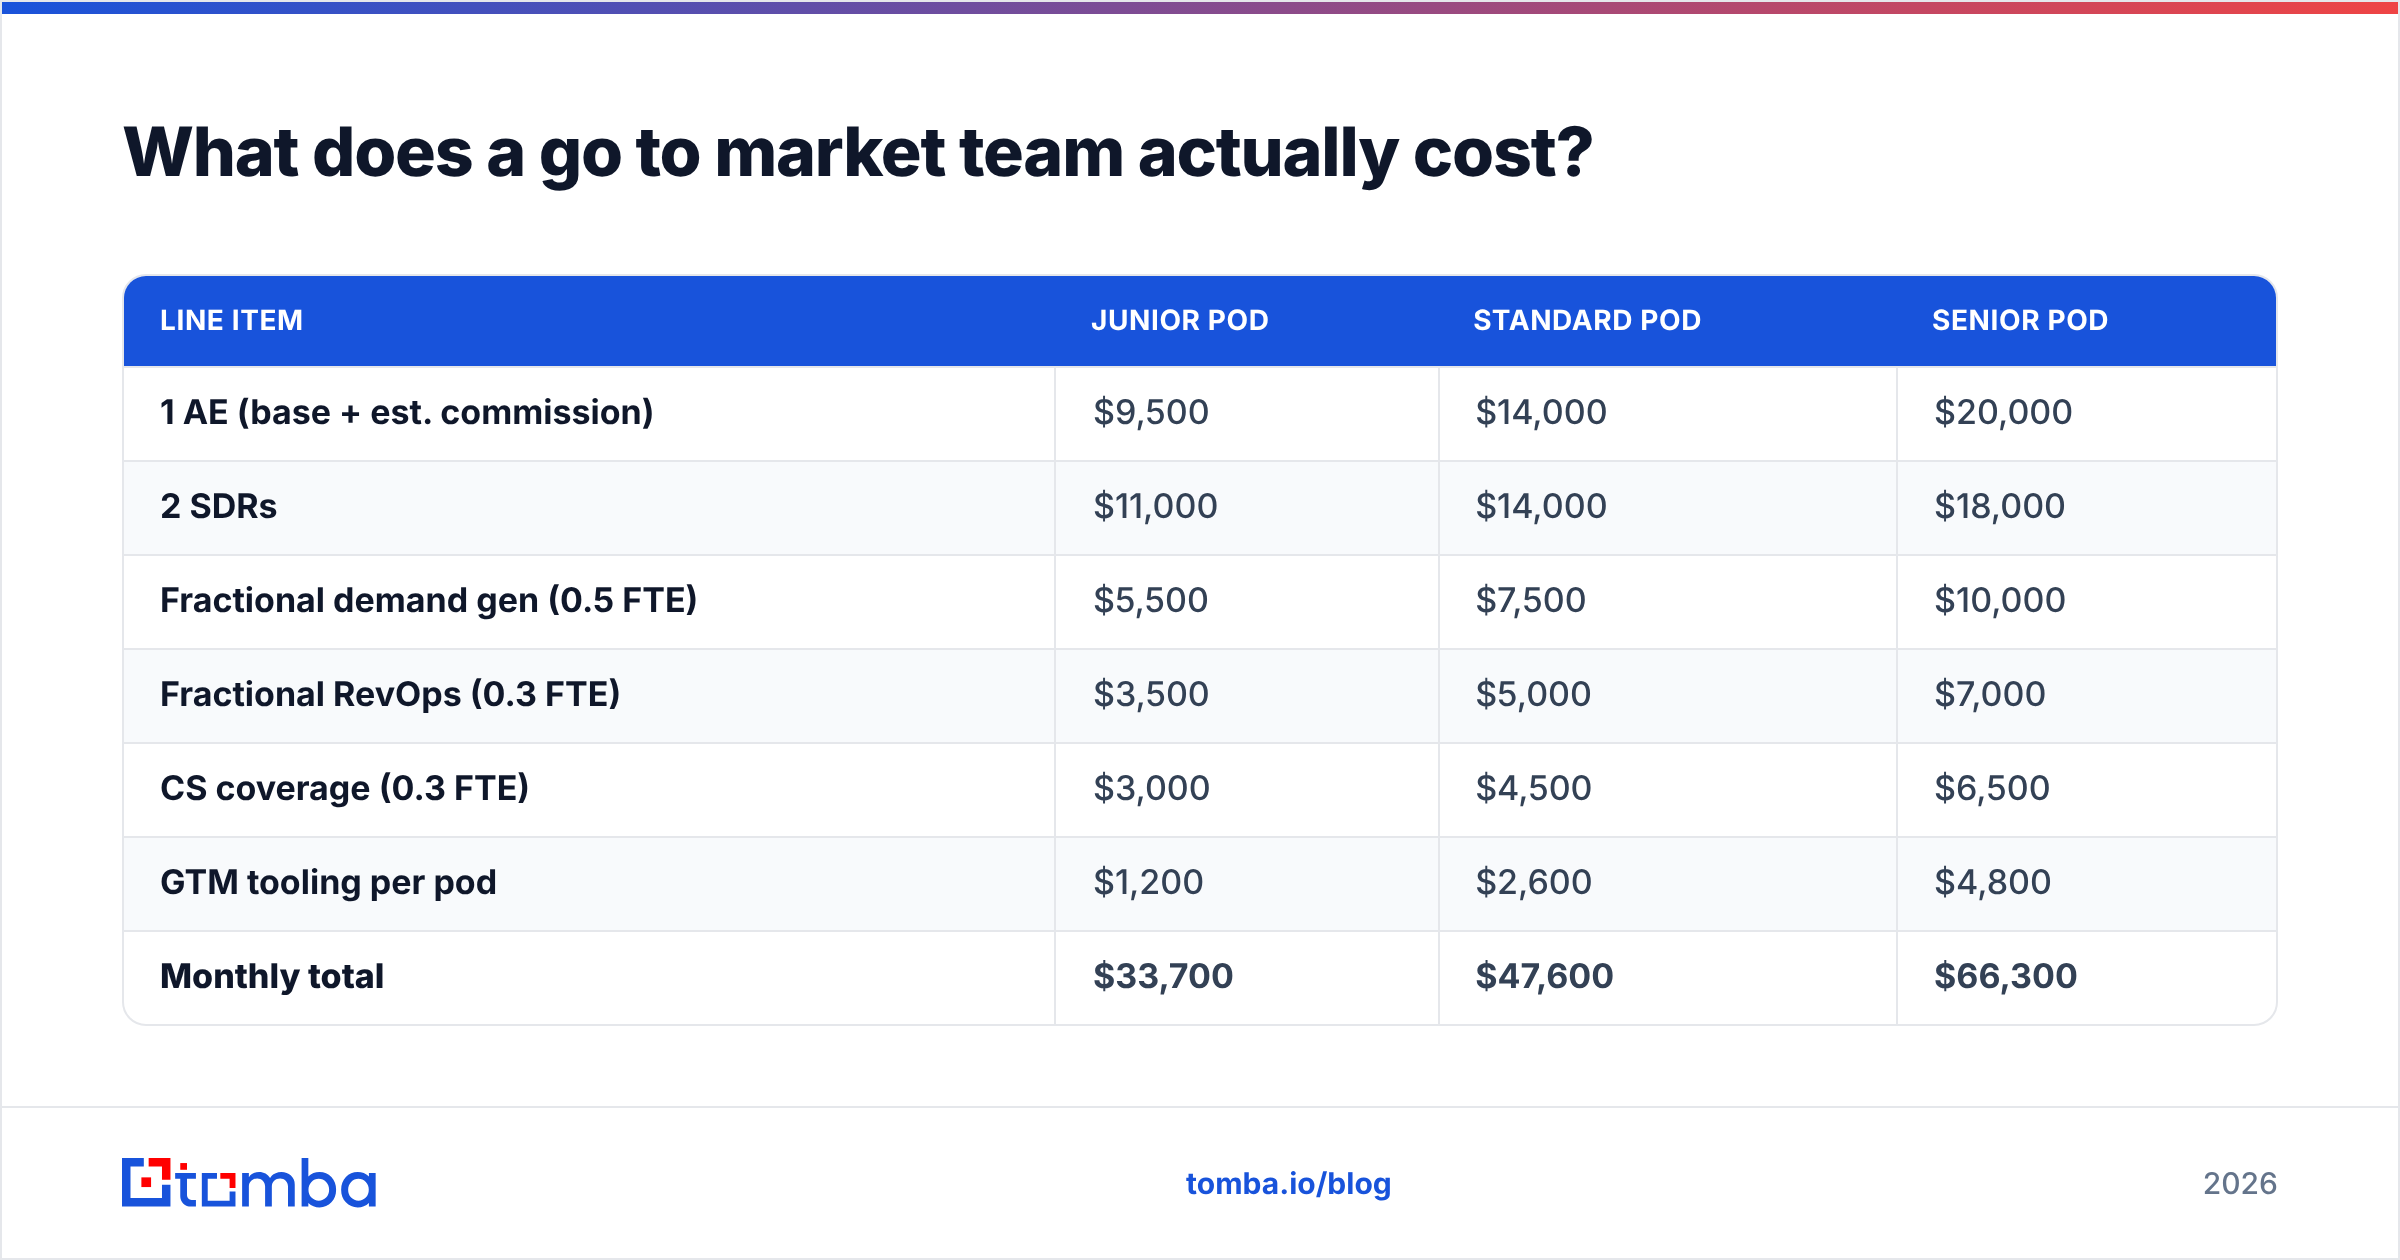
Rough fully loaded North American cost for one mid-market pod, monthly:
| Line item | Junior pod | Standard pod | Senior pod |
|---|---|---|---|
| 1 AE (base + est. commission) | $9,500 | $14,000 | $20,000 |
| 2 SDRs | $11,000 | $14,000 | $18,000 |
| Fractional demand gen (0.5 FTE) | $5,500 | $7,500 | $10,000 |
| Fractional RevOps (0.3 FTE) | $3,500 | $5,000 | $7,000 |
| CS coverage (0.3 FTE) | $3,000 | $4,500 | $6,500 |
| GTM tooling per pod | $1,200 | $2,600 | $4,800 |
| Monthly total | $33,700 | $47,600 | $66,300 |
Tooling is the smallest line and the one most likely to be cut first — which is backwards. If a $250/month data tool saves each SDR six hours a week, it returns roughly $2,800/month in recovered selling time per rep. The math is not close.
Where the tooling budget usually goes: CRM ($75–$165/user/mo for most Salesforce or HubSpot editions — check HubSpot's current pricing since editions shift), sales engagement ($75–$140/user/mo), and contact data ($49–$249/mo at the team level). On that last line, Tomba pricing starts free at 25 searches/month, then $49/mo Starter, $99/mo Growth, and $249/mo Pro — which is why data enrichment tends to be the cheapest seat at the table rather than the most expensive.
Which metrics should a go to market team be measured on?#
Cut the dashboard to five numbers. Everything else is diagnostic, not directional.
- Pipeline coverage ratio — open pipeline divided by the quarter's target. Below 3x for mid-market, you are already behind and the quarter is decided.
- Segment win rate — win rate sliced by ICP tier, not blended. Blended win rate hides the fact that Tier 1 closes at 34% and Tier 3 at 6%, and that you are spending equal effort on both.
- CAC payback period — months of gross margin needed to recover fully loaded acquisition cost. Under 18 months is healthy for mid-market SaaS; over 24 means the GTM model needs restructuring, not more headcount.
- Meeting-held rate — meetings held divided by meetings booked. Anything under 70% means SDR qualification is theater.
- Net revenue retention — the only number that tells you whether the ICP definition is honest.
Two anti-metrics to remove from the weekly review: raw activity counts (calls, emails sent) and MQL volume. Both are trivially gameable and neither correlates with revenue once you control for list quality. Track response rate by segment instead — it tells you whether the message or the list is the problem.
How does data quality decide GTM team performance?#
More than any other single input, and it is the least glamorous line in the plan.
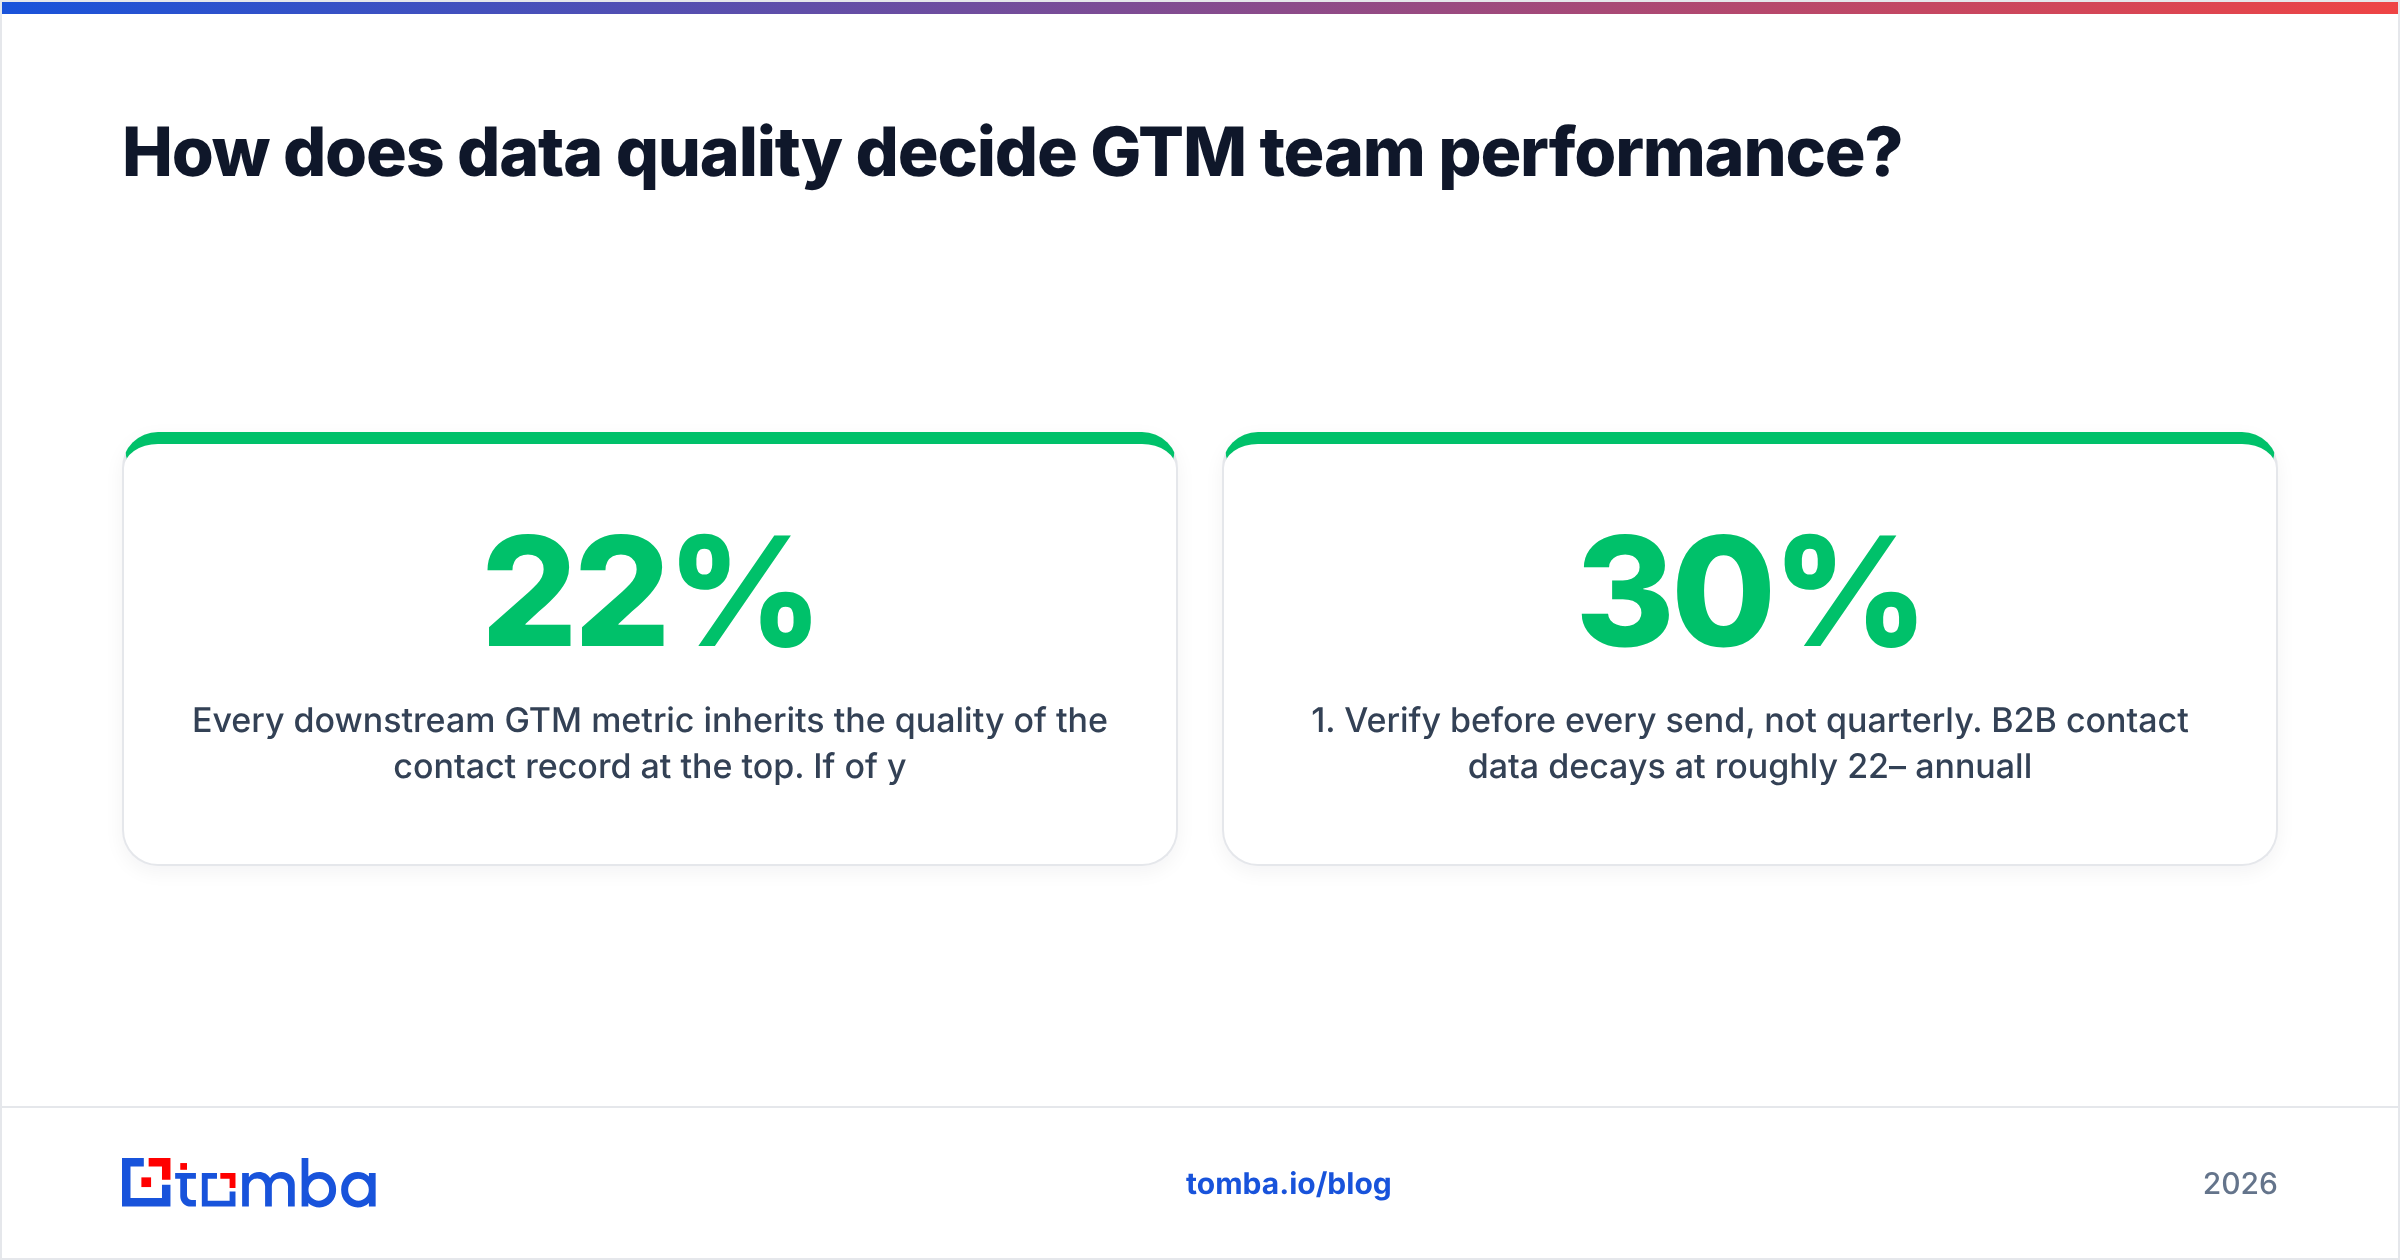
Every downstream GTM metric inherits the quality of the contact record at the top. If 22% of your list bounces, you're not running a 22%-worse campaign — you're burning sending domain reputation, which compounds into worse inbox placement for the valid 78%. That is why email deliverability is a GTM team problem rather than an ops footnote.
A workable data hygiene standard for a GTM team:
- Verify before every send, not quarterly. B2B contact data decays at roughly 22–30% annually as people change roles; a list verified in January is meaningfully wrong by June.
- Enrich at the account level, not just the contact. Firmographic and technographic fields drive routing and scoring. A contact without an account context can't be prioritized.
- Own one source of truth. If SDRs pull from one tool, marketing from another, and CS from the CRM, you have three conflicting realities and no way to audit any of them.
- Handle catch-all domains explicitly. They're a large share of enterprise domains and standard verification returns "unknown." Either use a dedicated catch-all verifier or route those contacts to a phone-first or LinkedIn-first sequence.
- Log rejection reasons. When a record is discarded, capture why. After a quarter you have an empirical ICP exclusion list instead of an opinion.
For teams comparing data vendors, the honest picture in 2026 is that coverage and accuracy vary by geography and segment more than by brand. Providers like BookYourData built strong reputations in verified B2B list-building for specific verticals, while API-first tools optimize for pipeline automation. Check vendor claims against your own segment on G2's data providers category rather than trusting a headline accuracy number, then run a 200-record bake-off with your own ICP before signing anything annual.
How do you run the GTM operating cadence?#
Structure without cadence is an org chart, not a team. The minimum viable rhythm:
- Weekly (60 min) — pipeline council. AE, SDR, marketing, RevOps in one room. Review deals over a threshold, not every deal. Output: named blockers with owners.
- Bi-weekly (30 min) — message review. Product marketing walks through what's landing and what isn't, sourced from actual reply text and lost-deal notes. This is where positioning gets corrected before a full quarter is wasted.
- Monthly (90 min) — segment review. Win rate, CAC payback, and NRR by ICP tier. Decide what to stop selling to.
- Quarterly (half day) — ICP recalibration. CS presents the retention-weighted profile. Marketing and sales adjust targeting. RevOps updates routing and scoring rules the same week, not "next sprint."
The rule that makes this work: every meeting produces either a decision or a deleted meeting. GTM cadences die from becoming status readouts.
What should you fix first?#
If you have limited change capacity this quarter, prioritize in this order:
- Unify the ICP definition — free, one workshop, immediately improves every downstream metric.
- Fix the data layer — cheapest tooling line, largest recovered-hours return.
- Collapse one handoff — usually SDR-to-AE, by moving to pods.
- Rewrite the comp plan to match the shared target — hardest politically, highest leverage.
- Then, and only then, hire. Adding headcount to a broken handoff structure multiplies the leak.
Most teams do this list backwards, starting with hiring because it feels like progress. It is the only item on the list that makes a broken system more expensive.
Getting the data layer right first. Every structure above assumes your reps are working from contact records that are actually correct. If your SDRs are still stitching together email addresses from LinkedIn and guessing at patterns, no org chart will fix the throughput problem. The Tomba Email Finder finds verified professional email addresses by domain, name, or company — with a free tier at 25 searches/month to test against your own ICP before you commit a budget line. Run a 200-record bake-off against whatever you use today, measure the bounce rate difference, and let that number decide.
Related guides#
Ready to find emails that actually work?
Join 150,000+ professionals who stopped guessing and started sending. Free credits on signup — no credit card required.
Get the Tomba newsletter
Practical outbound tactics and product updates — once every two weeks.
About the author