Go-To-Market Transformation: A Practical 2026 Playbook
Most GTM transformations fail because teams rebuild the org chart instead of the data layer. Here's the sequencing, the cost math, and the checkpoints that actually separate a re-org from real change.

TL;DR
- A go to market transformation is a coordinated change to how you segment, target, price, sell, and measure — not a sales re-org with a new deck.
- The failure pattern is consistent: teams change the org chart in month one and the data layer never. Sequence it the other way around.
- Budget 9-18 months for a full-motion change (PLG to sales-led, SMB to enterprise, or single-product to platform). Anything promised in one quarter is a re-org wearing a costume.
- Your contact and account data quality caps the ceiling on everything downstream — routing, scoring, territory design, forecast accuracy.
- Measure the transformation with leading indicators (coverage, meeting rate, cycle stage conversion), not just ARR, or you will not know it failed until it is too late to fix.
What Is a Go-To-Market Transformation?#
A go to market transformation is a deliberate, cross-functional change to the system that connects your product to revenue. It touches five layers at once: which customers you target, how you package and price, which motion you use to reach them, how the team is structured to execute it, and what data and tooling make it measurable.
The word "transformation" gets abused. Hiring three more AEs is not transformation. Renaming SDRs to "GTM Engineers" is not transformation. You are running a real GTM transformation when at least three of these five layers change together and the change is irreversible without significant cost.
Common triggers:
- Motion shift — moving from product-led self-serve to a sales-assisted or enterprise motion (or the reverse, when CAC gets brutal).
- Segment shift — moving upmarket from SMB to mid-market/enterprise, which changes deal size, cycle length, procurement, and the entire prospecting model.
- Pricing model shift — seat-based to usage-based, or perpetual to subscription. This one rewires comp plans, forecasting, and CS at the same time.
- Consolidation — post-merger, where two GTM machines have to become one and duplicate accounts sit in two CRMs.
- Efficiency mandate — the board wants the same revenue at 60% of the sales headcount, so the motion has to become more targeted and more automated.
Why Do Most GTM Transformations Fail?#
They fail because leadership starts with the visible layer and never reaches the invisible one.
The visible layer is the org chart, the territory map, the new logo on the pitch deck. It changes fast, it looks decisive, and it is easy to announce. The invisible layer is your account universe, your contact data, your firmographic enrichment, your routing rules, your definitions of a marketing qualified lead and a stage-two opportunity. That layer changes slowly and nobody gets promoted for fixing it.
Here's the everyday version: it's like renovating a restaurant by redesigning the menu and rehiring the waitstaff while the walk-in freezer is still broken. The dining room looks great. The food still arrives wrong.
Three concrete failure modes we see repeatedly:
Territory design on bad data. You carve territories from a CRM where 30-40% of accounts have wrong employee counts, stale domains, or duplicate records. Reps immediately discover their "book" is half fiction, quotas get missed, and the transformation is blamed for a data problem that predates it.
Enablement without a new pipeline source. The team gets trained on enterprise discovery, MEDDPICC, and multithreading — then goes back to the same SMB-heavy lead list. New skills, old inputs, unchanged results.
Metrics that lag the decision. Leadership tracks ARR and net revenue retention. Both take two to four quarters to move in an enterprise motion. By the time the number tells you the transformation failed, you have burned a year of runway.
Gartner's research on B2B buying behavior — buyers now spend the majority of their journey without a seller present — is the reason the data layer matters more than it used to. If you only get a fraction of the buying group's attention, you cannot afford to reach the wrong person at the wrong company. Read their B2B buying journey research for the underlying data.
What Are the Phases of a Go-To-Market Transformation?#
Sequence matters more than speed. Here is the ordering that survives contact with reality.
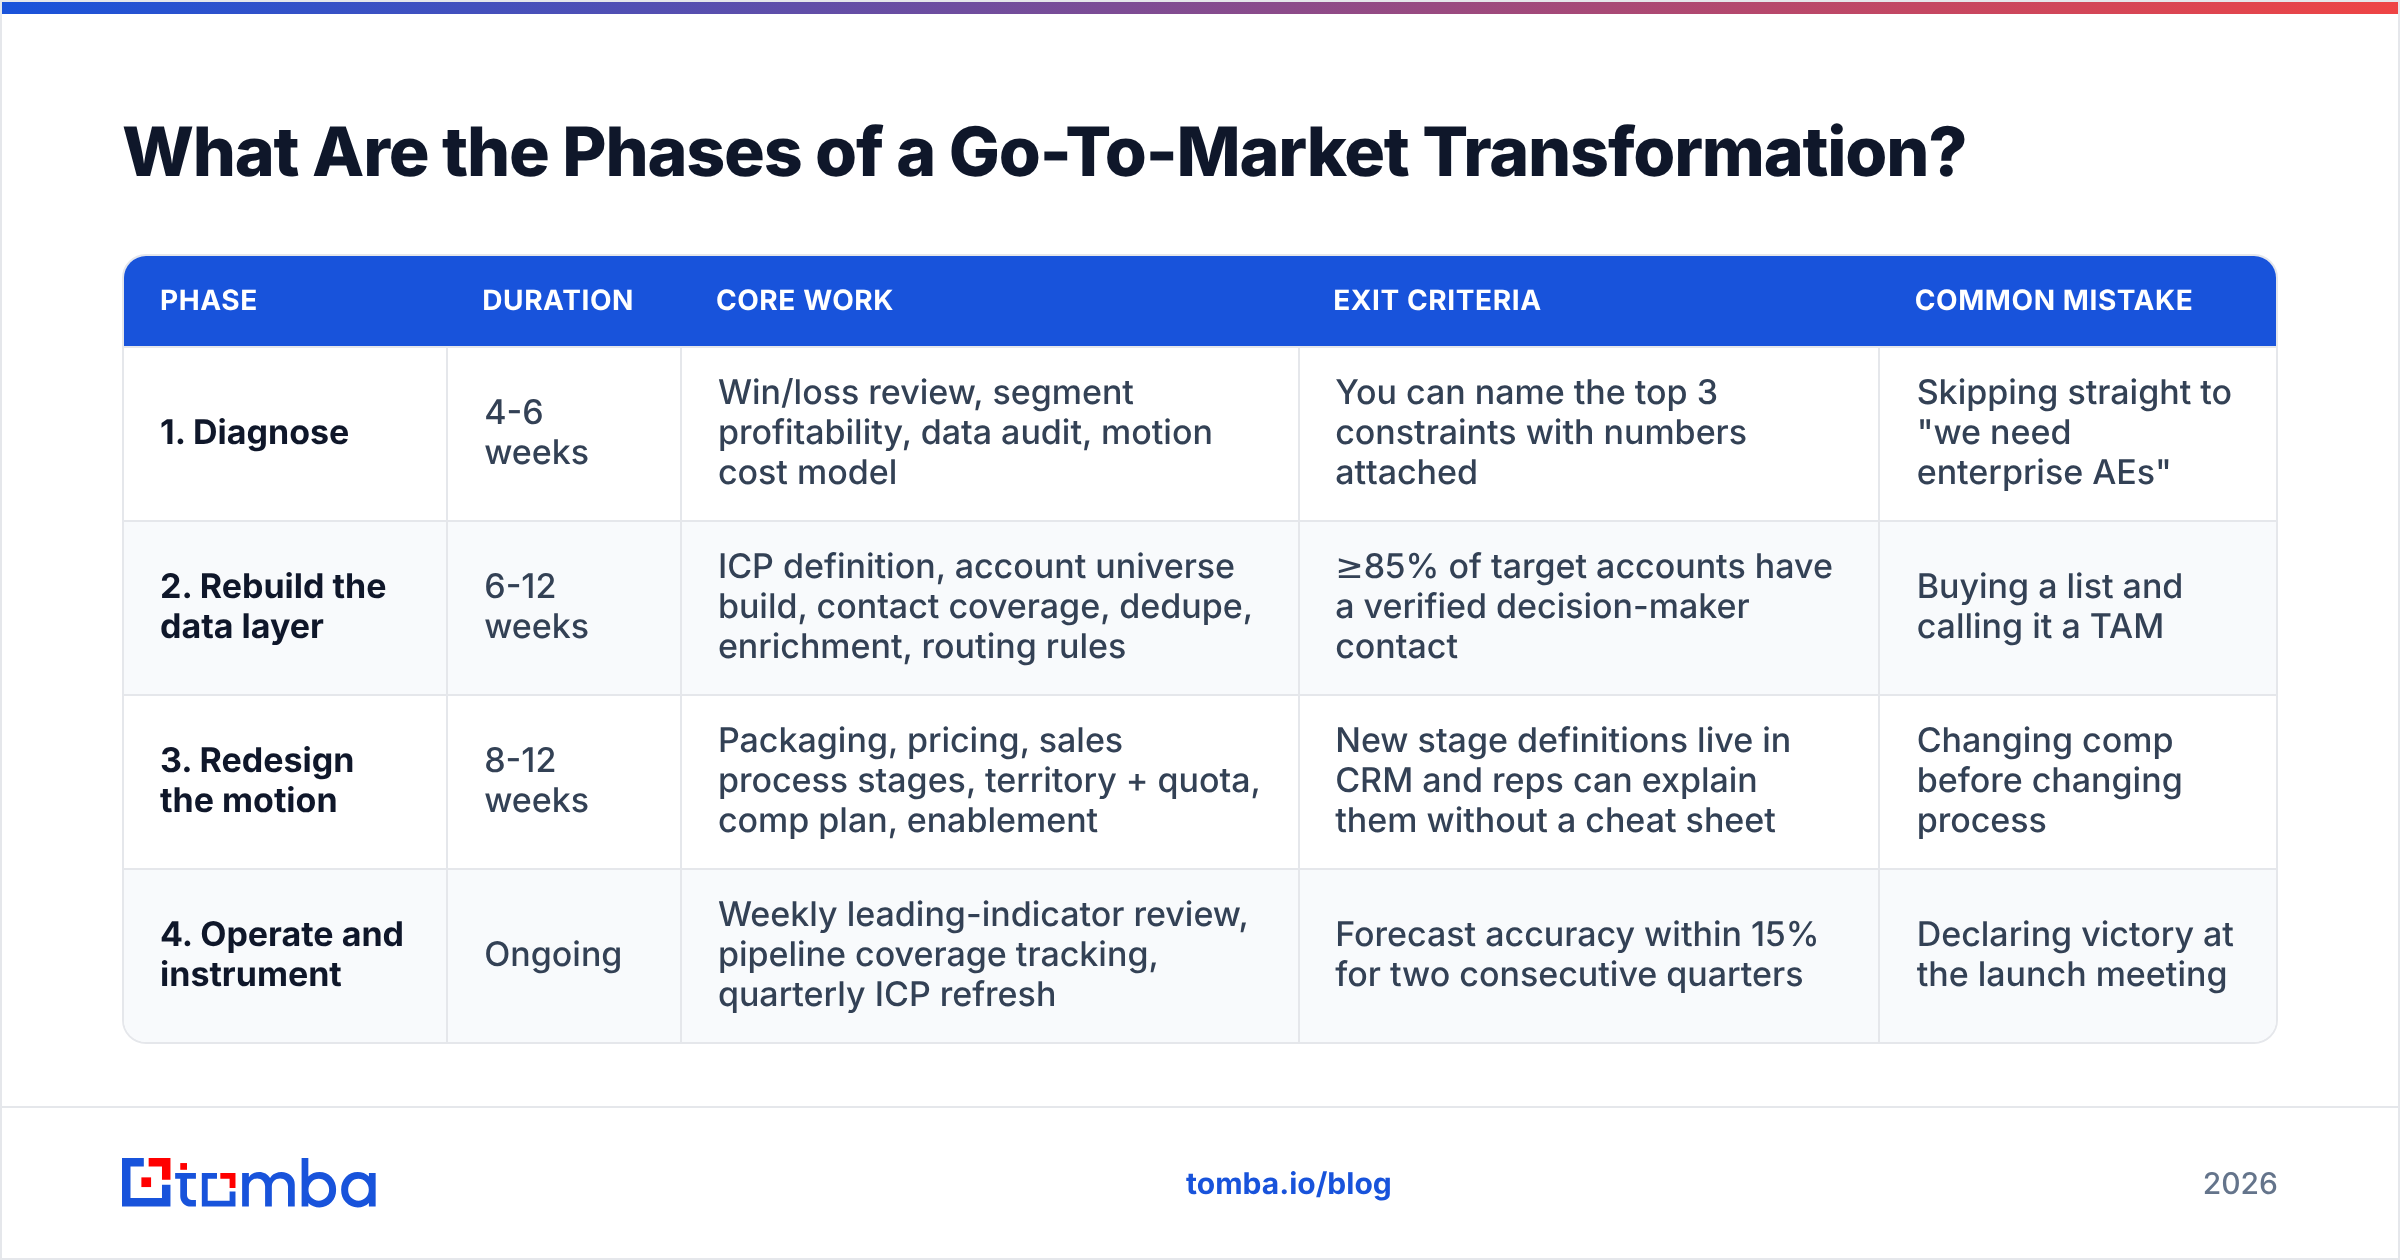
| Phase | Duration | Core work | Exit criteria | Common mistake |
|---|---|---|---|---|
| 1. Diagnose | 4-6 weeks | Win/loss review, segment profitability, data audit, motion cost model | You can name the top 3 constraints with numbers attached | Skipping straight to "we need enterprise AEs" |
| 2. Rebuild the data layer | 6-12 weeks | ICP definition, account universe build, contact coverage, dedupe, enrichment, routing rules | ≥85% of target accounts have a verified decision-maker contact | Buying a list and calling it a TAM |
| 3. Redesign the motion | 8-12 weeks | Packaging, pricing, sales process stages, territory + quota, comp plan, enablement | New stage definitions live in CRM and reps can explain them without a cheat sheet | Changing comp before changing process |
| 4. Operate and instrument | Ongoing | Weekly leading-indicator review, pipeline coverage tracking, quarterly ICP refresh | Forecast accuracy within 15% for two consecutive quarters | Declaring victory at the launch meeting |
Phase 2 is the one that gets compressed, and compressing it is what breaks the other three. If your account universe is wrong, your territories are wrong, your quotas are wrong, your capacity model is wrong, and your forecast is wrong. Everything downstream inherits the defect.
How Do You Rebuild the Data Layer?#
Start by admitting what you actually have. Run a hard audit of your CRM before you buy anything new.
- Coverage rate — what percentage of your defined ICP accounts exist in your CRM at all? For most teams moving upmarket, the honest answer is under 40%.
- Contact depth — how many named, reachable contacts per target account? Enterprise deals average six to ten people in the buying group. If you have 1.4 contacts per account, you are not running an enterprise motion, you are running a lottery.
- Deliverability health — what share of your contact emails are stale, role-based, or catch-all? A bounce rate above 3% starts damaging sender reputation across your whole domain.
- Firmographic accuracy — employee count, revenue band, tech stack, and industry are the inputs to your scoring model. Wrong inputs, wrong scores, wrong routing.
- Duplicate rate — post-merger and multi-source teams routinely hit 12-20% duplicates, which inflates TAM and creates rep conflicts on day one.
- Refresh cadence — B2B contact data decays roughly 2-2.5% per month through job changes alone. A one-time cleanup is not a fix.
Once you know the gaps, close them in a specific order: define the ICP, build the account universe, then find contacts inside those accounts — not the reverse. Teams that start from a contact list and reverse-engineer the ICP end up with a target market shaped by whatever their vendor happened to have in stock.
For account-level contact building, a domain search run against your target account list gets you the org structure and email patterns per company, and an email verifier pass before any outbound protects the deliverability you will need for the next 18 months. If you are enriching thousands of accounts at once, batch it — bulk processing beats a rep manually hunting one contact at a time, and it produces consistent field formatting that your routing rules can actually parse.
Build vs. Buy vs. Blend#
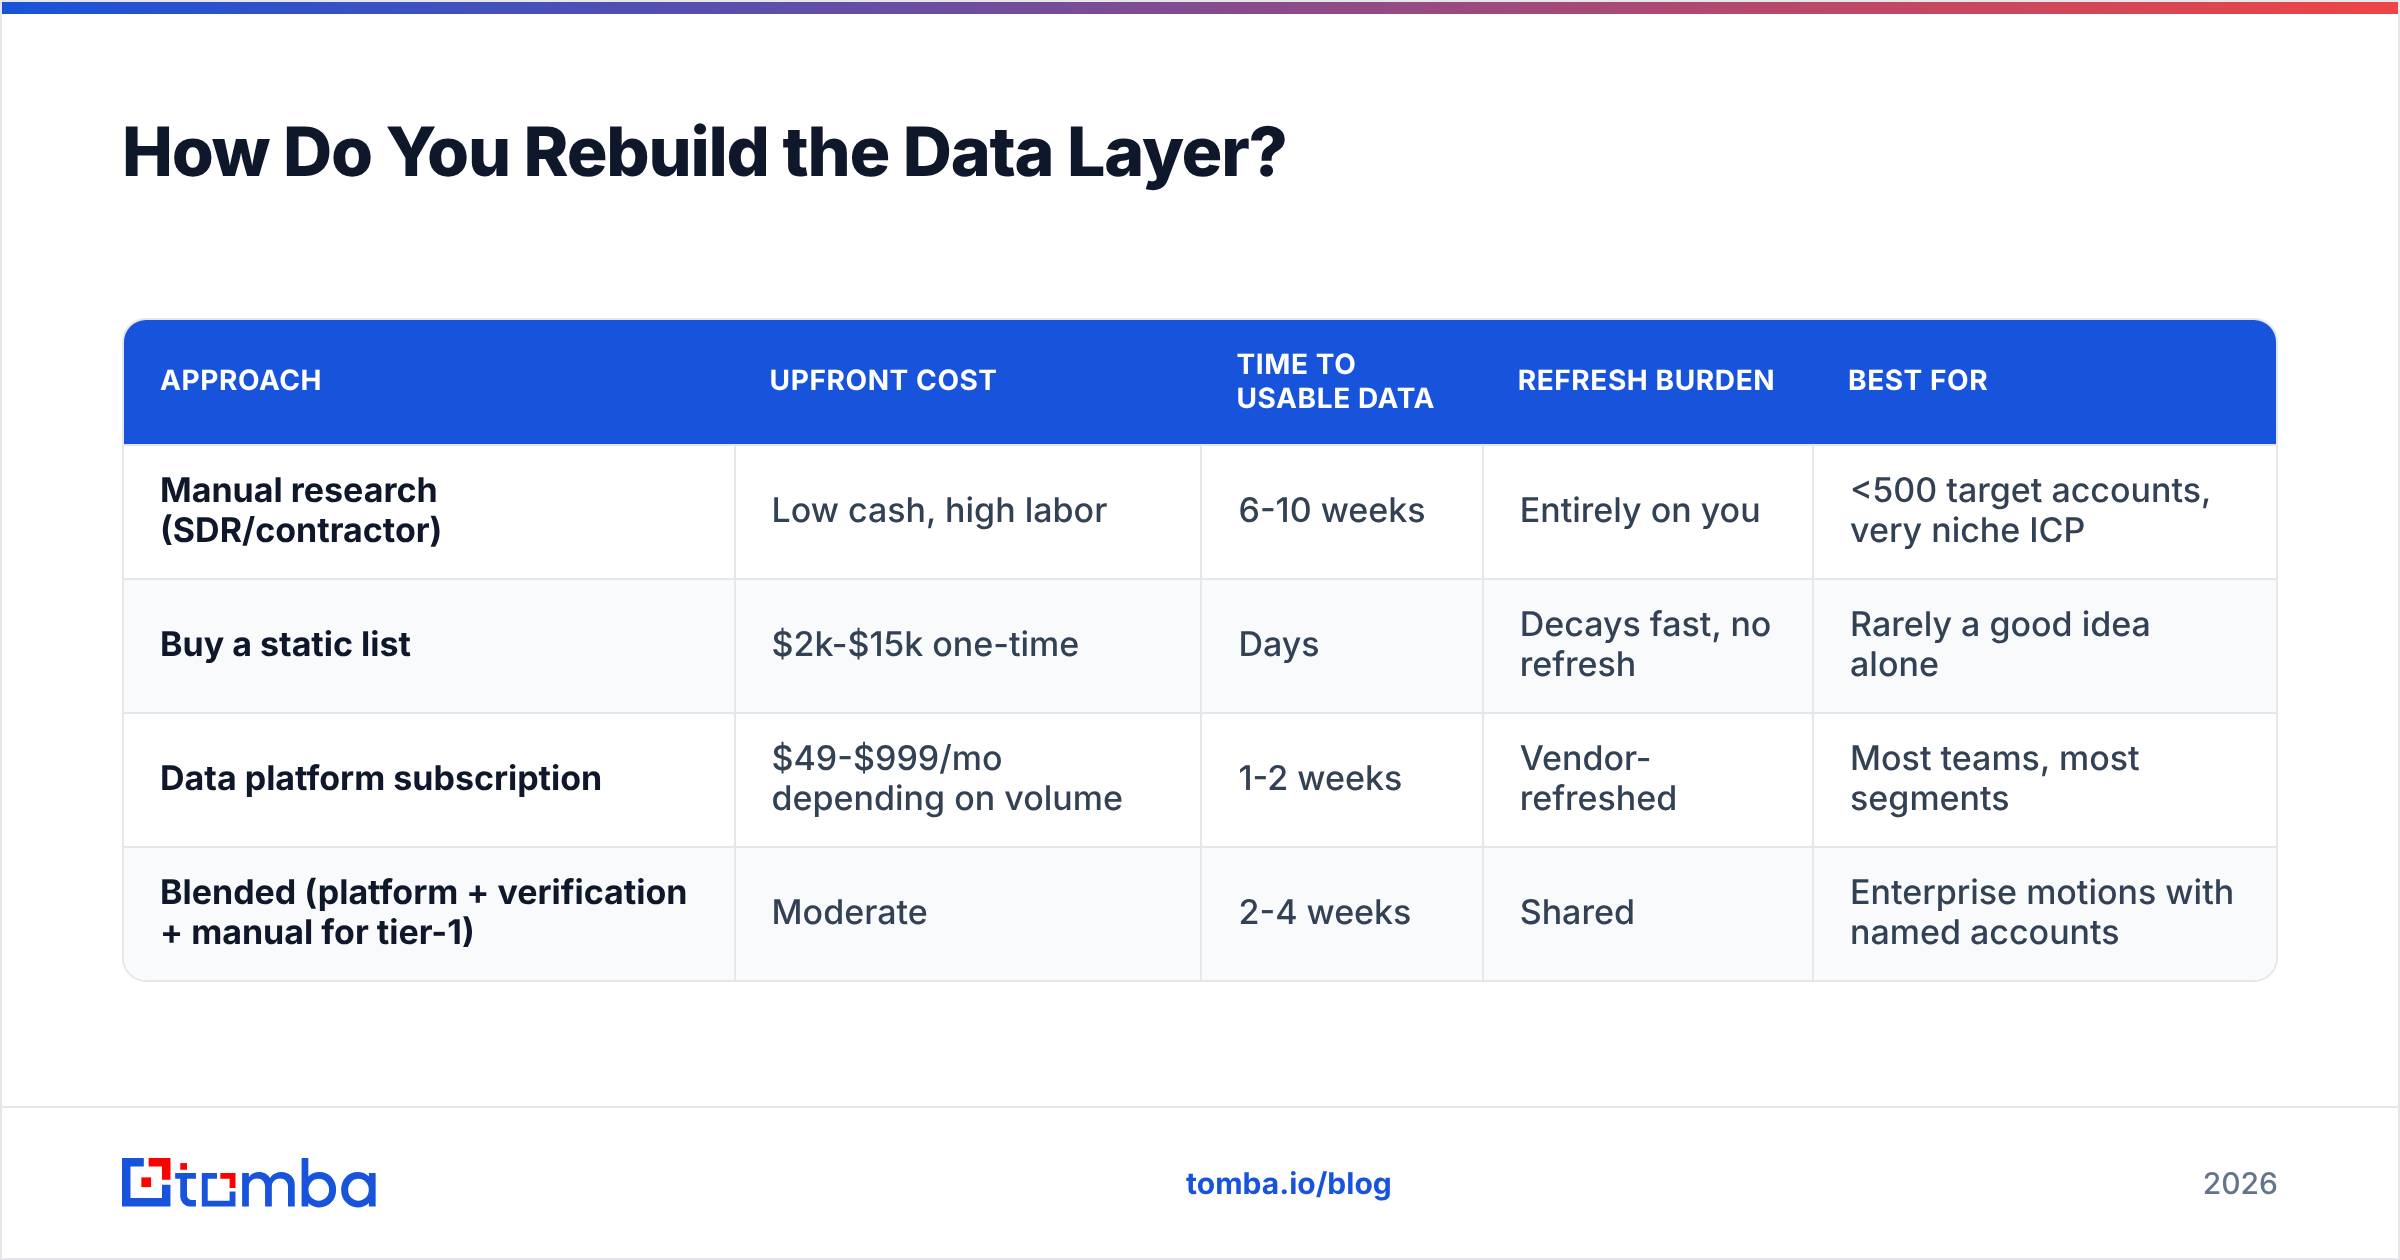
| Approach | Upfront cost | Time to usable data | Refresh burden | Best for |
|---|---|---|---|---|
| Manual research (SDR/contractor) | Low cash, high labor | 6-10 weeks | Entirely on you | <500 target accounts, very niche ICP |
| Buy a static list | $2k-$15k one-time | Days | Decays fast, no refresh | Rarely a good idea alone |
| Data platform subscription | $49-$999/mo depending on volume | 1-2 weeks | Vendor-refreshed | Most teams, most segments |
| Blended (platform + verification + manual for tier-1) | Moderate | 2-4 weeks | Shared | Enterprise motions with named accounts |
The blend wins for most transformations. Use a platform for breadth, verify everything before it enters a sequence, and reserve manual research for your top 50-100 named accounts where a wrong contact costs you a quarter.
Which Metrics Prove the Transformation Is Working?#
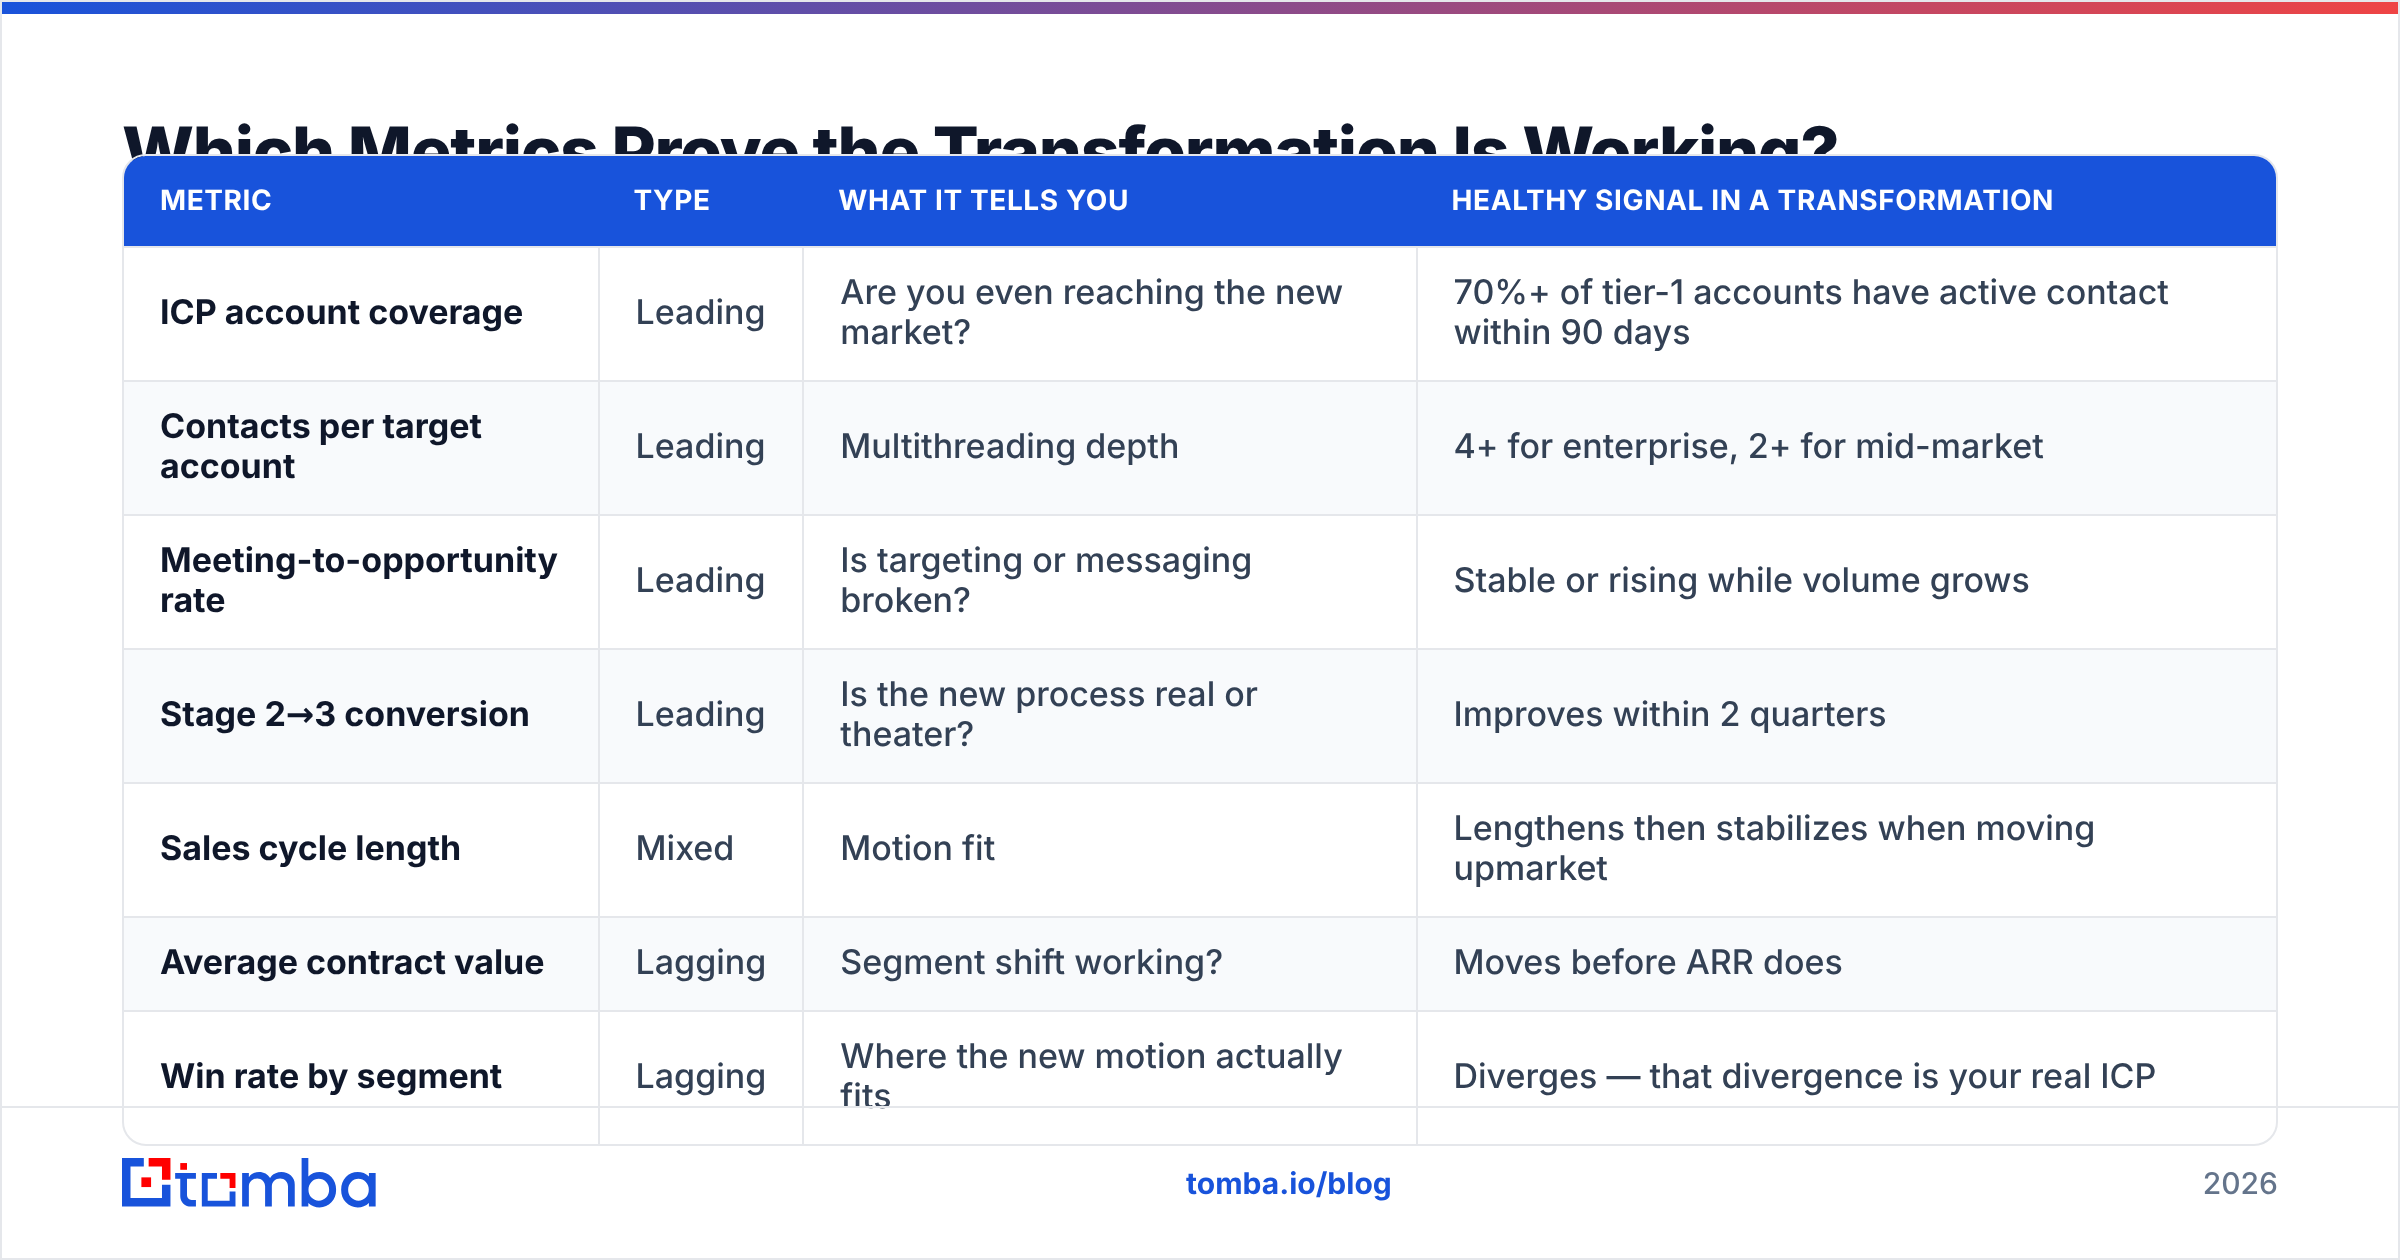
Split your scorecard into leading and lagging. Review leading weekly, lagging quarterly, and never let a board deck show only the lagging half.
| Metric | Type | What it tells you | Healthy signal in a transformation |
|---|---|---|---|
| ICP account coverage | Leading | Are you even reaching the new market? | 70%+ of tier-1 accounts have active contact within 90 days |
| Contacts per target account | Leading | Multithreading depth | 4+ for enterprise, 2+ for mid-market |
| Meeting-to-opportunity rate | Leading | Is targeting or messaging broken? | Stable or rising while volume grows |
| Stage 2→3 conversion | Leading | Is the new process real or theater? | Improves within 2 quarters |
| Sales cycle length | Mixed | Motion fit | Lengthens then stabilizes when moving upmarket |
| Average contract value | Lagging | Segment shift working? | Moves before ARR does |
| Win rate by segment | Lagging | Where the new motion actually fits | Diverges — that divergence is your real ICP |
| CAC payback | Lagging | Efficiency of the new machine | Worsens for 2 quarters, then improves |
The pattern to expect: leading indicators move in quarter one, mixed indicators get worse before better in quarter two, lagging indicators move in quarters three and four. If your leading indicators are flat after 90 days, stop and re-diagnose. Do not wait for ARR to confirm what coverage already told you.
How Do You Handle the People Side?#
The org chart change is real work, it is just not the first work. Three rules that reduce the damage:
Change process before comp. If you rewrite quota and comp in the same month you rewrite the sales stages, reps will optimize for the comp plan against a process they do not understand yet. Ship the process, let it run a quarter, then align comp to it.
Name the segment owner, not the segment. "We're moving upmarket" is a slogan. "Dana owns 120 named accounts above 1,000 employees, with a 4-person pod and a 9-month ramp" is a plan. Ambiguous ownership is where transformations quietly die.
Expect 20-30% turnover in the sales org. Moving from transactional to complex sales is a different job, not a harder version of the same job. Some of your best SMB closers will not want the enterprise motion, and that is a normal, budgetable outcome — not a failure. Plan backfill hiring into the timeline rather than treating each departure as a surprise.
On the revenue operations side, staff it before you need it. RevOps is the function that keeps the data layer, the process definitions, and the reporting consistent across the change. Teams that run a transformation with a single overloaded ops person end up with three competing definitions of "qualified" by month six. HubSpot's sales operations resources are a reasonable starting framework if you are building the function from scratch.
What Does the Tooling Stack Look Like After Transformation?#
You need fewer tools than vendors suggest, but the ones you keep have to be wired together. A workable post-transformation stack has four layers:
- System of record — one CRM, one definition of an account, enforced. Two CRMs post-merger is a transformation blocker, not a detail to sort out later.
- Data and enrichment — account universe building, contact discovery, verification, and ongoing refresh. This feeds everything else.
- Engagement — sequencing, calling, and conversation intelligence, scoped to the motion you actually run.
- Analytics — pipeline, forecast, and cohort reporting that reads from the CRM, not from a parallel spreadsheet.
The integration points matter more than the individual tools. If your enrichment data cannot write cleanly into CRM fields your routing rules read, you have bought a very expensive CSV. Check that any data vendor offers a real API and native connectors for your CRM — Tomba's HubSpot integration and Tomba API, for example, exist precisely so enrichment lands in the record rather than in a rep's downloads folder. Compare vendors on this dimension before you compare them on database size; G2's sales intelligence category lets you filter reviews by integration quality and company size, which is more useful than raw record counts.
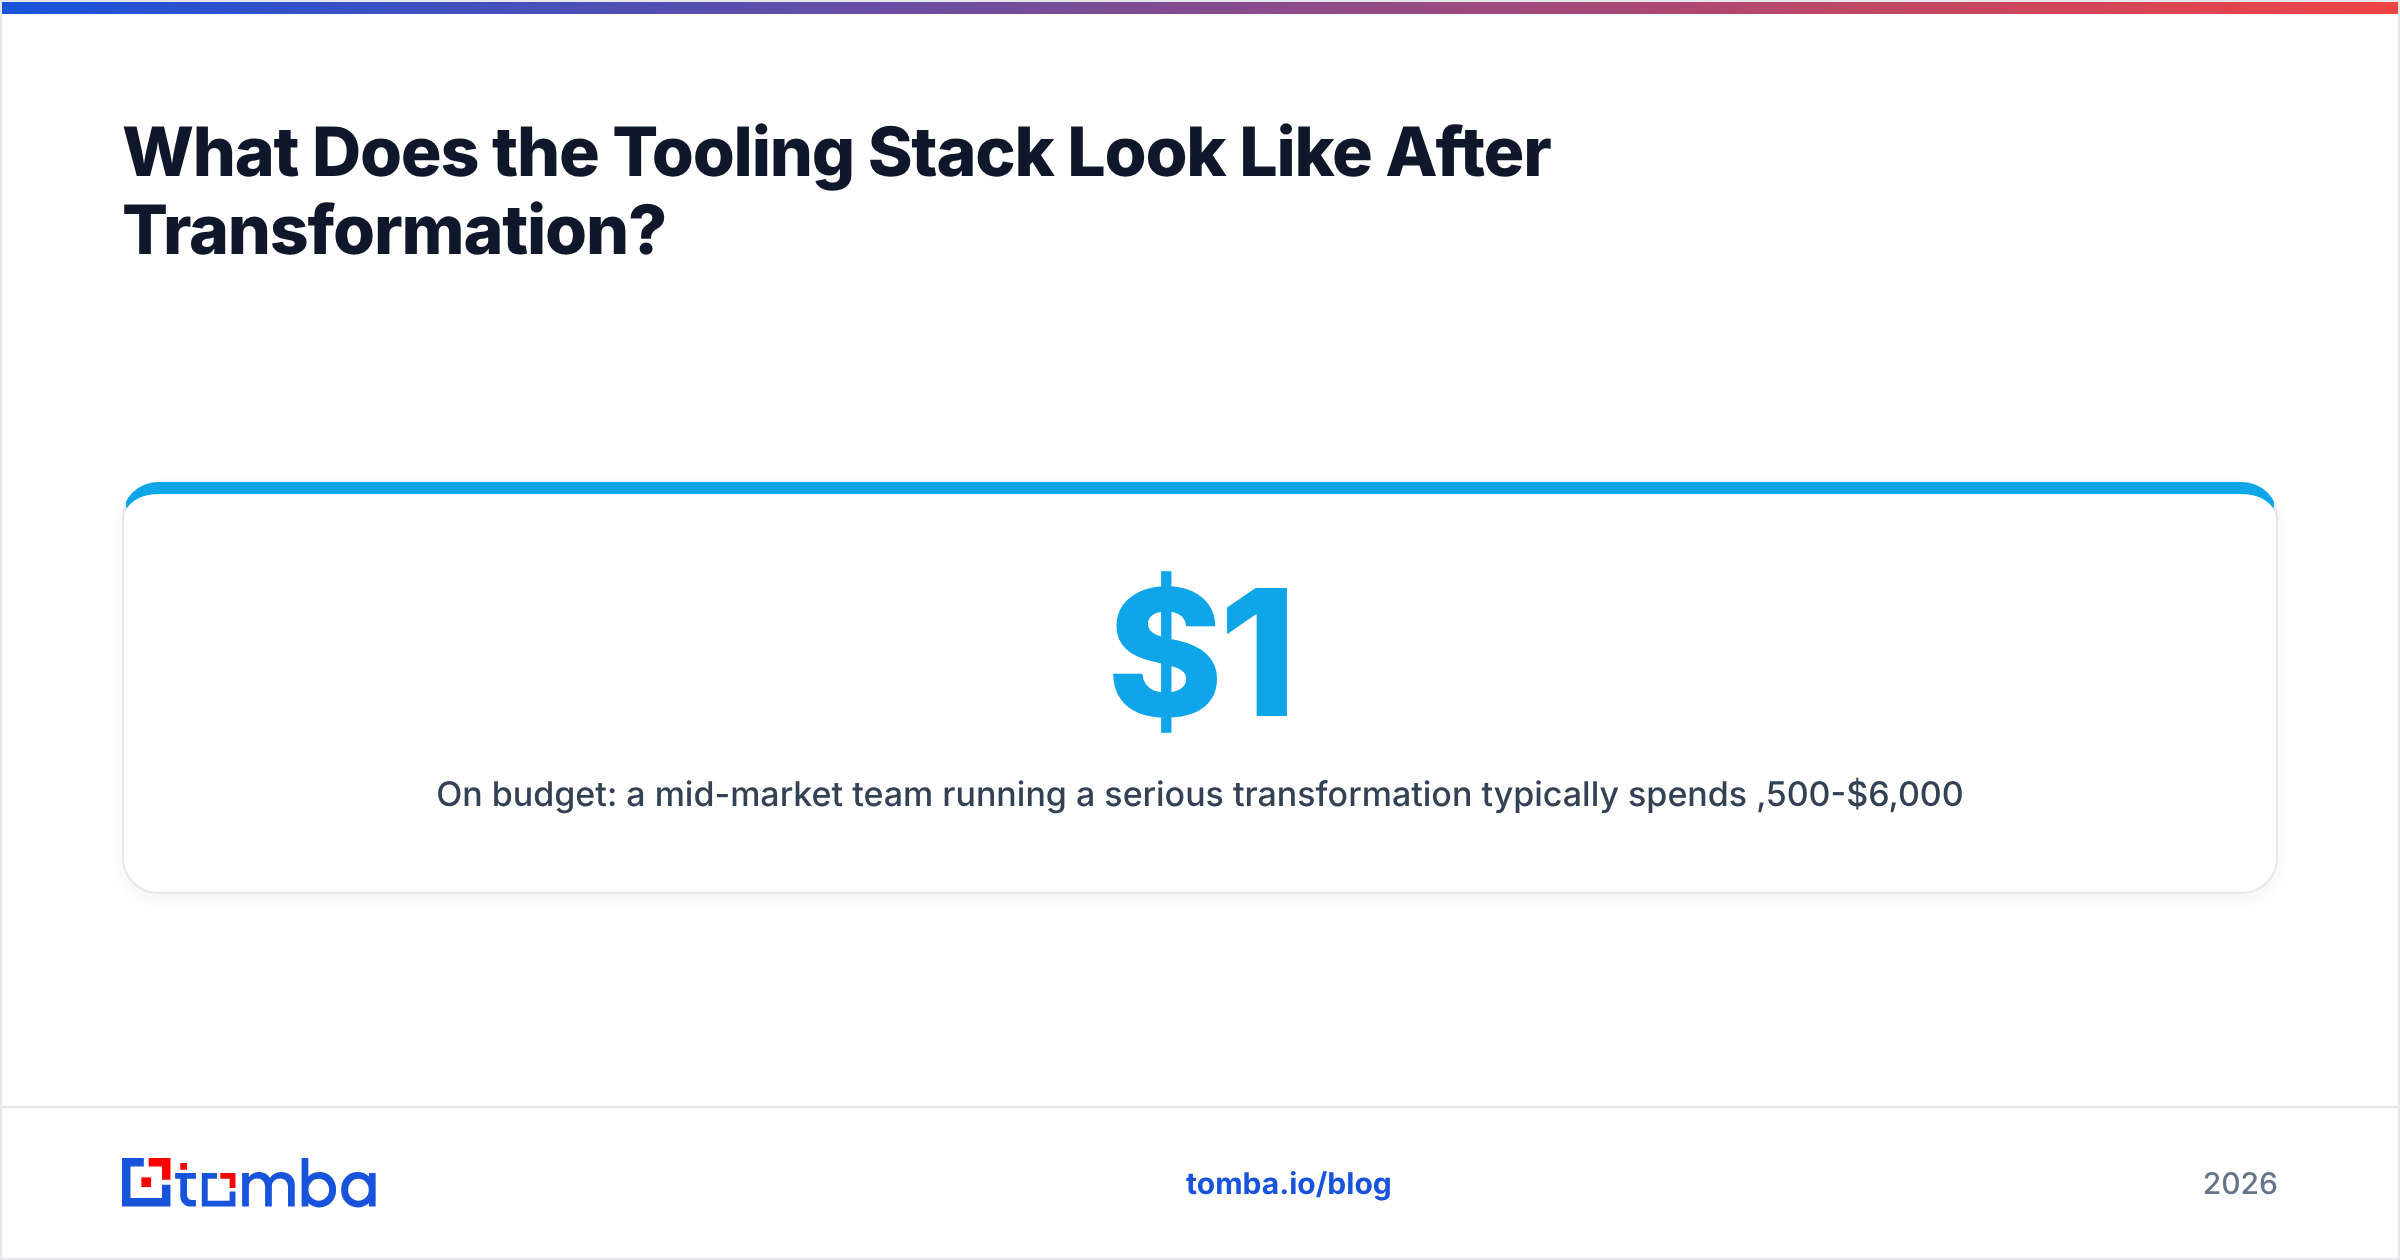
On budget: a mid-market team running a serious transformation typically spends $1,500-$6,000/month across the data and engagement layers combined. For the data layer specifically, plans run from free tiers for evaluation up through the $49-$249/month range for most teams — see Tomba pricing for how credit-based tiers map to account volume. The expensive mistake is not the subscription; it is the six months of rep time wasted on a book of accounts built from bad records.
What Should You Do in the First 30 Days?#
If you are starting a go to market transformation now, this is the highest-leverage opening sequence:
- Week 1 — Pull win/loss data for the last 12 months, segmented by company size, industry, and source. Find where you actually win, not where you wish you won.
- Week 2 — Audit the CRM against the six data-quality dimensions above. Produce one number per dimension. Show it to leadership without softening it.
- Week 3 — Write a one-page ICP with hard filters (size, industry, tech, geography, trigger events) and build the account universe from those filters.
- Week 4 — Run contact discovery and verification against the top 200 accounts. Measure contacts-per-account and verified-email rate. That number is your realistic starting coverage, and it will be lower than anyone expects.
Everything after week four — territory design, comp, enablement, packaging — is easier and cheaper because it sits on a foundation you have measured rather than assumed.
Getting the Data Layer Right#
The single highest-ROI move in any GTM transformation is boring: know exactly who is in your target market and how to reach them, before you redesign anything else. Territory maps, quotas, and forecasts are all downstream functions of that one input.
If you are rebuilding an account universe for a new segment, start with the Tomba Email Finder. Run your target-account domains through it, verify what comes back, and you will have a coverage number in days rather than a quarter of guesswork. The free tier gives you 25 searches a month to test it against your own account list — enough to see whether your assumed TAM survives contact with real contact data.
Related guides#
Ready to find emails that actually work?
Join 150,000+ professionals who stopped guessing and started sending. Free credits on signup — no credit card required.
Get the Tomba newsletter
Practical outbound tactics and product updates — once every two weeks.
About the author