Google Sheets Sales Funnel Template: Build One in 2026
A free Google Sheets sales funnel template beats a CRM you never open — until it doesn't. Here's the exact tab structure, formulas, and the point where you should graduate.
TL;DR
- A Google Sheets sales funnel template works well up to roughly 200 open deals and 2–3 reps. Past that, manual data entry costs more than a CRM seat.
- The template needs five tabs, not one: Deals, Stages, Activity Log, Forecast, and Dashboard. Single-tab funnels collapse the moment you need stage-conversion math.
- Your conversion rates are only as honest as your stage definitions. Define exit criteria per stage before you write a formula.
- The bottleneck in a spreadsheet funnel is never the math — it's getting verified contact data into row 1. Automate that with a lookup add-on or API.
- Copy the structure below, wire the four formulas, and you have a working weighted forecast in about 30 minutes.
What Is a Google Sheets Sales Funnel Template?#
A Google Sheets sales funnel template is a structured workbook that tracks every deal from first touch to closed-won, calculates stage-to-stage conversion rates, and produces a weighted revenue forecast — without a CRM subscription.
It's the sales equivalent of a paper flight log. A commercial airline runs on avionics; a bush pilot runs on a clipboard and does fine, because the number of variables is small enough to hold in one hand. Your funnel is the same. Under a few hundred deals, structured cells beat an unused CRM every time — because the failure mode of most CRM rollouts isn't bad software, it's reps who never log anything.
The distinction that matters: a pipeline tracker lists deals. A funnel template measures the drop-off between stages. The second one tells you where you're losing money. Most free templates you'll find online are the first kind wearing the second kind's name.
Here's what separates a real funnel workbook from a glorified contact list:
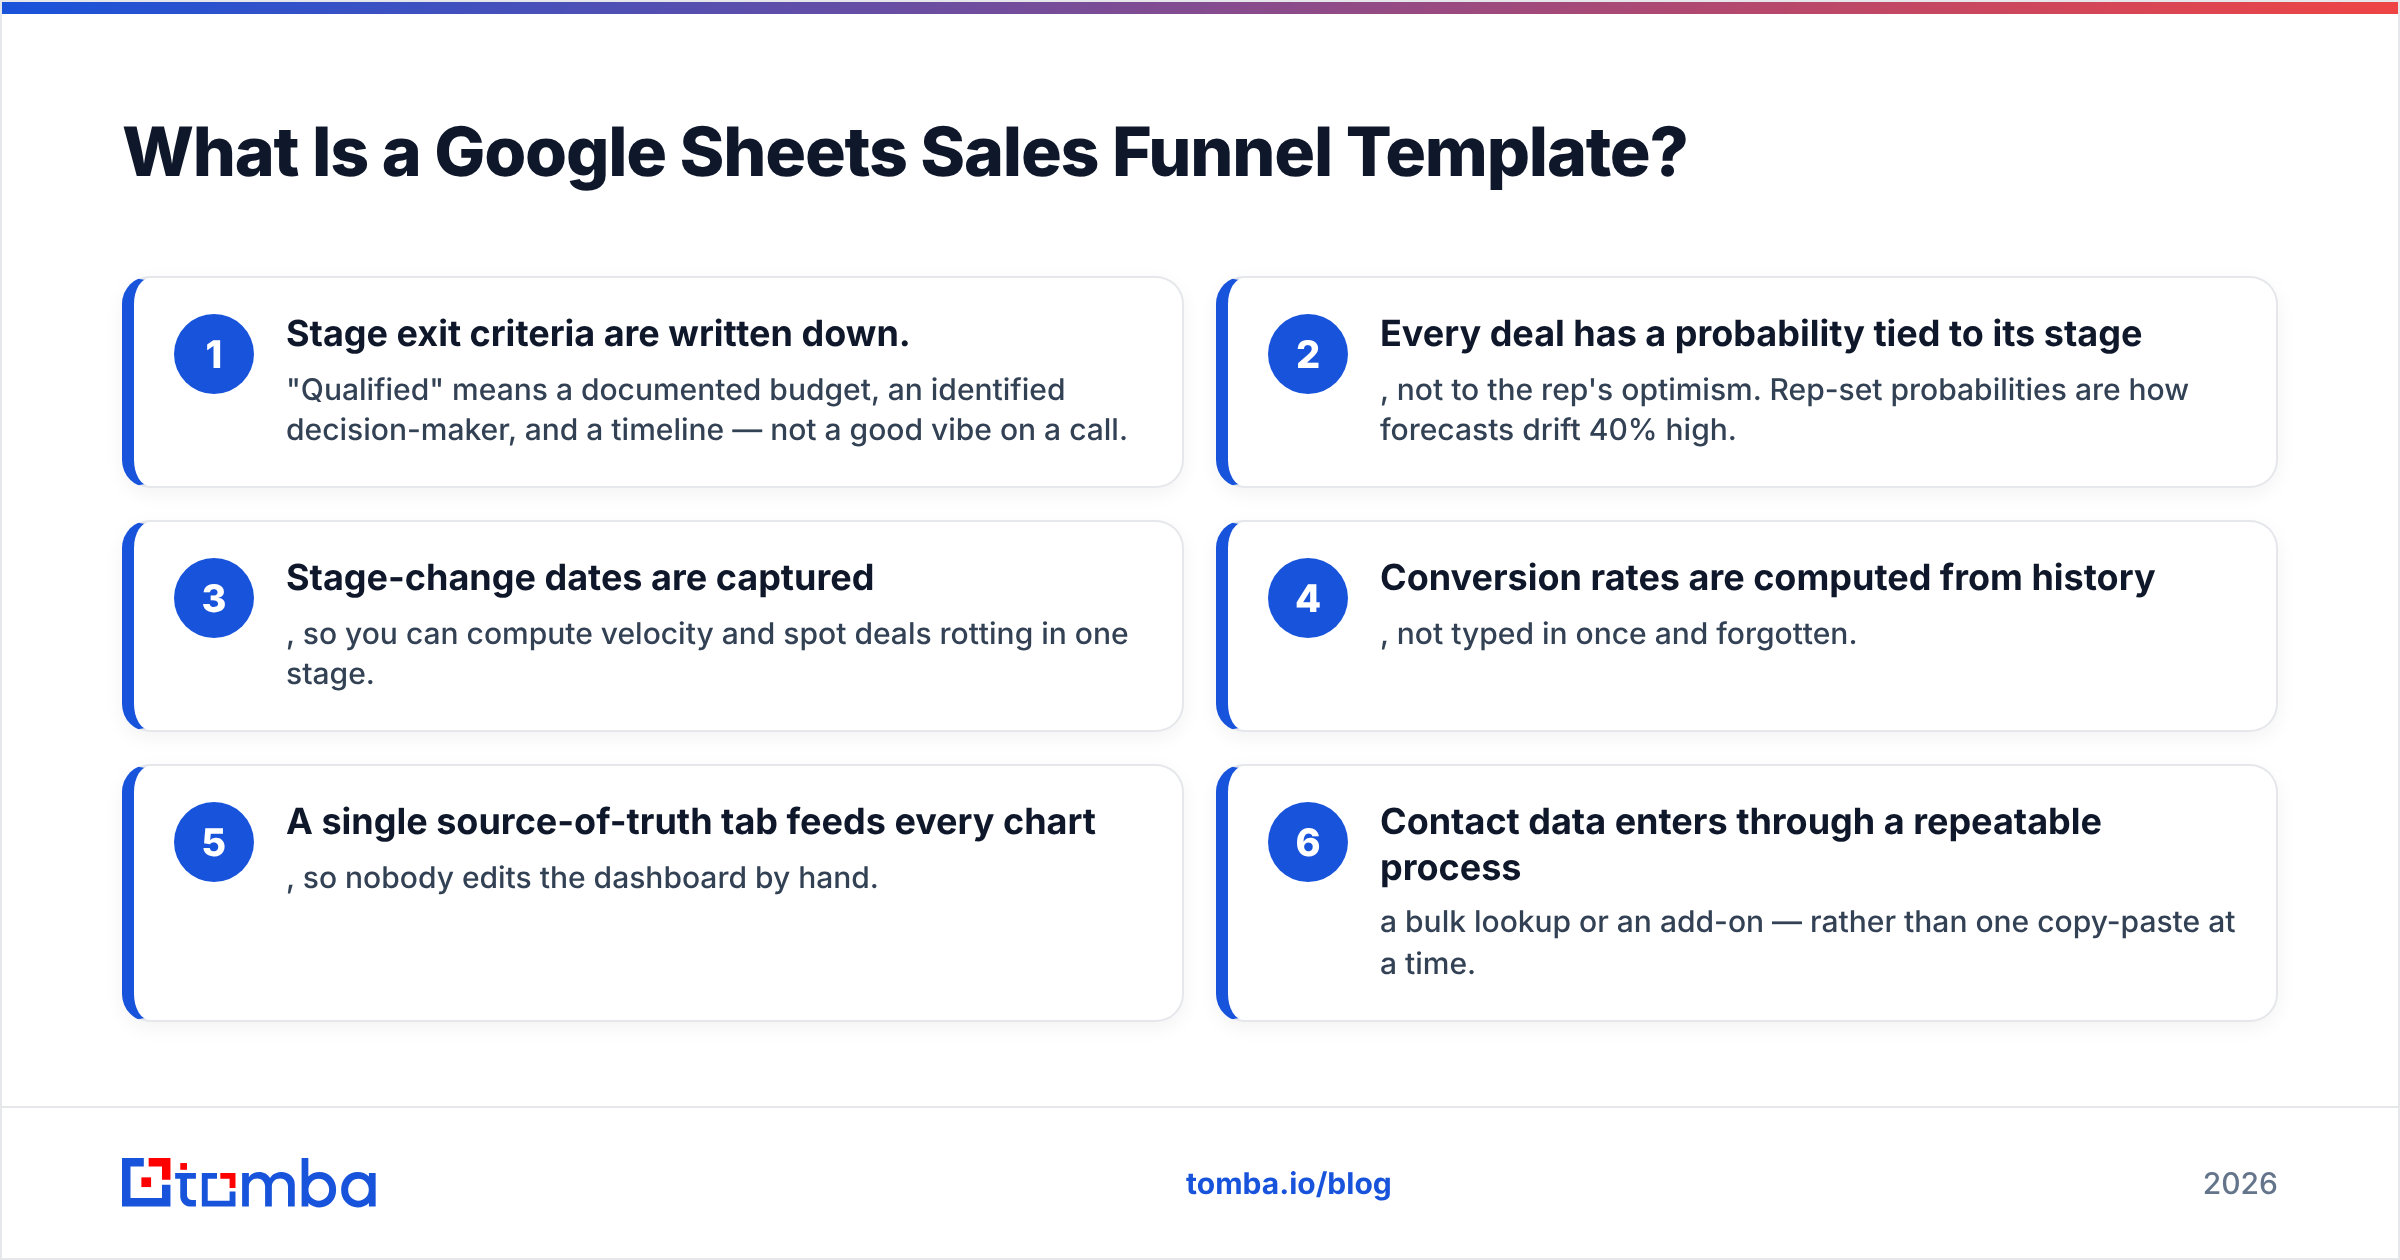
- Stage exit criteria are written down. "Qualified" means a documented budget, an identified decision-maker, and a timeline — not a good vibe on a call.
- Every deal has a probability tied to its stage, not to the rep's optimism. Rep-set probabilities are how forecasts drift 40% high.
- Stage-change dates are captured, so you can compute velocity and spot deals rotting in one stage.
- Conversion rates are computed from history, not typed in once and forgotten.
- A single source-of-truth tab feeds every chart, so nobody edits the dashboard by hand.
- Contact data enters through a repeatable process — a bulk lookup or an add-on — rather than one copy-paste at a time.

Which Tabs Does the Template Actually Need?#
Five. Fewer and you'll bolt on hacks; more and nobody maintains it.
Tab 1 — Deals. One row per opportunity. Columns: Deal ID, Company, Contact Name, Contact Email, Stage, Amount, Owner, Source, Created Date, Stage Changed Date, Expected Close, Notes. That's it. Resist adding twelve custom fields in week one.
Tab 2 — Stages. A tiny reference table: stage name, order number, default probability, and exit criteria in plain English. Every dropdown and every weighted-value formula points here. Change a probability once, and the whole workbook updates.
Tab 3 — Activity Log. Append-only. Date, Deal ID, activity type, outcome. This is what lets you answer "how many touches does a closed-won deal actually take?" — the single most useful number for capacity planning.
Tab 4 — Forecast. Weighted pipeline by month, by owner, by source. Pure formulas, zero manual entry.
Tab 5 — Dashboard. Charts only. Funnel bar chart, conversion waterfall, velocity by stage.
What Formulas Make It Work?#
Four do most of the lifting. Assume your Deals tab spans A2:L1000.
Weighted value per deal (column M):
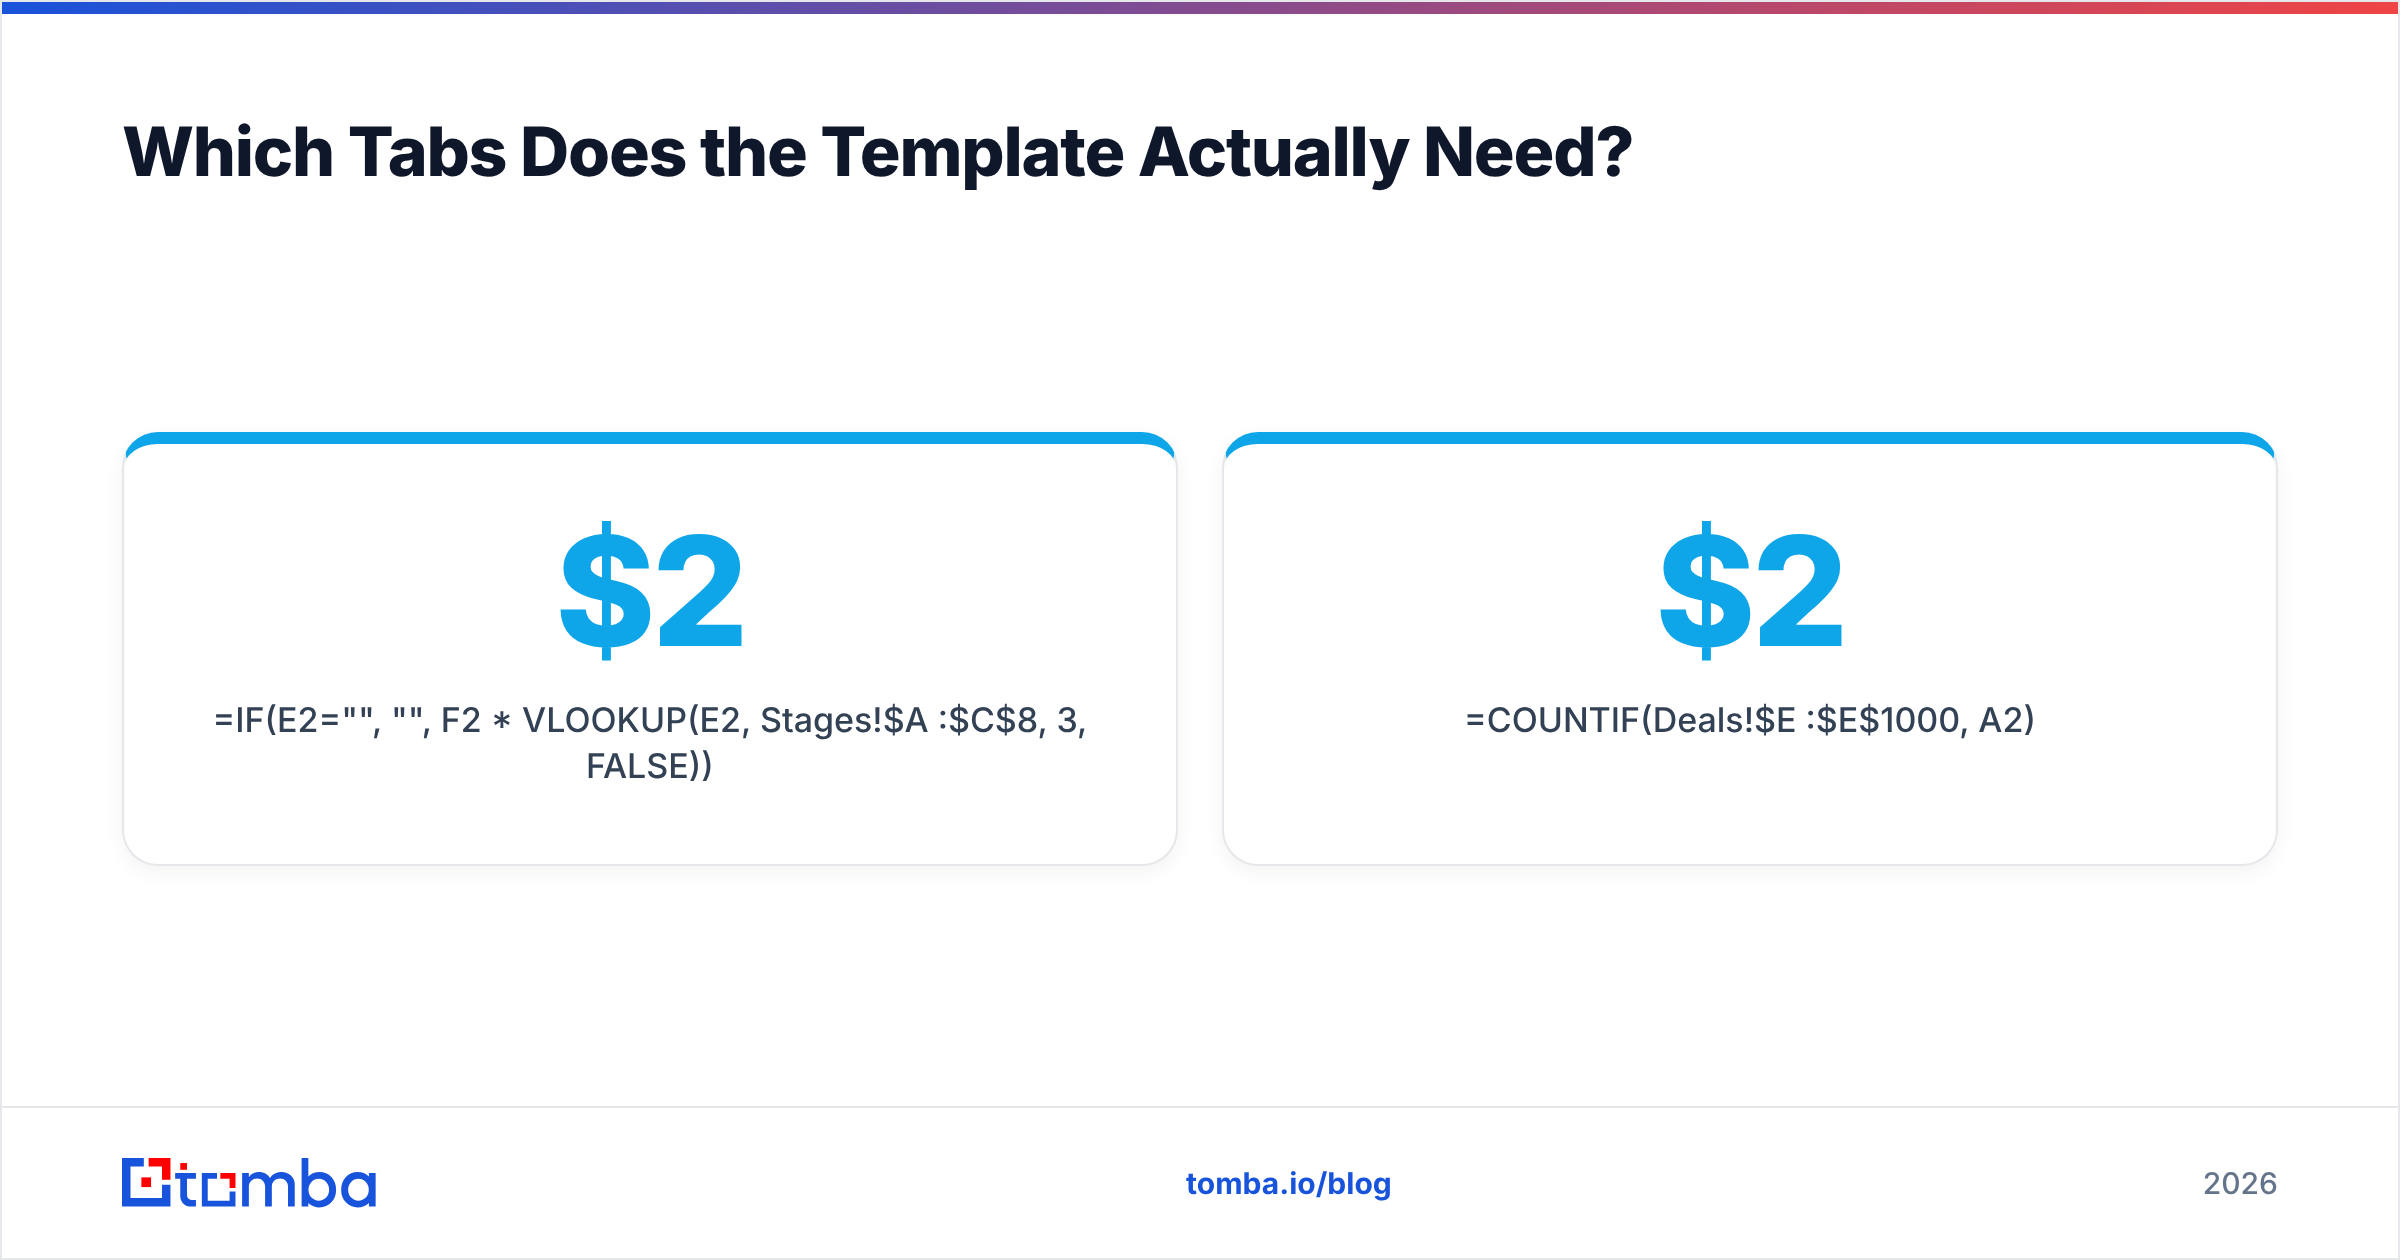
=IF(E2="", "", F2 * VLOOKUP(E2, Stages!$A$2:$C$8, 3, FALSE))
Deal count per stage, for the funnel chart:
=COUNTIF(Deals!$E$2:$E$1000, A2)
Stage-to-stage conversion rate:
=IFERROR(B3 / B2, 0) — formatted as a percentage, where column B holds the counts from the previous formula.
Days in current stage, which surfaces the rot:
=IF(E2="Closed Won", "", TODAY() - J2)
Then conditional-format that last column red past 30 days. That one rule catches more stalled revenue than any dashboard you'll build.
For monthly weighted forecast, use SUMIFS against the expected-close column:
=SUMIFS(Deals!$M:$M, Deals!$K:$K, ">="&A2, Deals!$K:$K, "<"&EDATE(A2,1))
Is a Spreadsheet Funnel Better Than a CRM?#
For small teams, often yes — for a specific window. Here's the honest comparison.
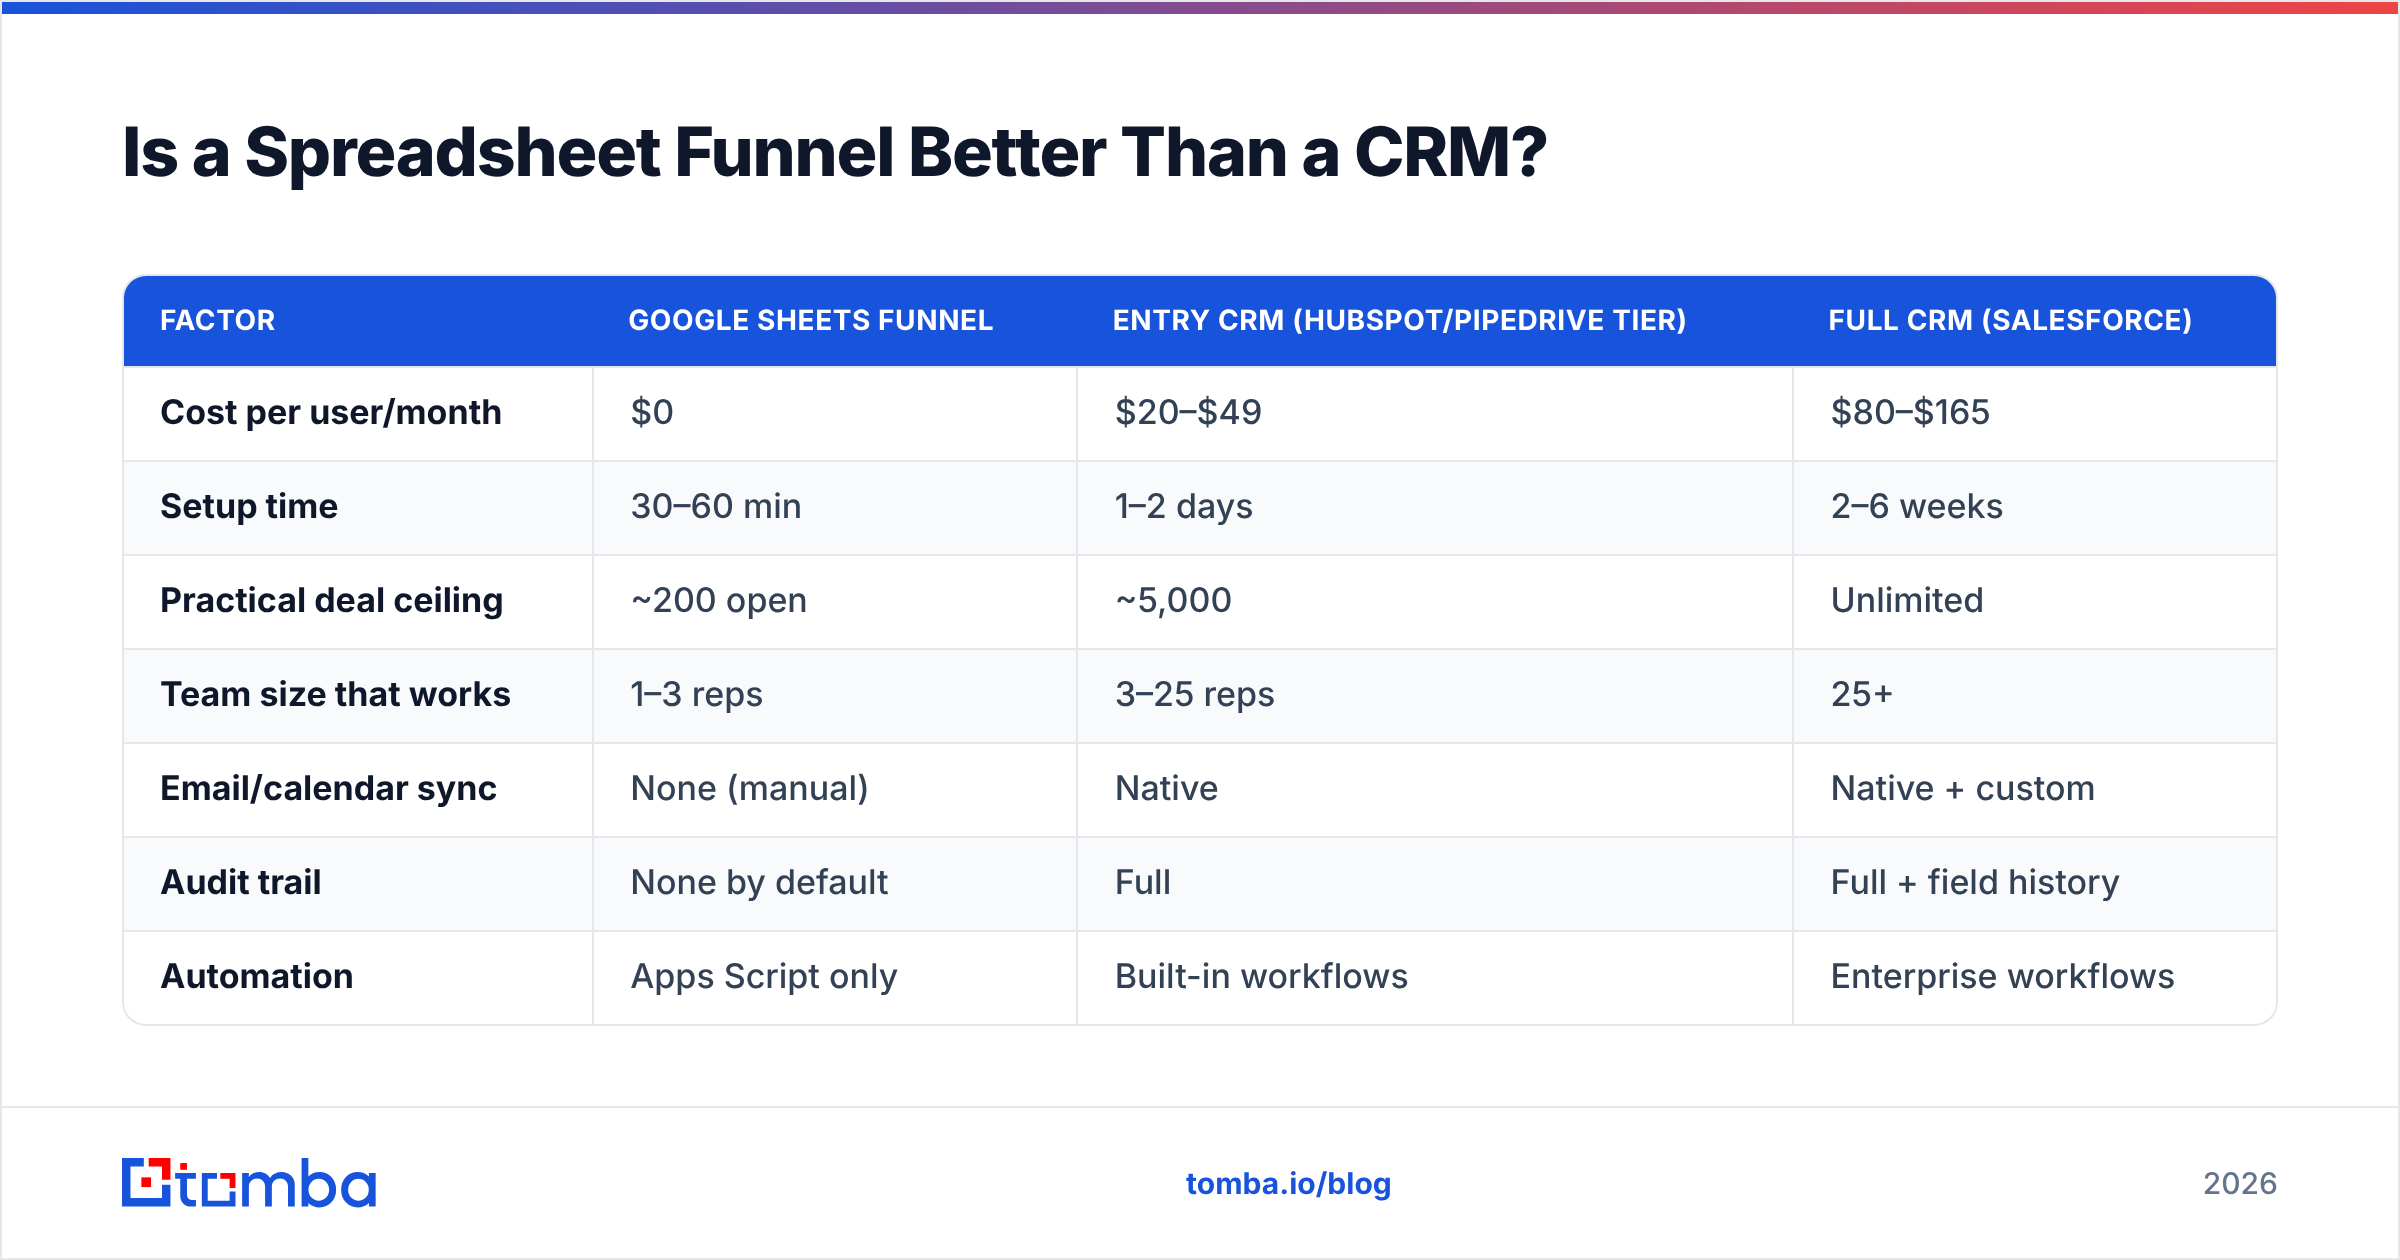
| Factor | Google Sheets funnel | Entry CRM (HubSpot/Pipedrive tier) | Full CRM (Salesforce) |
|---|---|---|---|
| Cost per user/month | $0 | $20–$49 | $80–$165 |
| Setup time | 30–60 min | 1–2 days | 2–6 weeks |
| Practical deal ceiling | ~200 open | ~5,000 | Unlimited |
| Team size that works | 1–3 reps | 3–25 reps | 25+ |
| Email/calendar sync | None (manual) | Native | Native + custom |
| Audit trail | None by default | Full | Full + field history |
| Automation | Apps Script only | Built-in workflows | Enterprise workflows |
| Reporting depth | What you build | Standard dashboards | Custom + BI |
| Data enrichment | Via add-on/API | Native or paid add-on | Native + marketplace |
| Breaks when | 2+ people edit live | Rarely | Rarely |
The switching signal isn't deal count in isolation. It's the first week you spend more than two hours reconciling the sheet instead of selling. That's the moment the spreadsheet started charging you a higher hourly rate than Pipedrive or HubSpot would.
Two more failure signals worth watching: concurrent-edit collisions (two reps overwrite the same row and neither notices), and the day someone asks "why did this deal's amount change?" and nobody can answer. A CRM gives you field history for free; Sheets gives you a version log that's technically there and practically unusable.
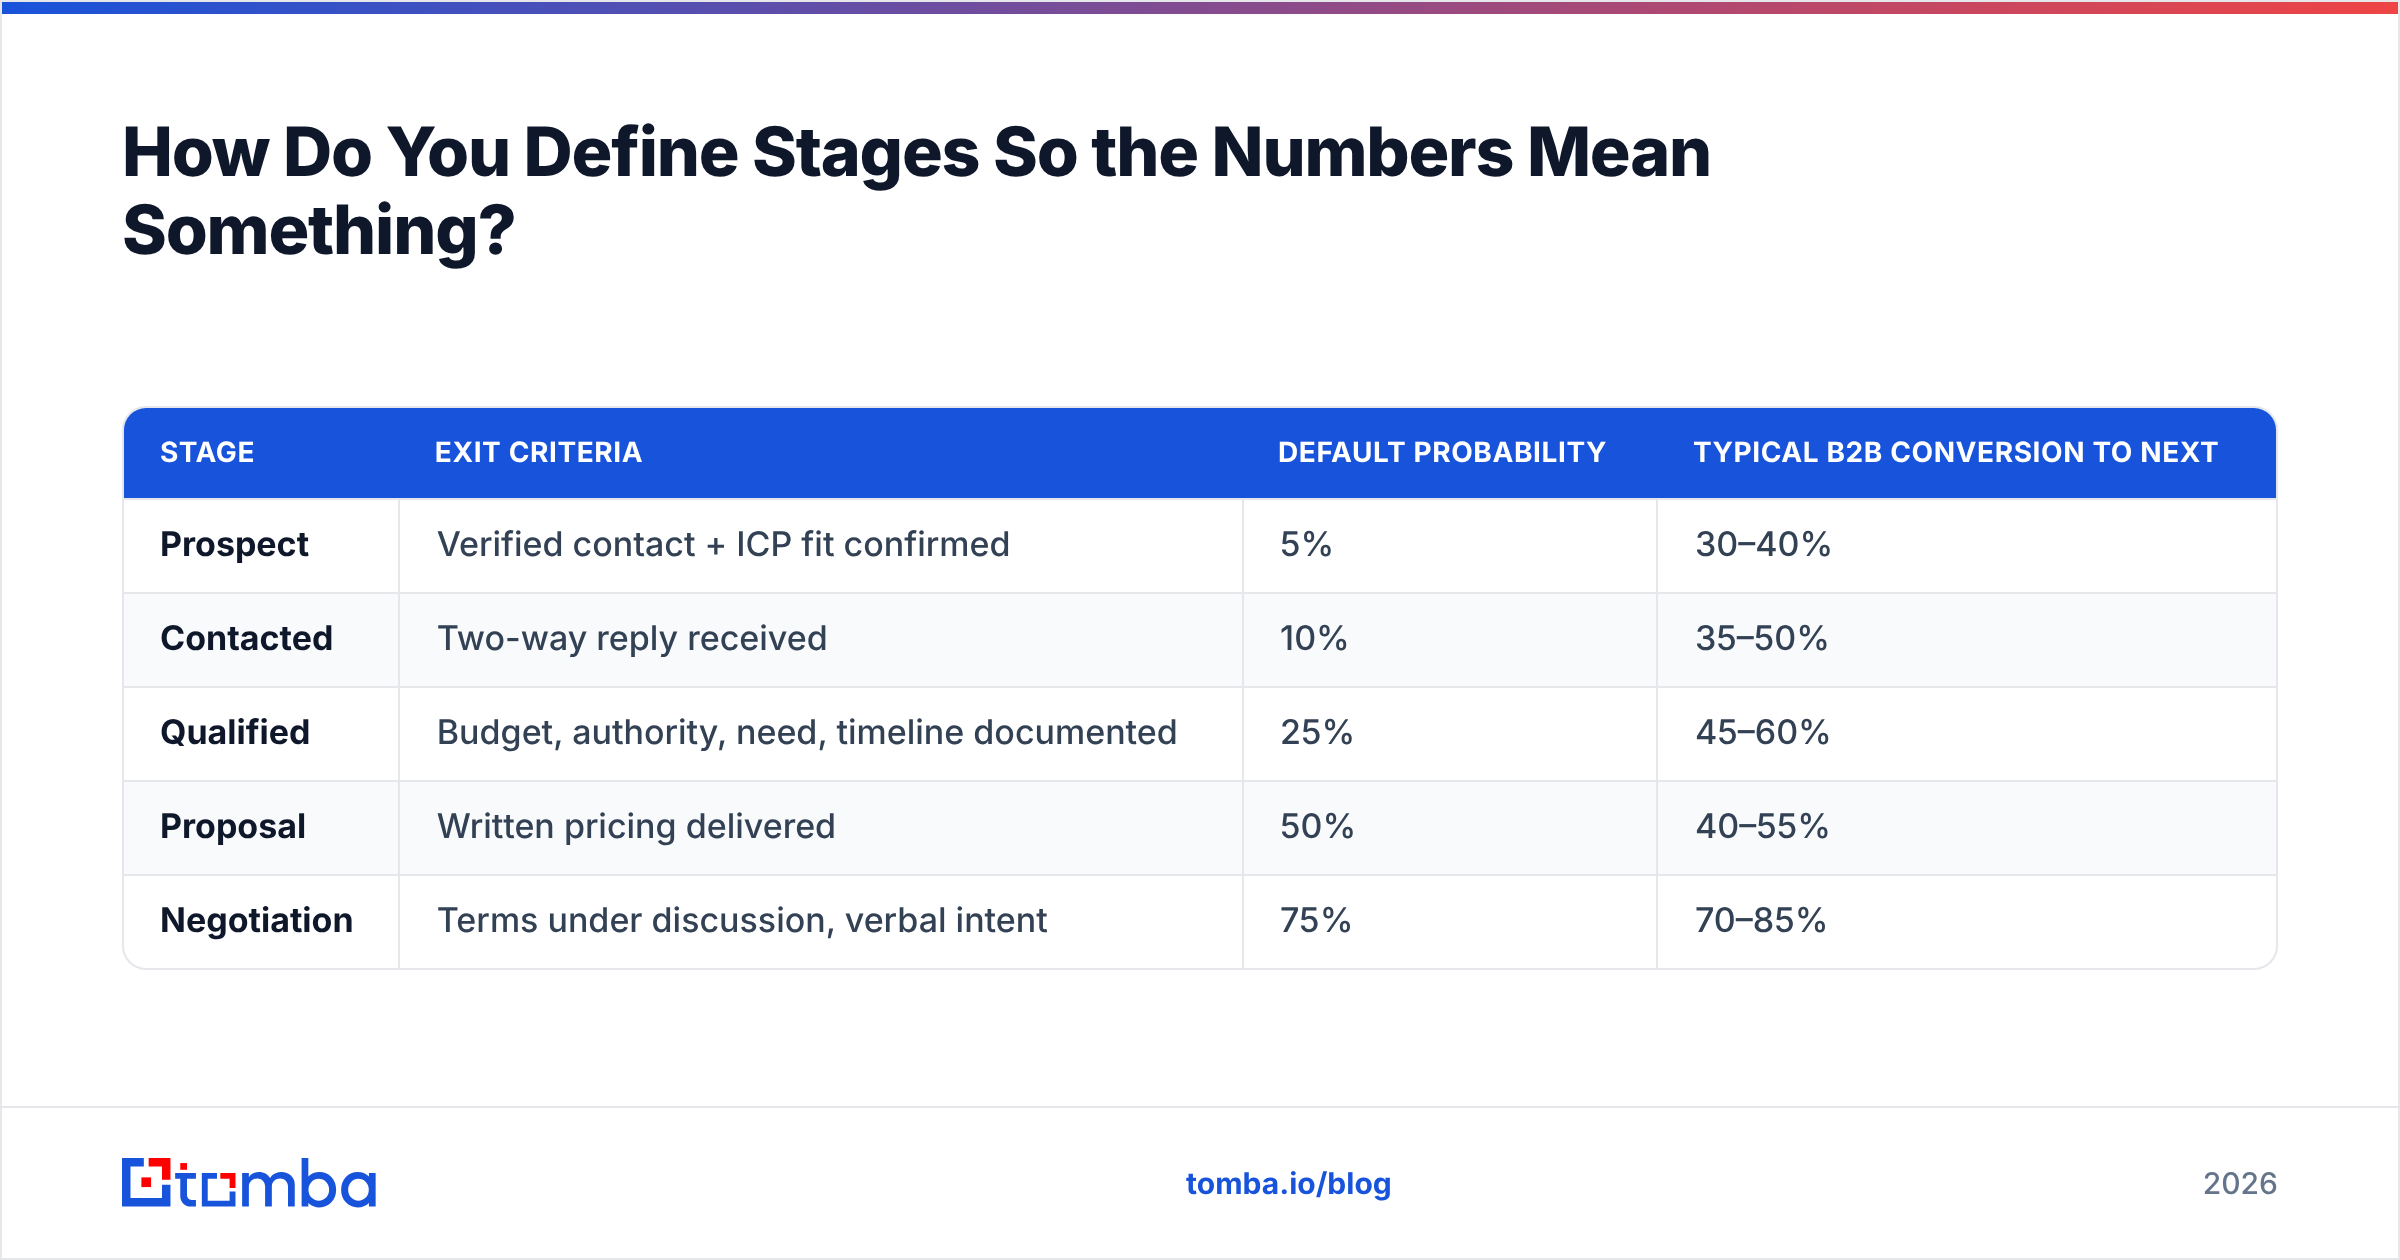
How Do You Define Stages So the Numbers Mean Something?#
Start with five stages, maximum. Every extra stage divides your sample size and makes conversion rates noisier.
| Stage | Exit criteria | Default probability | Typical B2B conversion to next |
|---|---|---|---|
| Prospect | Verified contact + ICP fit confirmed | 5% | 30–40% |
| Contacted | Two-way reply received | 10% | 35–50% |
| Qualified | Budget, authority, need, timeline documented | 25% | 45–60% |
| Proposal | Written pricing delivered | 50% | 40–55% |
| Negotiation | Terms under discussion, verbal intent | 75% | 70–85% |
Those benchmark ranges vary a lot by segment — treat them as a sanity check, not a target. Once you have 60–90 days of your own data, replace the defaults with your actuals. That's the whole point of the Activity Log tab.
The probability column is the one people get wrong. It should be a historical close rate for deals that reached this stage, not a feeling. If 100 deals hit Proposal last year and 43 closed, Proposal is 43% — regardless of how good this quarter's proposals look. When your reported win rate diverges from your weighted forecast by more than 15%, your probabilities are stale.
One rule that keeps the data clean: a deal can move backward. Sales teams that only allow forward movement end up with a Qualified column full of deals that went cold six weeks ago.
How Do You Fill the Funnel Without Manual Data Entry?#
This is where most spreadsheet funnels die. The template is fine; the top of it is empty because filling a row means opening LinkedIn, guessing an email format, and pasting into a cell.
Three approaches, roughly in order of effort:
1. Bulk lookup, then paste. Export your target account list as a CSV of company domains and contact names, run it through a bulk email finder, and paste the verified results straight into the Deals tab. Best for batch prospecting sessions where you build 200 rows at once.
2. A native Sheets add-on. Run the lookup inside the workbook so there's no export/import loop. A Sheets email finder add-on lets you pass a domain and a name from adjacent columns and write the result into the next cell — the funnel populates as you type company names.
3. API + Apps Script. For teams already comfortable with Apps Script, a custom function calling an email finder API turns lookup into a formula. =FINDEMAIL(B2, C2) recalculates on demand, and you can batch overnight with a time-driven trigger.
Whichever route you take, verification matters more in a spreadsheet than in a CRM. A CRM will eventually flag hard bounces back to the record. A Google Sheet will happily hold a dead address for eight months while you wonder why that account never replies. Run the column through an email verifier before any outbound push, and re-verify anything older than 90 days — B2B contact data decays at roughly 22–30% per year as people change jobs.

What About Catch-All Domains?#
If a chunk of your target accounts sit on catch-all servers, standard verification returns "unknown" and your funnel fills with ambiguous rows. Either add a Confidence column and treat catch-alls as a separate risk bucket, or run them through a catch-all verifier that scores deliverability instead of returning a binary. Don't just delete them — catch-all domains skew heavily toward mid-market and enterprise, which is usually where your best deals are.
What Are the Real Limits of a Sheets Funnel?#
Four, and they arrive in this order.
Concurrency. Google Sheets handles simultaneous editing, but sales reps don't. Two people editing the same deal row in the same minute produces a silent overwrite. Mitigate with a per-rep view via FILTER and a strict "only the owner edits their rows" rule.
No activity capture. Every email and call has to be logged by hand. Realistically, reps log about 40% of what they do, which makes your Activity Log tab a systematic undercount. Adjust expectations accordingly, or accept the tab is directional only.
Formula fragility. One person sorts the Deals tab while a VLOOKUP uses a relative reference, and every weighted value shifts by a row. Lock ranges with $, protect the Stages and Forecast tabs, and never let anyone sort without using the built-in filter views.
Scale. Sheets slows noticeably past ~10,000 rows with heavy volatile formulas (TODAY(), INDIRECT, OFFSET). Archive closed deals to a separate workbook quarterly.
None of these are reasons to skip the spreadsheet. They're reasons to know your exit date in advance. Teams that plan the migration at 150 deals migrate calmly; teams that discover the limits at 400 deals migrate in a panic and lose history.
How Do You Migrate Out When You Outgrow It?#
Keep the migration cheap by structuring for it from day one.
- Use a stable Deal ID column. A simple
="D"&TEXT(ROW()-1,"0000")gives every row a permanent handle that survives sorting and import. - Keep one value per cell. No "Contact: Jane Doe (jane@acme.com) — call Tues" blobs. Every CRM importer chokes on those.
- Store dates as real dates, not text. Set the column format explicitly and never type "Q3."
- Match your stage names to your future CRM's defaults where possible. Renaming five stages in a mapping screen is fine; reconciling twelve custom ones isn't.
- Export to CSV monthly as a backup and as a dry run of the eventual import.
When you do move, most CRMs import contacts and deals as separate objects joined by email address — which means the quality of that email column determines whether your migration produces 300 clean records or 300 duplicates. Clean it before you export, not after. Running the list through data enrichment at export time also backfills job titles and company size, which is exactly the data your new CRM will want for lead scoring.
Which Metrics Should the Dashboard Actually Show?#
Skip the vanity charts. Four numbers carry the weight:
- Weighted pipeline vs. quota for the current quarter. If weighted pipeline is under 3x quota, you have a top-of-funnel problem, not a closing problem.
- Stage conversion waterfall. The biggest single drop is your constraint. Fix that before anything else.
- Average days in stage. Rising velocity in one stage usually means a process problem — a missing security review, a slow legal step — not a rep problem.
- Source-to-close rate. Which channel produces deals that actually close, not deals that merely start.
Add a fifth only if you're running outbound at volume: response rate by sequence, pulled from the Activity Log. If response rate is healthy but Qualified conversion is poor, your targeting is off — you're reaching people who reply politely and never buy.
For benchmark context on what "normal" looks like across CRM and pipeline tooling, G2's CRM category is a reasonable neutral reference point, though bear in mind review data skews toward larger deployments.
Build the Sheet, Then Fill It Properly#
A Google Sheets sales funnel template is not a compromise — for a team under three reps, it's usually the right call. Five tabs, four formulas, honest stage definitions, and a rule that every deal gets a real close date. That's a functioning revenue forecast for zero dollars.
The part that costs you isn't the spreadsheet. It's the hours spent hunting for the contact data that fills row 1. Use the Tomba Email Finder to turn a company domain and a name into a verified email in one call — via the Sheets add-on, a bulk CSV run, or the API inside Apps Script. The free tier covers 25 searches a month to test the workflow; paid plans start at $49/mo on Starter and $99/mo on Growth, with full Tomba pricing laid out per credit tier. Build the funnel this afternoon, fill it tomorrow, and let the conversion math tell you where your revenue is leaking.
Related guides#
Ready to find emails that actually work?
Join 150,000+ professionals who stopped guessing and started sending. Free credits on signup — no credit card required.
Get the Tomba newsletter
Practical outbound tactics and product updates — once every two weeks.
About the author