Google Sheets Sales Pipeline Template: Build One That Works
A free Google Sheets sales pipeline template only works if the columns, formulas, and data feeding it are right. Here is the exact build, plus when a spreadsheet stops being enough.

TL;DR
- A google sheets sales pipeline template is the right call under roughly 300 open deals and 5 reps — past that, the manual data entry costs more than a CRM seat.
- The template only needs 12 columns. Most free templates ship 30+ and every extra column is a field your reps will leave blank.
- Weighted pipeline value (
Deal Value × Stage Probability) is the single formula that turns a list of deals into a forecast. - Garbage contact data breaks the sheet before the formulas do. Verify emails before they enter row 2, not after a bounce.
- Build it yourself in 20 minutes rather than downloading a template — you will understand the formulas when they break.
What is a Google Sheets sales pipeline template?#
A sales pipeline template in Google Sheets is a structured spreadsheet where each row is one deal, each column is one attribute of that deal, and a handful of formulas roll those rows into stage counts, weighted forecast, and conversion rates.
That is it. It is not a CRM. It has no activity logging, no email sync, no reminders that fire on their own. What it has instead is total transparency: you can see every formula, change any column in three seconds, and share it with your co-founder without a per-seat invoice.
The trade is real. A spreadsheet stores state well and captures behavior badly. It will happily tell you that Acme Corp is in Negotiation at $40,000. It will never tell you nobody has touched Acme Corp in 19 days unless you build that alert yourself — which, to be fair, you can, and we will.

Which columns does a sales pipeline sheet actually need?#
Twelve. Here is the schema, and the reason each one earns its place:
- Deal ID — a simple sequential number or
ACME-001. You need a stable key the moment you start cross-referencing tabs withVLOOKUPorXLOOKUP. - Company — the account name, not the contact. Pipelines are counted by account, not by person.
- Contact name + email — the two fields that decide whether the deal is workable. A row with no verified email is a wish, not a deal.
- Stage — a data-validated dropdown. Five stages maximum: New, Qualified, Demo, Proposal, Negotiation. Every stage you add halves the sample size in your conversion math.
- Deal value — the annual contract value, formatted as currency. One number, one currency, no "roughly $20-30k" text strings.
- Probability — auto-filled from the stage via a lookup, never typed by a rep. Reps are optimists; a lookup table is not.
- Expected close date — drives your monthly forecast and your overdue-deal conditional formatting.
- Owner — required even at two reps, because it powers your per-rep filter views later.
- Source — inbound, outbound, referral, partner. This is the column founders skip and regret six months in when they cannot say which channel pays.
- Last activity date — the stall detector. Everything interesting comes from this column.
- Next step — a free-text sentence. If a rep cannot write one, the deal is not real.
- Notes — one cell, wrapped. Resist the urge to split it into six.
Anything beyond these twelve is a column your team stops filling in by week three, and a half-filled column is worse than no column because it makes every roll-up formula lie.
Which formulas turn the sheet into a forecast?#
Four formulas do the entire job. Put them on a separate Dashboard tab so nobody edits them while sorting the deal list.
Weighted pipeline value:
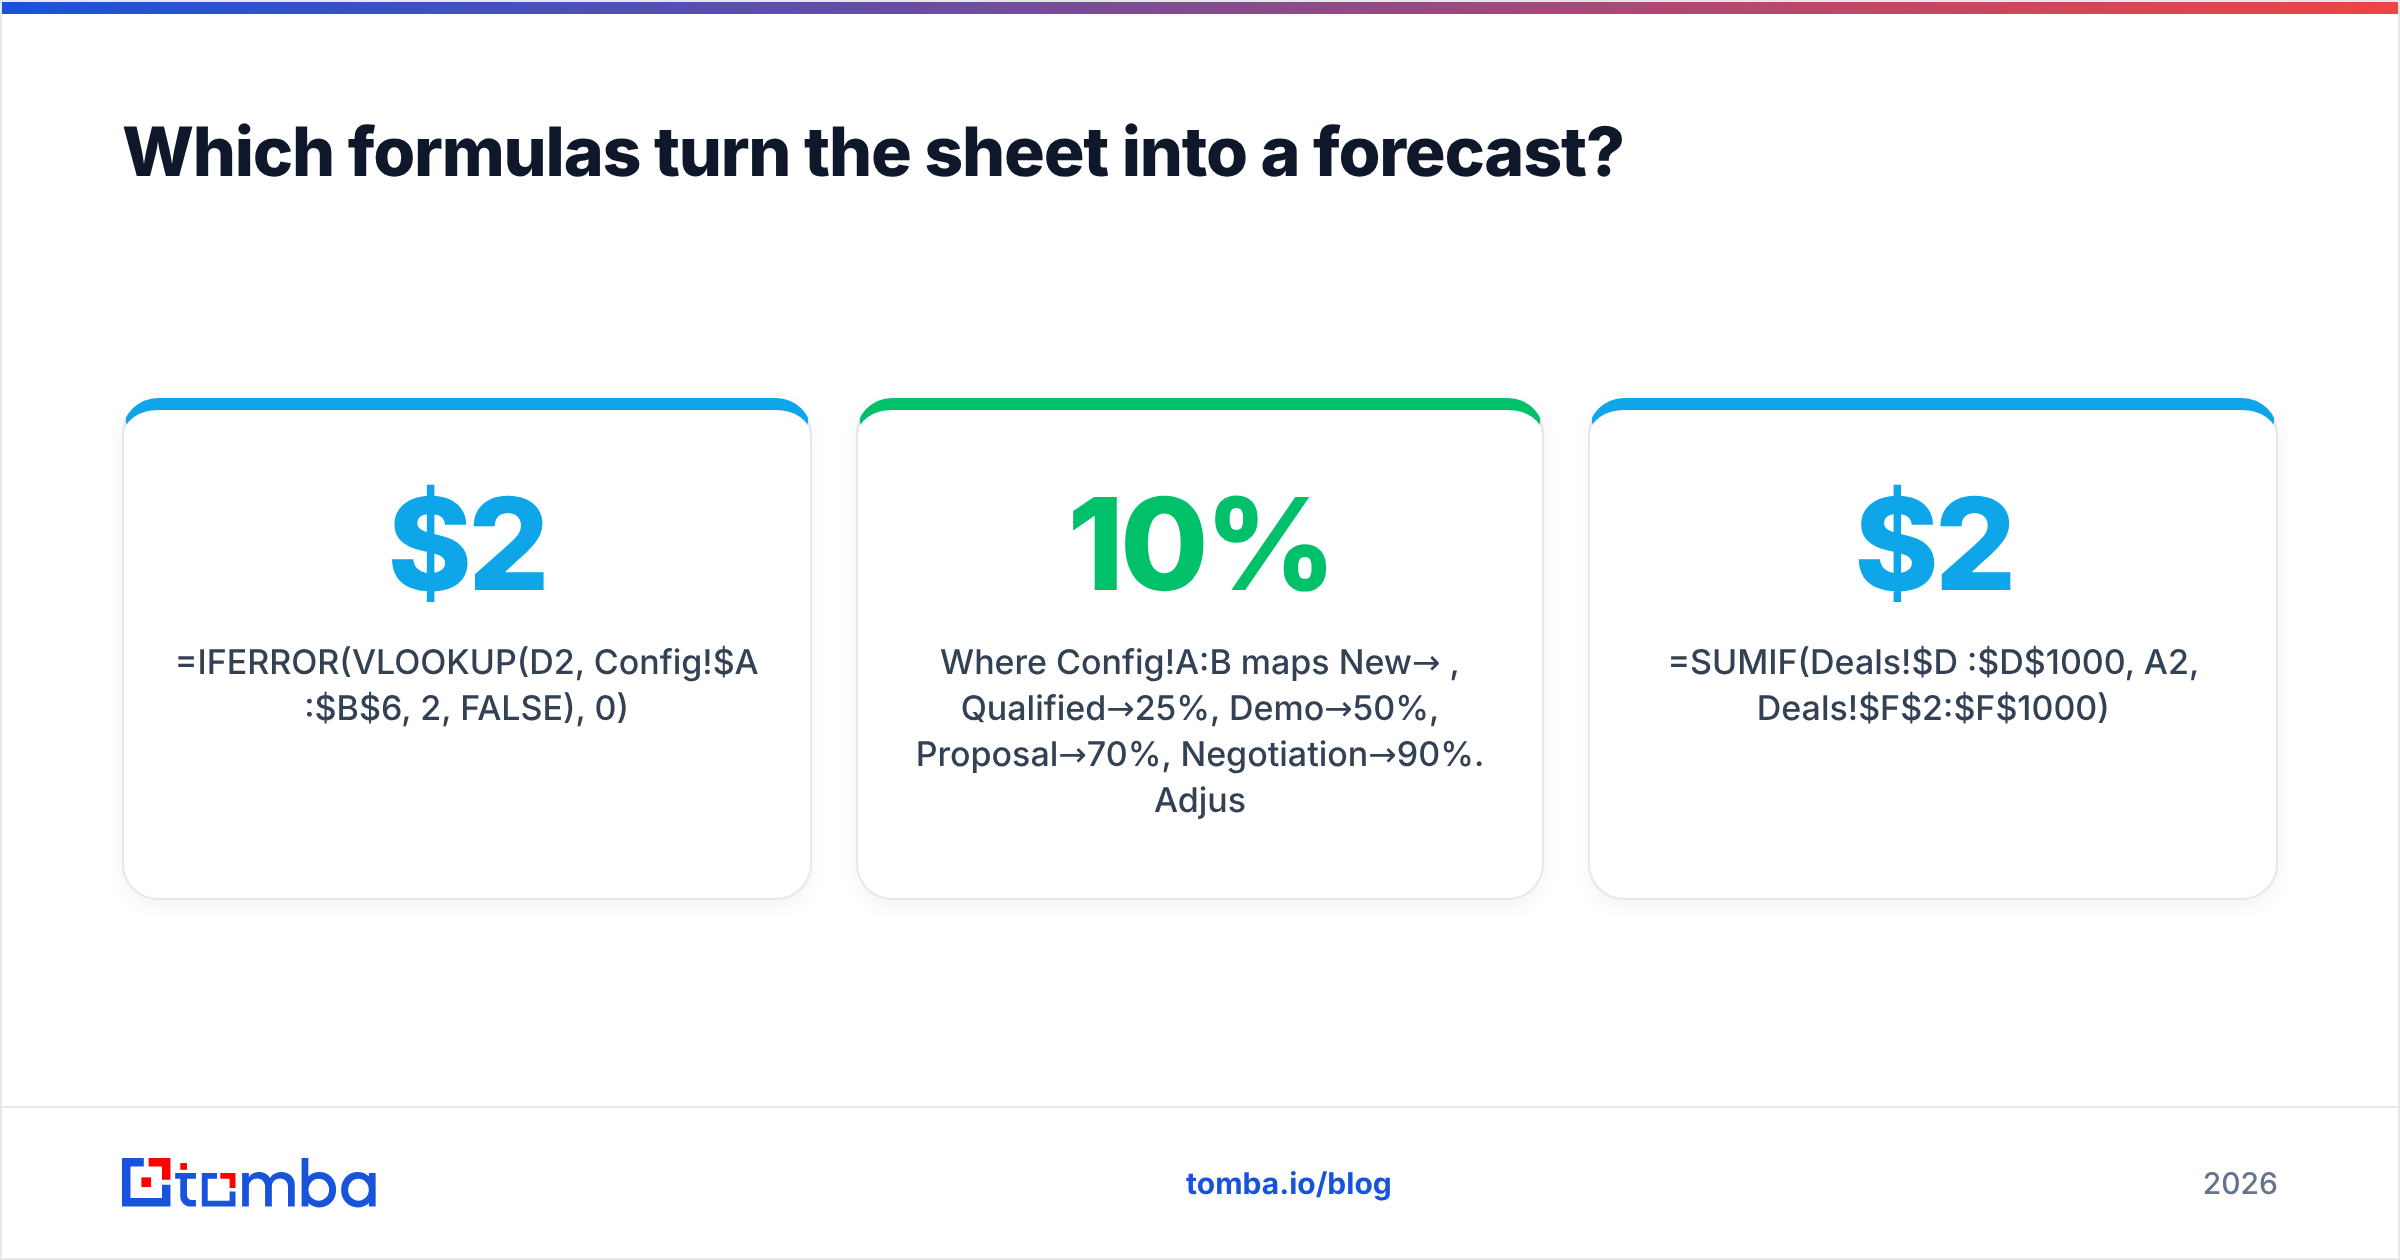
=SUMPRODUCT(Deals!F2:F1000, Deals!G2:G1000)Deal value times probability, summed. This is your realistic forecast — the number you say out loud to a board or a bank.
Stage probability lookup (put this in the Probability column so it self-fills):
=IFERROR(VLOOKUP(D2, Config!$A$2:$B$6, 2, FALSE), 0)Where Config!A:B maps New→10%, Qualified→25%, Demo→50%, Proposal→70%, Negotiation→90%. Adjust those to your own historical close rates after 50 closed deals — the defaults are placeholders, not truth.
Pipeline by stage:
=SUMIF(Deals!$D$2:$D$1000, A2, Deals!$F$2:$F$1000)Stall detector (conditional formatting rule on the whole row, custom formula):
=AND($J2<>"", TODAY()-$J2>14)Any deal untouched for 14 days turns amber. Set 21 days for enterprise cycles, 7 for transactional. This single rule catches more slipped revenue than any dashboard you will build.
Two guardrails: freeze row 1, and protect the Dashboard tab (Data → Protect sheets and ranges). Half of all spreadsheet pipeline failures are someone sorting a range without selecting the whole table and permanently scrambling the rows.
Is Google Sheets better than a CRM for pipeline management?#
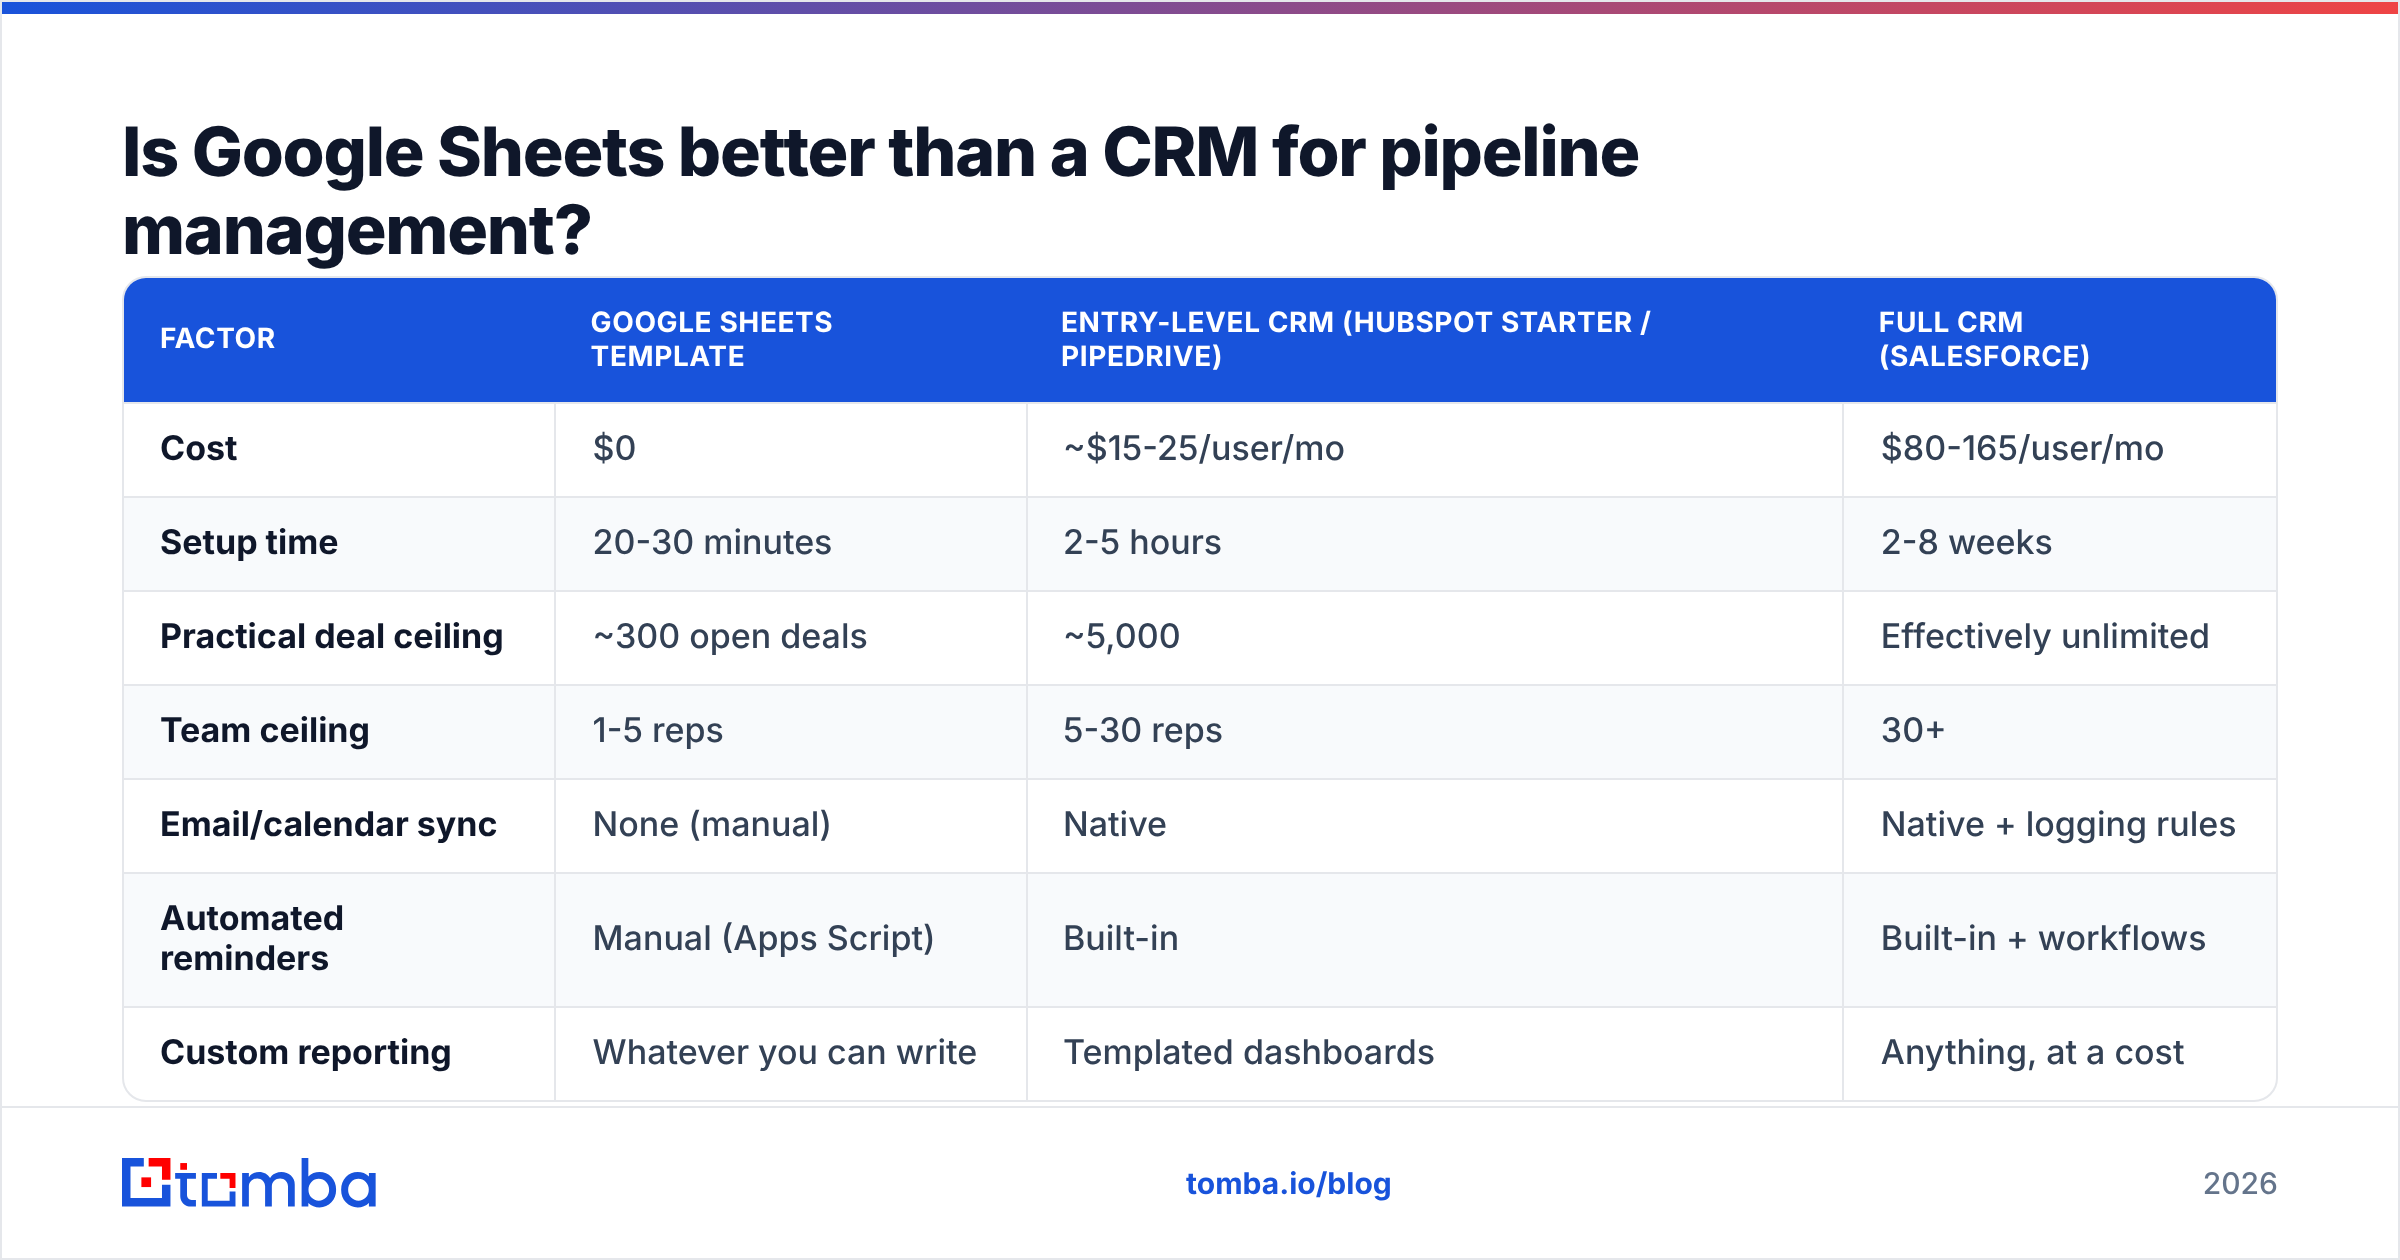
Below a certain scale, yes — and the honest breakpoint is narrower than either spreadsheet evangelists or CRM sales reps will tell you.
| Factor | Google Sheets template | Entry-level CRM (HubSpot Starter / Pipedrive) | Full CRM (Salesforce) |
|---|---|---|---|
| Cost | $0 | ~$15-25/user/mo | $80-165/user/mo |
| Setup time | 20-30 minutes | 2-5 hours | 2-8 weeks |
| Practical deal ceiling | ~300 open deals | ~5,000 | Effectively unlimited |
| Team ceiling | 1-5 reps | 5-30 reps | 30+ |
| Email/calendar sync | None (manual) | Native | Native + logging rules |
| Automated reminders | Manual (Apps Script) | Built-in | Built-in + workflows |
| Custom reporting | Whatever you can write | Templated dashboards | Anything, at a cost |
| Audit trail | Version history only | Full activity timeline | Full + field-level history |
| Data hygiene tooling | None built in | Dedupe + validation | Dedupe, validation, enrichment |
| Best for | Founder-led sales, first 100 deals | Growing team, repeatable motion | Multi-team, complex process |
The switching signal is not deal count — it is time spent on data entry. When your reps burn more than 30 minutes a day keeping the sheet honest, a $20 seat is already cheaper than the hours. Pipedrive's own pipeline guidance and HubSpot's pipeline documentation both land in the same place, which is unusual for vendor content and worth noting.
The other honest point: a spreadsheet's version history is a weak audit trail. If two reps overwrite the same cell on the same day, you can restore it, but nobody will notice for a week.
How do you keep the data in the sheet clean?#
This is where most spreadsheet pipelines quietly die, and it has nothing to do with formulas.
A pipeline sheet is only as good as the contacts inside it. Rows with stale, guessed, or malformed emails inflate your deal count, poison your conversion math, and burn your sending domain when you actually try to reach out. Three habits fix it:
- Verify before entry, not after bounce. Run every address through an email verifier before it becomes a row. A bounced address is not a lost deal — it is a deal that never existed, and it has been sitting in your forecast for a month.
- Fill gaps at the domain level. When you have a company but no named contact, a domain search returns the addresses and the company's email pattern, so you can add the right decision-maker instead of
info@. - Pull data into the sheet directly. The Google Sheets add-on lets you find and verify addresses in the same tab where the pipeline lives, which removes the copy-paste step where most errors are introduced.
Add one more column-level guardrail: data validation on the email column with a regex, so a typo like name@company cannot be saved at all. Data → Data validation → Custom formula:
=REGEXMATCH(E2, "^[^@\s]+@[^@\s]+\.[^@\s]+$")That catches format errors. It does not catch a perfectly-formatted address that does not exist — only verification does that.

What should a filled-in pipeline row look like?#
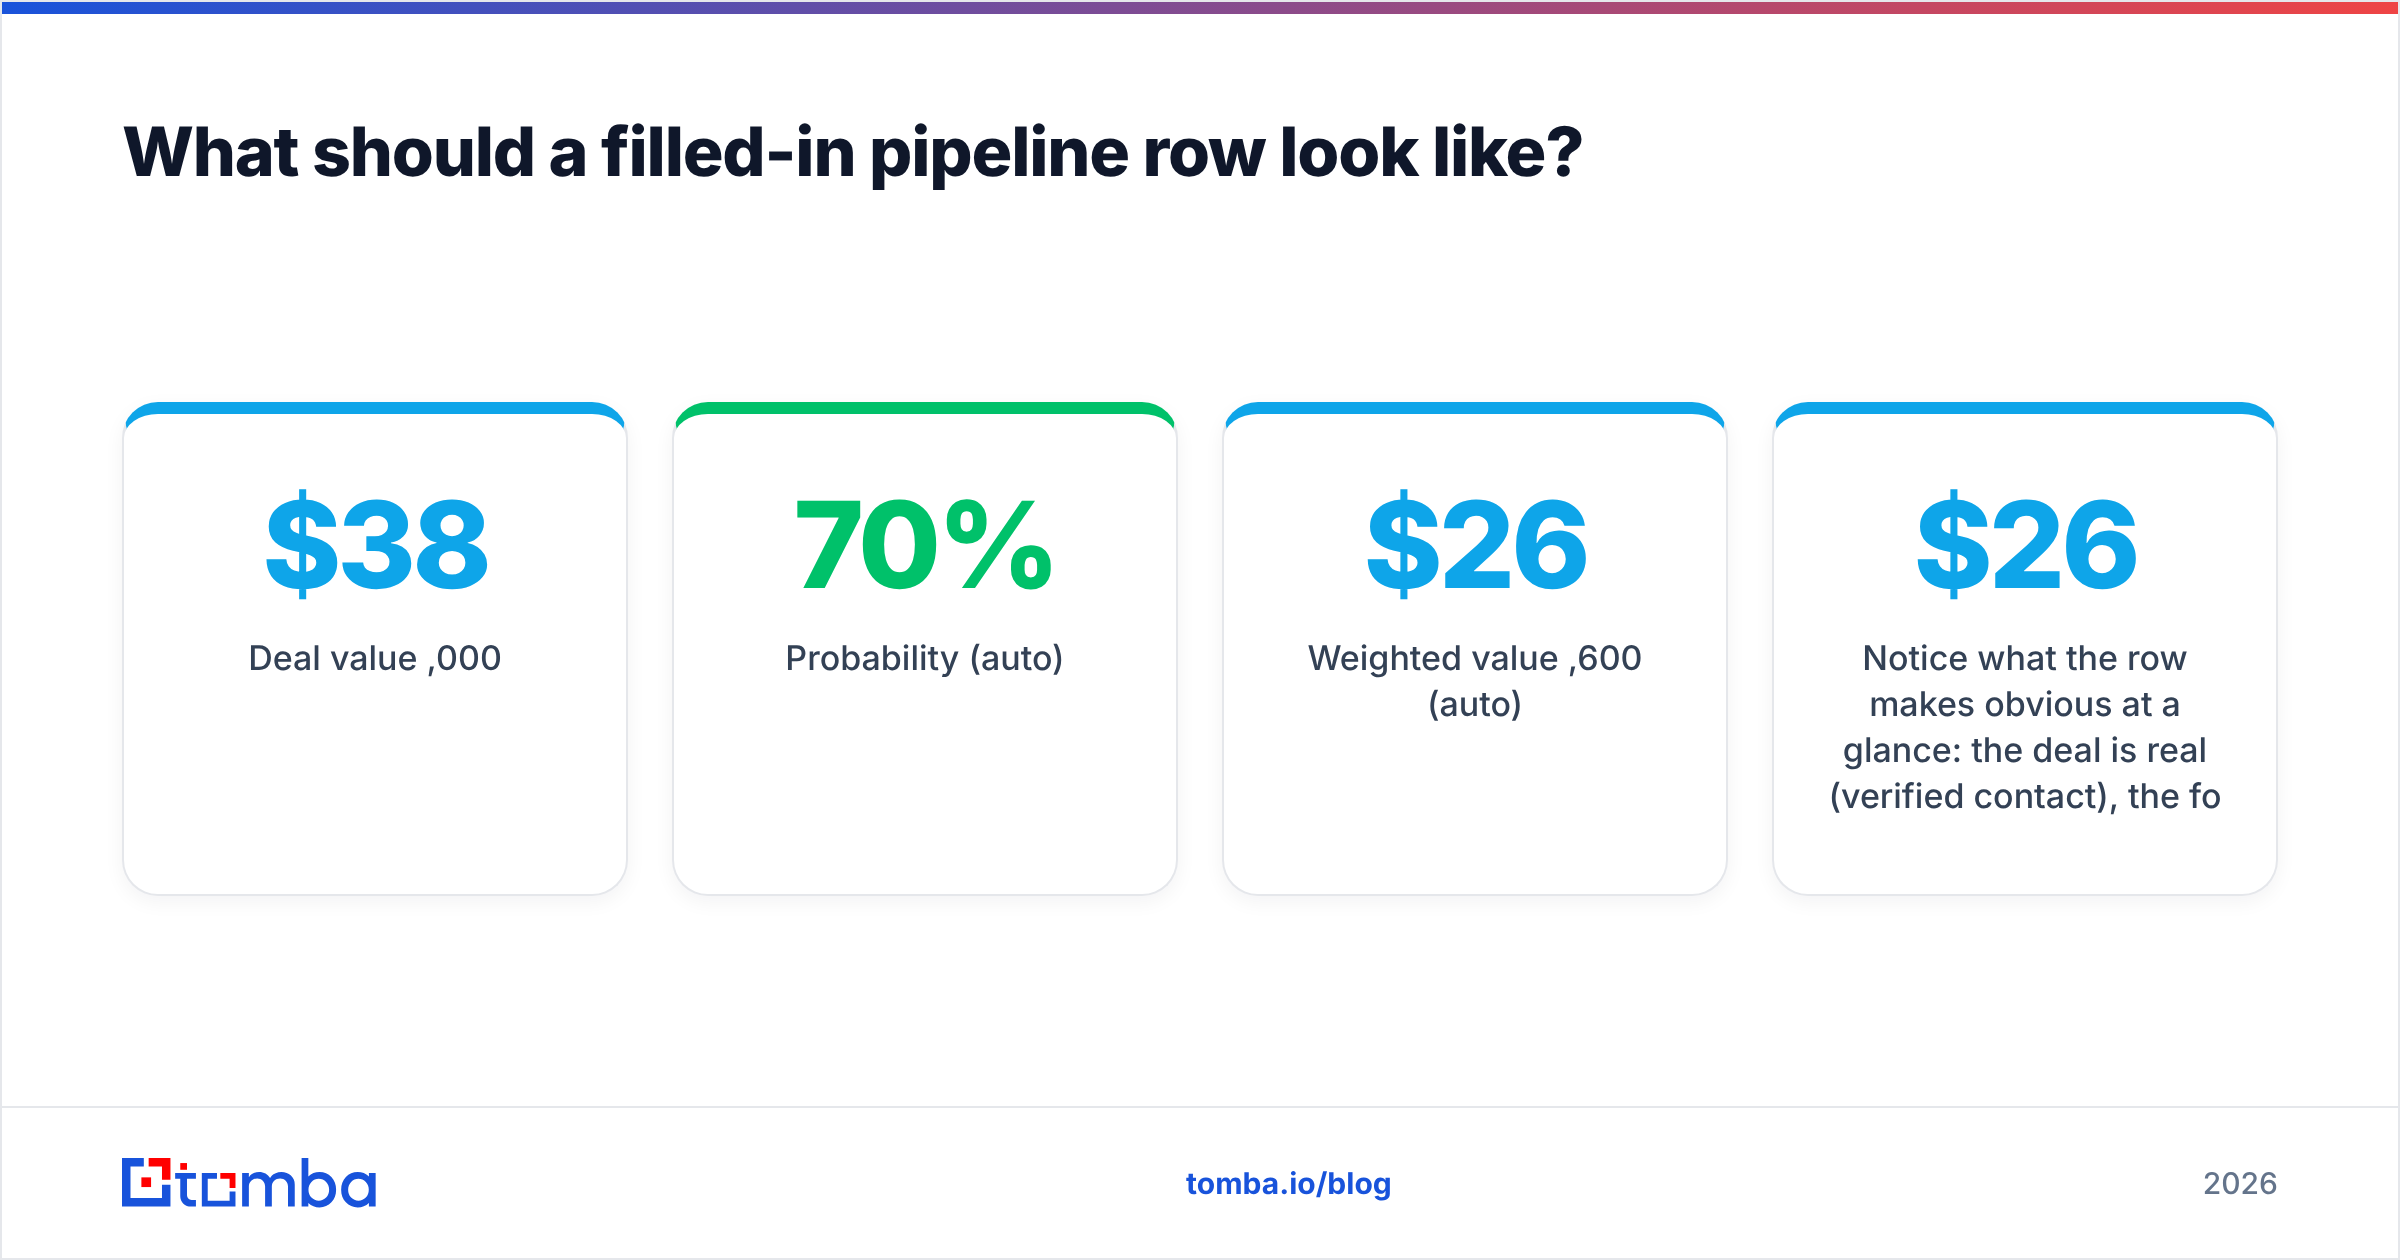
Concrete beats abstract. Here is a single deal across the twelve columns, as it would appear mid-cycle:
| Column | Value |
|---|---|
| Deal ID | ACME-014 |
| Company | Acme Logistics |
| Contact | Dana Reyes — dana.reyes@acmelogistics.com (verified) |
| Stage | Proposal |
| Deal value | $38,000 |
| Probability | 70% (auto) |
| Weighted value | $26,600 (auto) |
| Expected close | 2026-10-15 |
| Owner | J. Okafor |
| Source | Outbound |
| Last activity | 2026-08-22 |
| Next step | Send revised SOW with 3-year pricing by Friday |
Notice what the row makes obvious at a glance: the deal is real (verified contact), the forecast contribution is $26,600 not $38,000, and it was touched six days ago so the stall rule has not fired. That is the entire value of a well-built template — three judgments in one second of reading.
How do you add automation without leaving Sheets?#
Google Apps Script covers the three automations that matter most, and you do not need to be a developer to paste them in (Extensions → Apps Script).
- Weekly digest email. A time-driven trigger that emails you total pipeline, weighted pipeline, and every deal stalled past 14 days each Monday at 8am. Roughly 20 lines.
- Stage-change timestamp. An
onEdittrigger that writes today's date into Last Activity whenever the Stage cell changes. This removes the single most-forgotten manual step. - Slack webhook on closed-won. Fires a message when Stage flips to Closed Won. Morale tooling, and it also makes people update the sheet.
Two things Apps Script will not solve: it cannot sync your inbox, and it cannot enrich a contact. For enrichment, a data enrichment call or the Tomba API can fill company size, role, and location into columns you would otherwise research by hand — which is usually 60-70% of the time cost of maintaining a pipeline sheet.
If you would rather see how other teams structure this, G2's sales pipeline category is a reasonable place to compare what CRMs bundle versus what you would rebuild manually.
When should you migrate off the spreadsheet?#
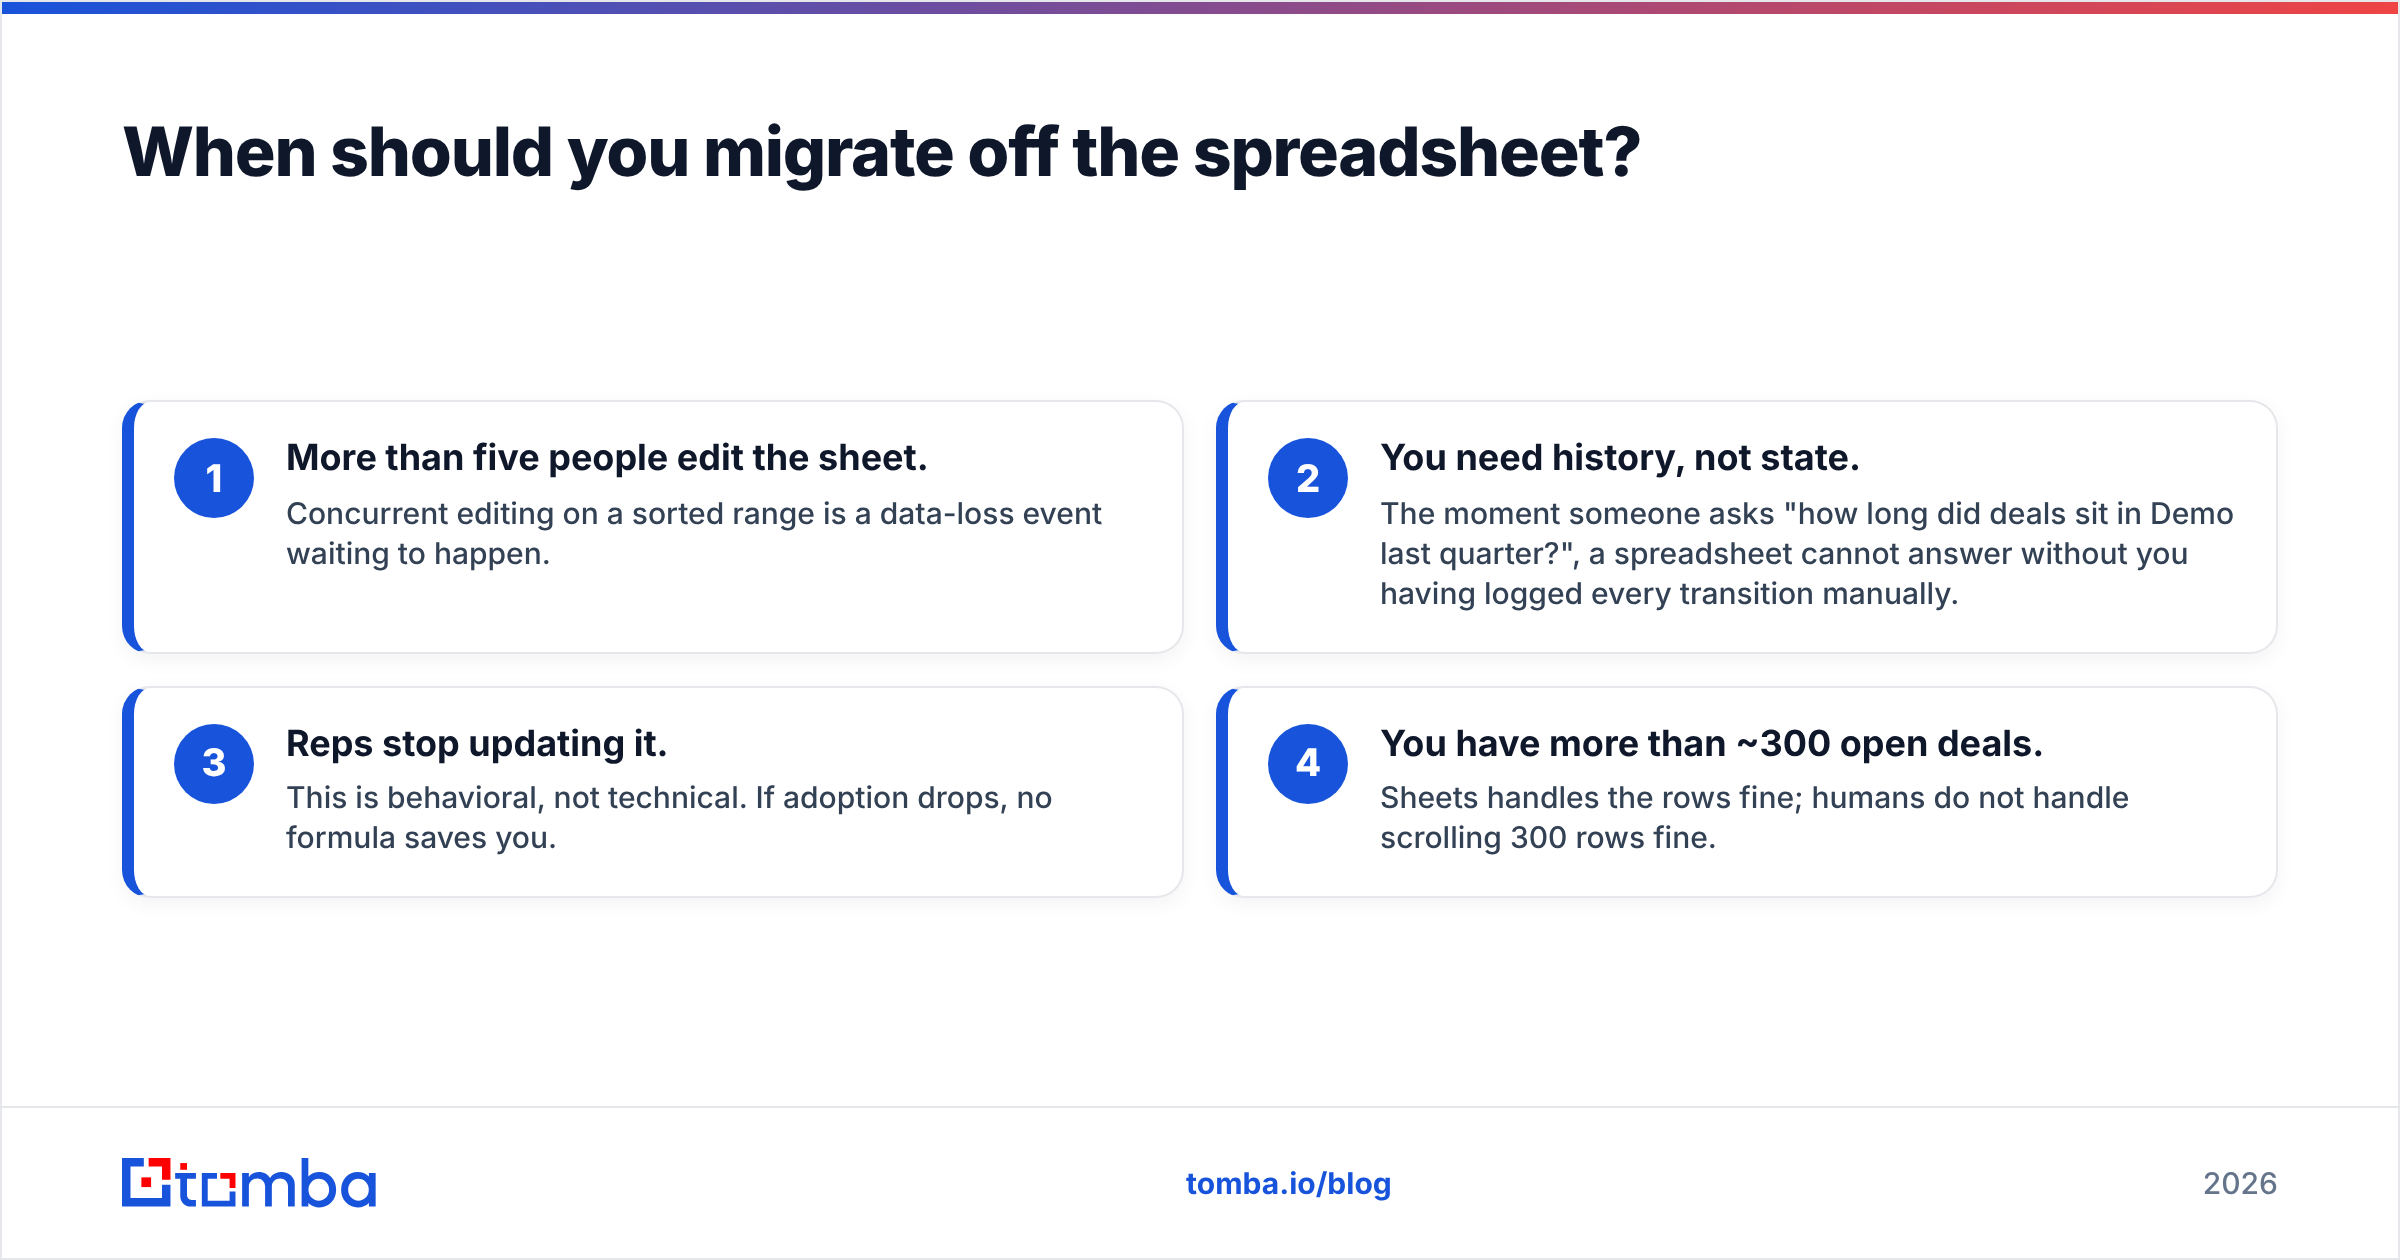
Four signals, any one of which is enough:
- More than five people edit the sheet. Concurrent editing on a sorted range is a data-loss event waiting to happen.
- You need history, not state. The moment someone asks "how long did deals sit in Demo last quarter?", a spreadsheet cannot answer without you having logged every transition manually.
- Reps stop updating it. This is behavioral, not technical. If adoption drops, no formula saves you.
- You have more than ~300 open deals. Sheets handles the rows fine; humans do not handle scrolling 300 rows fine.
Migrate by exporting to CSV with clean, consistent column headers — which is far easier if you kept the schema at twelve columns from day one. That discipline is the actual gift the spreadsheet gives you: it forces you to decide what you truly track before a CRM lets you track everything and mean nothing.
Frequently asked questions#
Is there a genuinely free Google Sheets sales pipeline template? Plenty exist, but most are lead-magnets bloated with 30 columns and locked tabs. Building your own from the twelve-column schema above takes about 20 minutes and leaves you able to fix your own formulas.
How many stages should the pipeline have? Five. With fewer, stage probability stops being informative; with more, each stage has too few deals for the conversion rate to mean anything until you are doing hundreds of deals a quarter.
Can I track multiple currencies? Yes, but add a Currency column and a fixed conversion rate in Config — never let Sheets auto-convert. You want your Q3 forecast to be reproducible next year, not silently repriced by a live rate.
Does the weighted forecast replace a committed forecast? No. Weighted pipeline is a statistical expectation across many deals; a commit is a rep-by-rep judgment on specific deals. Track both, and expect the weighted number to be more accurate above 30 open deals and less accurate below it.
Where do you go from here?#
Build the sheet today with twelve columns and four formulas, then spend your energy on the part that actually determines whether the pipeline fills: the quality of the contacts going into row 2.
That is the constraint a template cannot fix. Use Tomba Email Finder to find and verify the decision-maker's address before it enters your pipeline — 25 free searches a month to test it, then $49/mo on Starter if it earns a place in your stack. See Tomba pricing for the full breakdown across Growth and Pro. A clean sheet with 40 verified contacts beats a beautiful dashboard sitting on 400 guesses, every quarter.
Related guides#
Ready to find emails that actually work?
Join 150,000+ professionals who stopped guessing and started sending. Free credits on signup — no credit card required.
Get the Tomba newsletter
Practical outbound tactics and product updates — once every two weeks.
About the author