GRR vs NRR: How to Read Both Retention Metrics in 2026
Gross revenue retention and net revenue retention answer two different questions, and boards get burned when they only track one. Here's how each is calculated, where NRR hides churn, and which number to lead with.
TL;DR
- GRR (gross revenue retention) measures how much recurring revenue you keep from existing customers before any expansion. It can never exceed 100%.
- NRR (net revenue retention) adds upsells, cross-sells, and seat growth on top. It can exceed 100% — and often does, which is exactly why it flatters bad retention.
- A company with 128% NRR and 71% GRR is not healthy. It has a leaky bucket masked by a handful of whales expanding.
- Report both. GRR tells you whether the product is worth keeping; NRR tells you whether the account team is monetizing the customers who stay.
- 2026 benchmarks: median SMB SaaS lands near 80-85% GRR, mid-market 85-90%, enterprise 90-95%. NRR above 110% is good, above 120% is top decile.
What are GRR and NRR?#
Both metrics answer the same broad question — "what happened to the revenue we already had?" — but they draw the line in different places.
Think of it like a bathtub. GRR measures how fast water drains out. NRR measures the water level after you also count the tap running into the same tub. If the tap is wide open, you can have a badly cracked drain and still see the level rise. That is the entire GRR vs NRR debate in one image.
Here are the mechanics:
- Starting ARR — the annual recurring revenue from a defined cohort of customers at the beginning of the period (usually 12 months ago). New logos acquired during the period are excluded from both metrics.
- Downgrades — existing customers who reduce seats, drop modules, or renegotiate to a cheaper tier. Counted against both GRR and NRR.
- Churn — customers who cancelled outright. Counted against both.
- Expansion — upsells, cross-sells, seat additions, usage overages, and price increases on existing accounts. Counted only in NRR.
- Reactivation — a churned customer who returns. Most teams count this as new business, not expansion, but the treatment must be consistent across periods.
The formulas:
- GRR = (Starting ARR − Downgrades − Churn) ÷ Starting ARR
- NRR = (Starting ARR + Expansion − Downgrades − Churn) ÷ Starting ARR
The only structural difference is that expansion term. Everything else is identical. That is why GRR is always ≤ 100% and NRR has no ceiling.
How do you actually calculate GRR and NRR?#
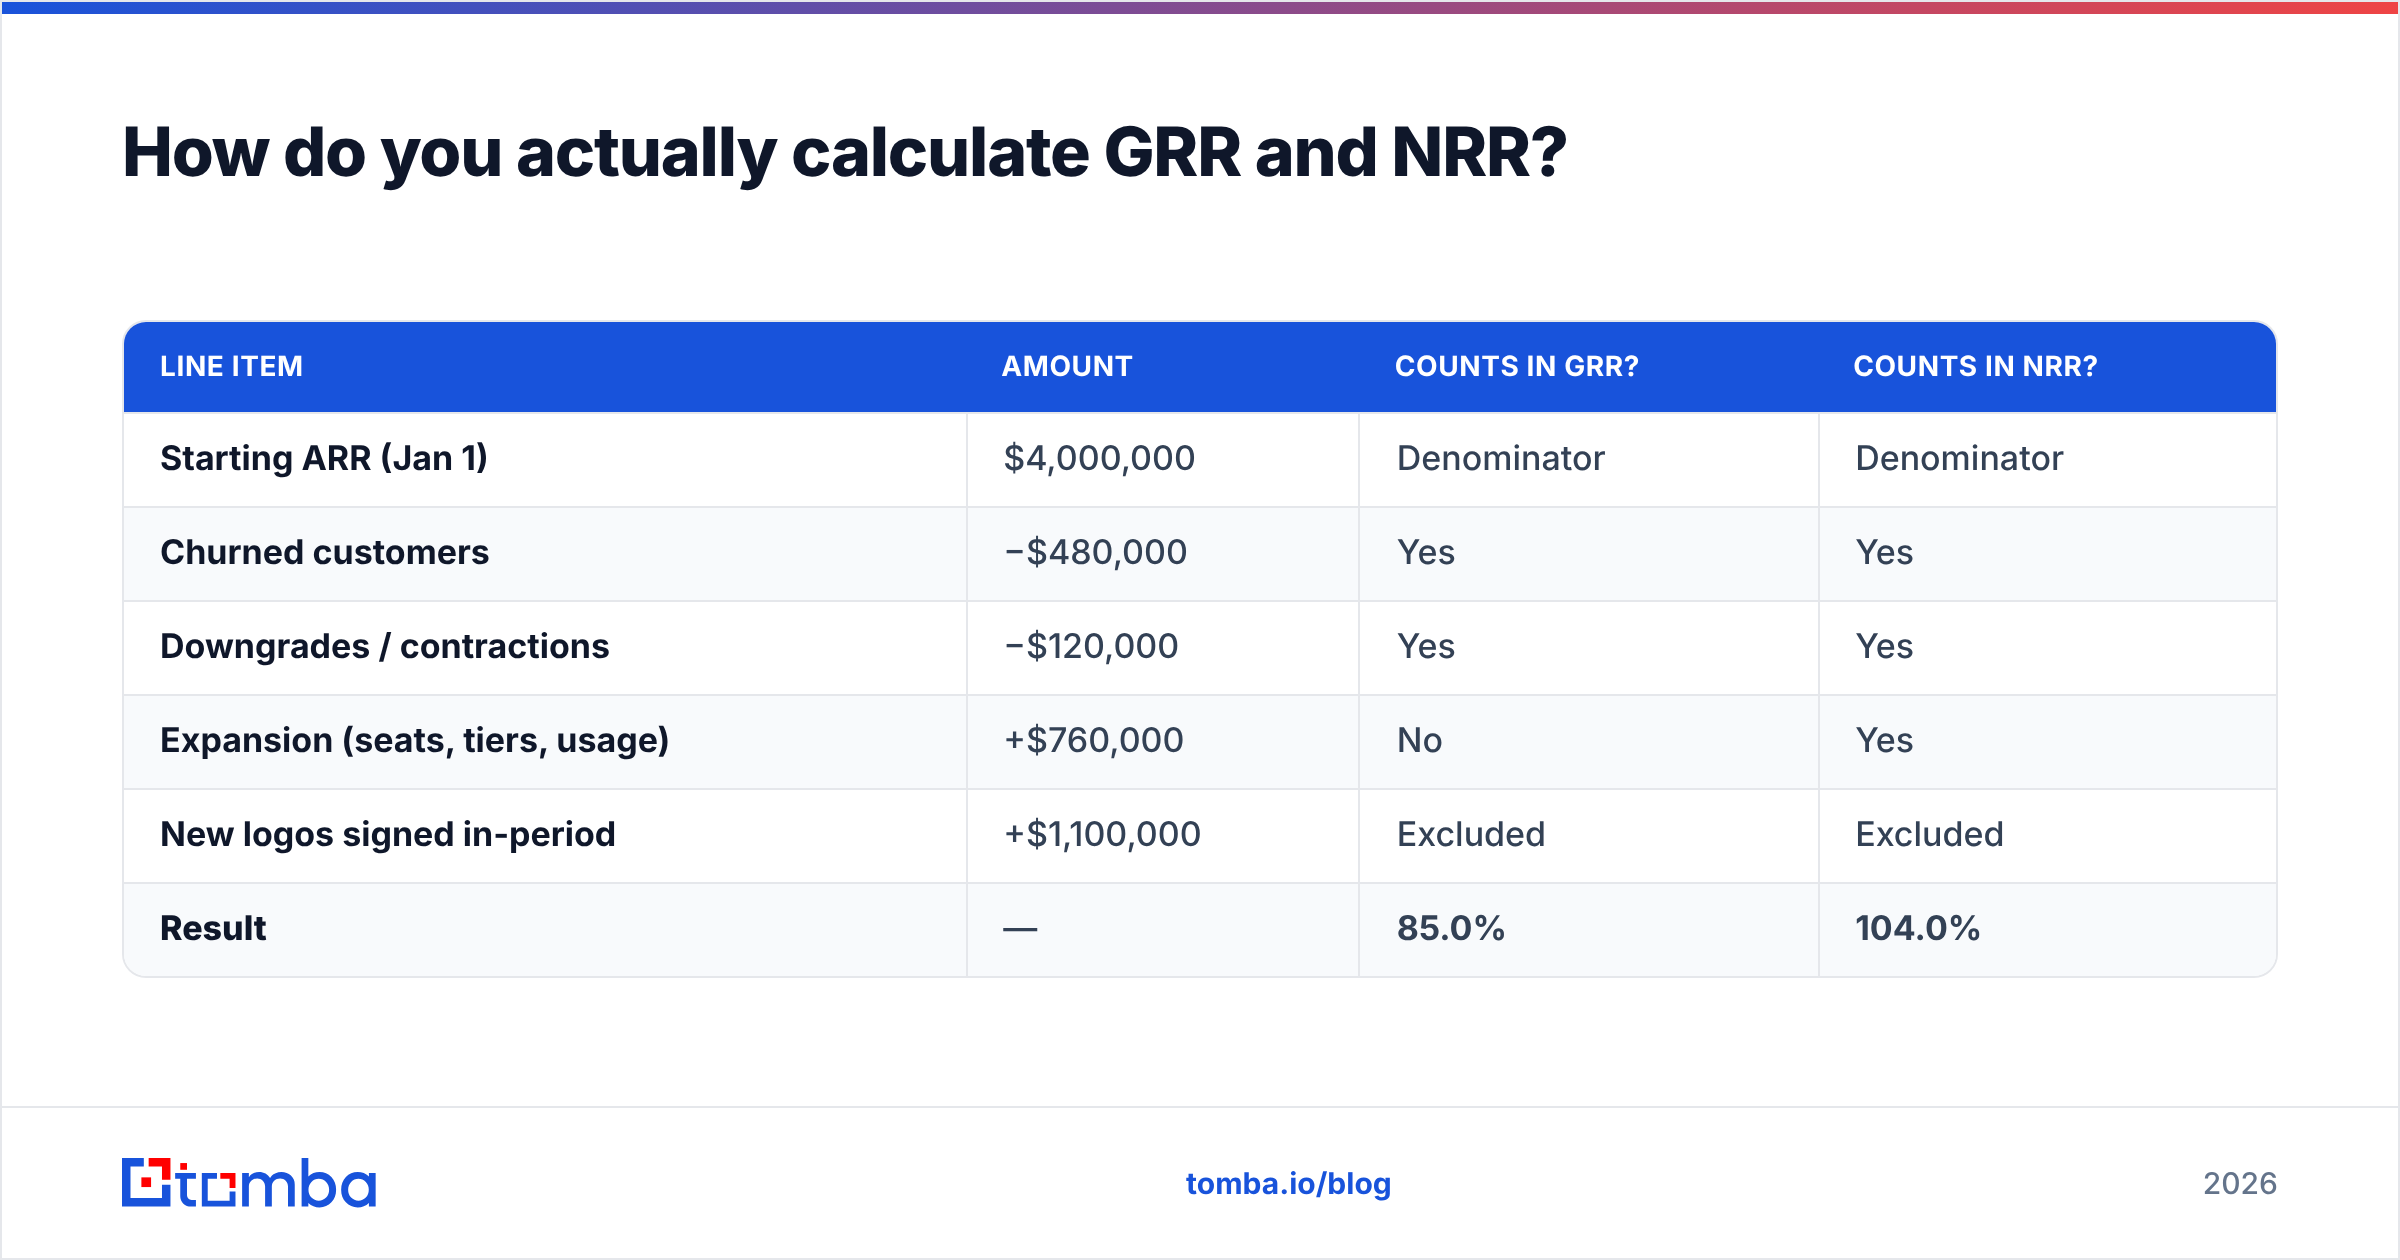
Run a concrete cohort. Say you started the year with $4,000,000 in ARR across 200 customers.
| Line item | Amount | Counts in GRR? | Counts in NRR? |
|---|---|---|---|
| Starting ARR (Jan 1) | $4,000,000 | Denominator | Denominator |
| Churned customers | −$480,000 | Yes | Yes |
| Downgrades / contractions | −$120,000 | Yes | Yes |
| Expansion (seats, tiers, usage) | +$760,000 | No | Yes |
| New logos signed in-period | +$1,100,000 | Excluded | Excluded |
| Result | — | 85.0% | 104.0% |
GRR = (4,000,000 − 480,000 − 120,000) ÷ 4,000,000 = 85.0%
NRR = (4,000,000 + 760,000 − 480,000 − 120,000) ÷ 4,000,000 = 104.0%
Notice the gap: 19 percentage points. That gap is the single most useful number nobody reports. It tells you how much of your "growth from existing customers" is really just a small group of accounts expanding fast enough to paper over a 15% leak.
New logos are deliberately excluded. Blending acquisition into retention is the most common way teams accidentally report a number that looks like NRR but isn't. If your ARR grew 40% and you report that as retention, you are measuring sales, not retention.
GRR vs NRR: what is the real difference?#
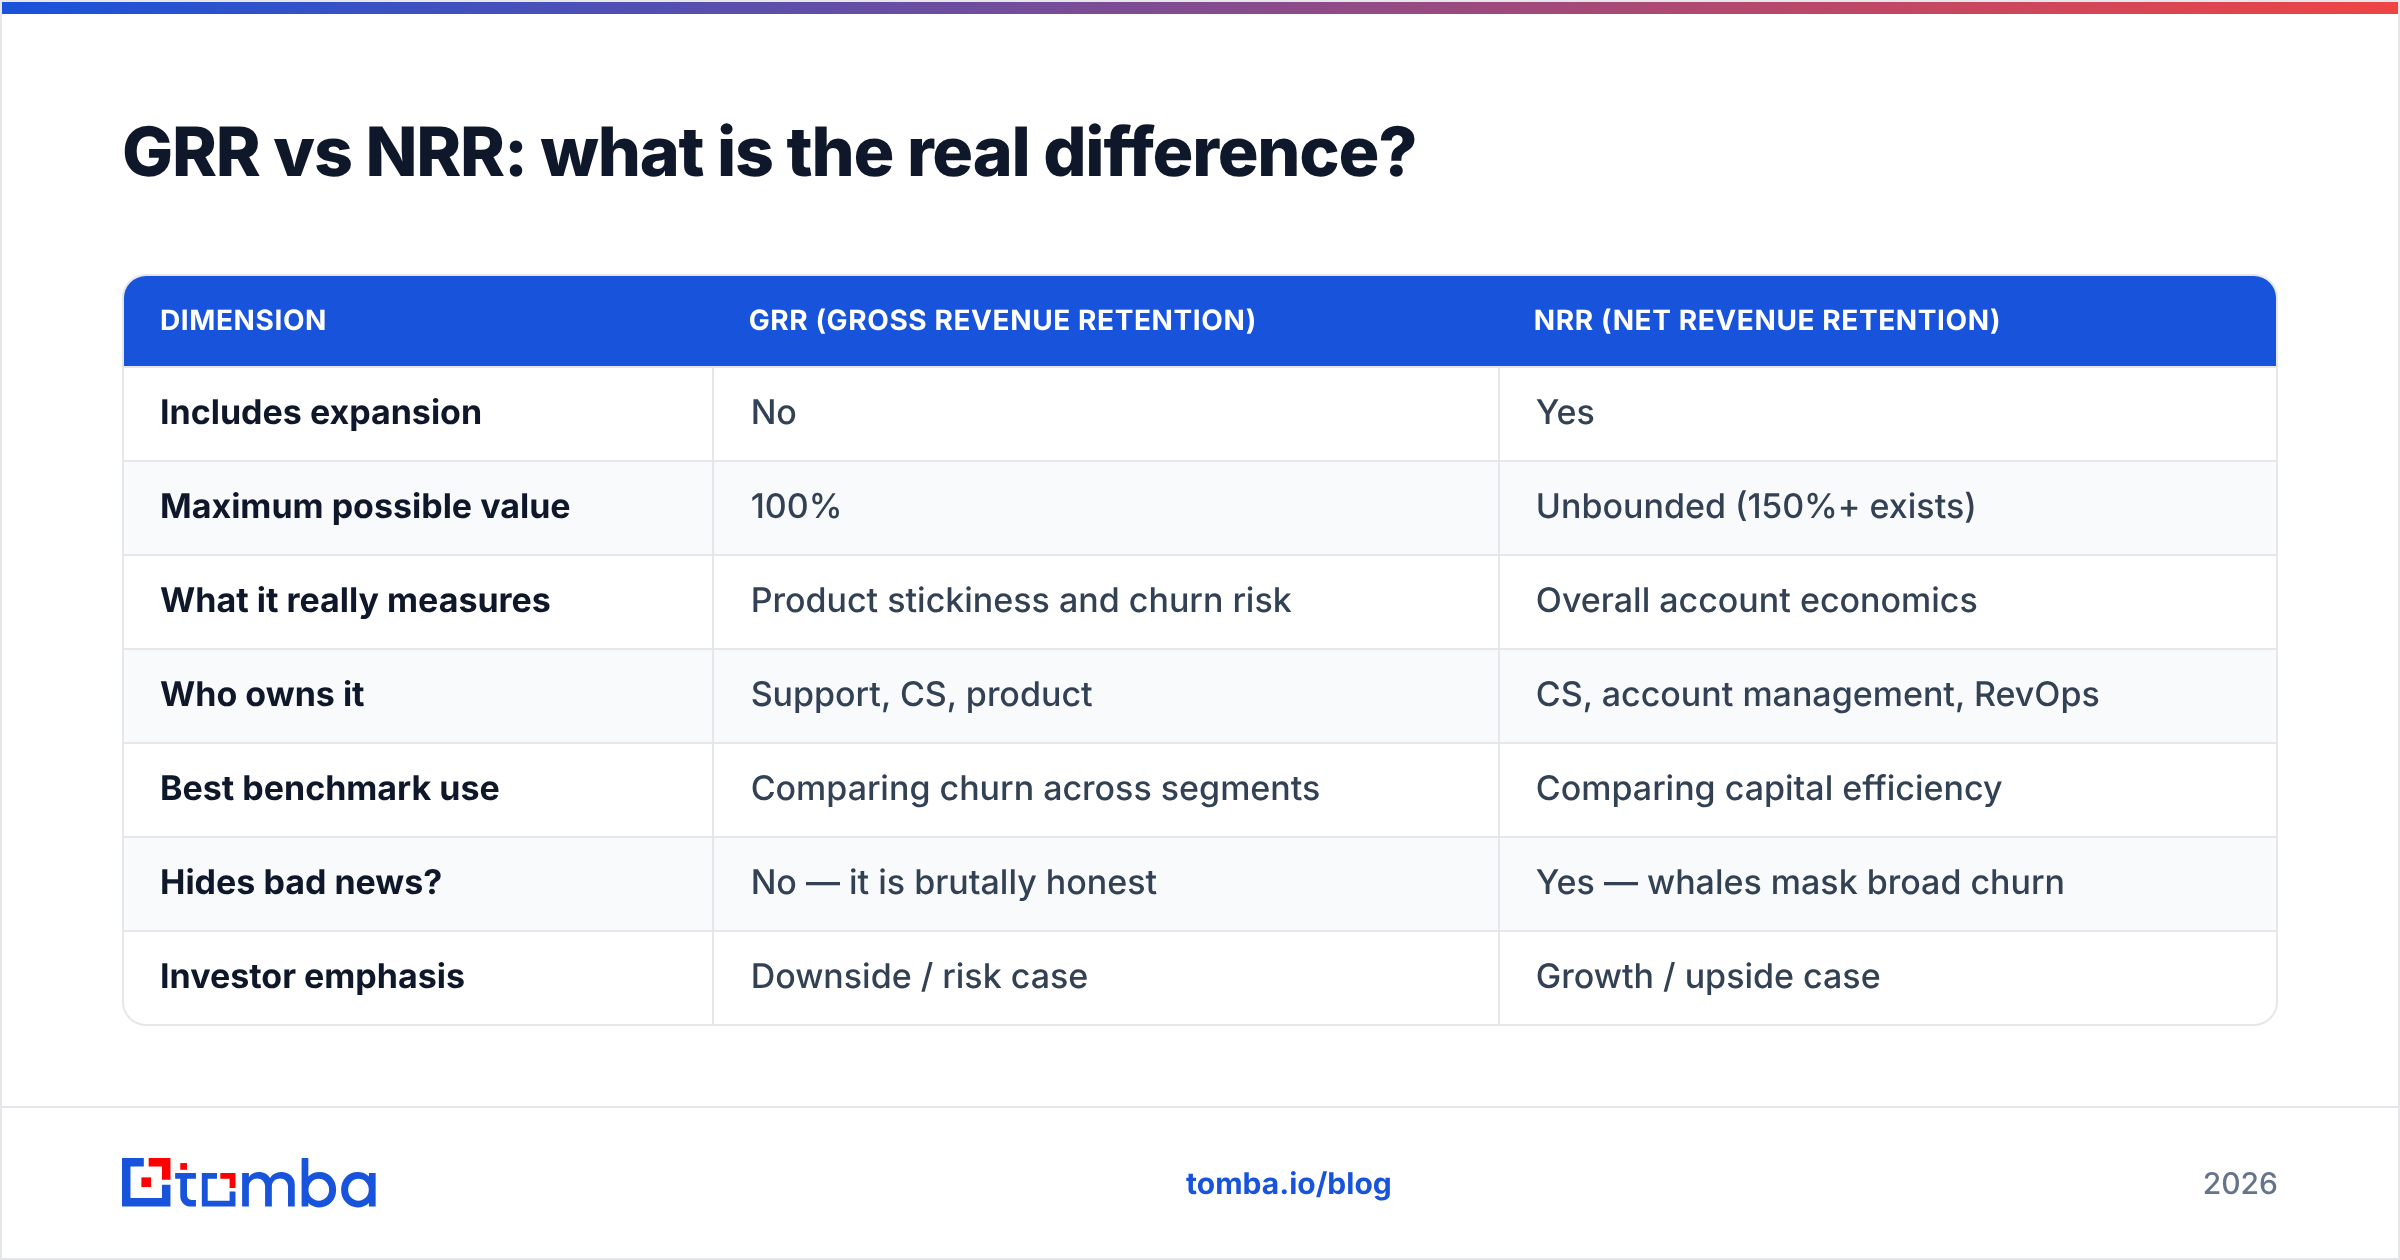
| Dimension | GRR (Gross Revenue Retention) | NRR (Net Revenue Retention) |
|---|---|---|
| Includes expansion | No | Yes |
| Maximum possible value | 100% | Unbounded (150%+ exists) |
| What it really measures | Product stickiness and churn risk | Overall account economics |
| Who owns it | Support, CS, product | CS, account management, RevOps |
| Best benchmark use | Comparing churn across segments | Comparing capital efficiency |
| Hides bad news? | No — it is brutally honest | Yes — whales mask broad churn |
| Investor emphasis | Downside / risk case | Growth / upside case |
| Typical good value (2026) | 85-92% | 110-120% |
The practical read: GRR is a defense metric, NRR is an offense metric. GRR asks "would these customers have stayed if we sold them nothing new?" NRR asks "did the installed base grow in dollars?"
Both matter, but they fail differently. A high GRR with flat NRR means you have a beloved product with no monetization ladder — no usage-based pricing, no second module, no seat expansion motion. A high NRR with low GRR means you have a concentration problem: a few accounts are carrying the number, and if one of them leaves, the whole story collapses in a single quarter.
What counts as a good GRR or NRR in 2026?#
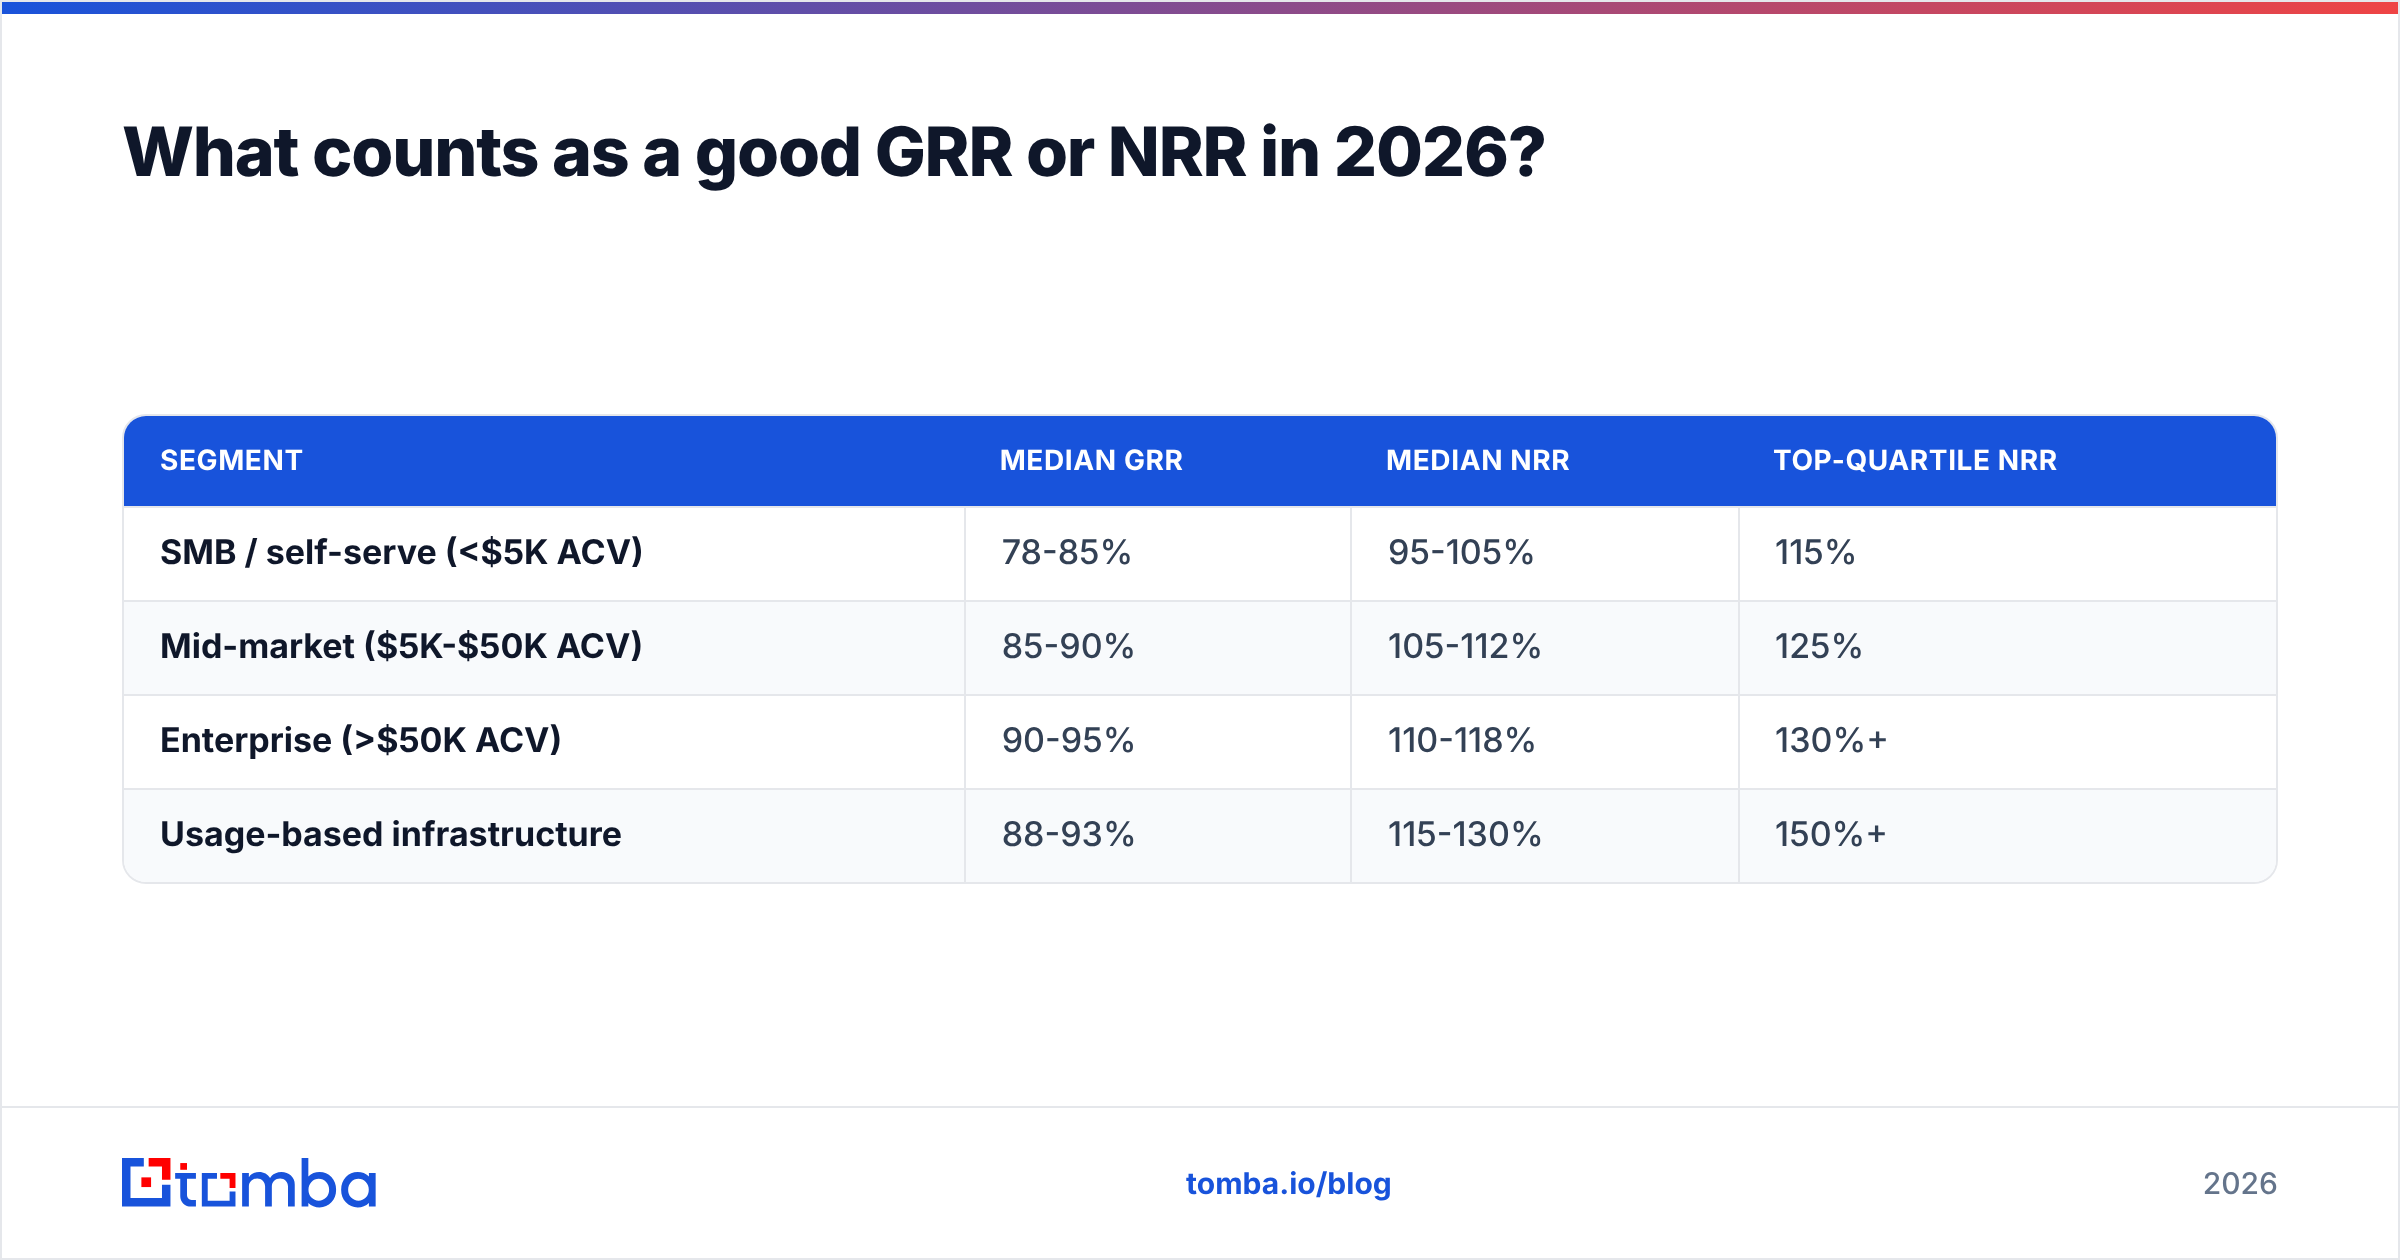
Benchmarks vary hugely by segment, and comparing a self-serve SMB tool to an enterprise platform is meaningless. Rough ranges from public SaaS filings and vendor benchmark reports:
| Segment | Median GRR | Median NRR | Top-quartile NRR |
|---|---|---|---|
| SMB / self-serve (<$5K ACV) | 78-85% | 95-105% | 115% |
| Mid-market ($5K-$50K ACV) | 85-90% | 105-112% | 125% |
| Enterprise (>$50K ACV) | 90-95% | 110-118% | 130%+ |
| Usage-based infrastructure | 88-93% | 115-130% | 150%+ |
Two caveats worth stating plainly.
First, usage-based pricing inflates NRR structurally. If your revenue scales with your customer's traffic, storage, or API volume, expansion happens automatically without a single conversation. That is a genuine advantage, but it makes cross-model NRR comparisons close to useless. Compare seat-based companies to seat-based companies.
Second, a downturn compresses NRR far faster than GRR. Expansion is discretionary; renewal is contractual. In 2022-2024, plenty of companies watched NRR fall from 125% to 105% while GRR barely moved. That is why lenders and later-stage investors increasingly underwrite on GRR — it is the metric that holds up when budgets tighten. Sites like G2 and category analyst coverage from Gartner now routinely surface retention data alongside feature comparisons, which means your churn is becoming a public-facing number whether you like it or not.
Why does NRR hide churn?#
Because it is a sum, and sums hide distributions.
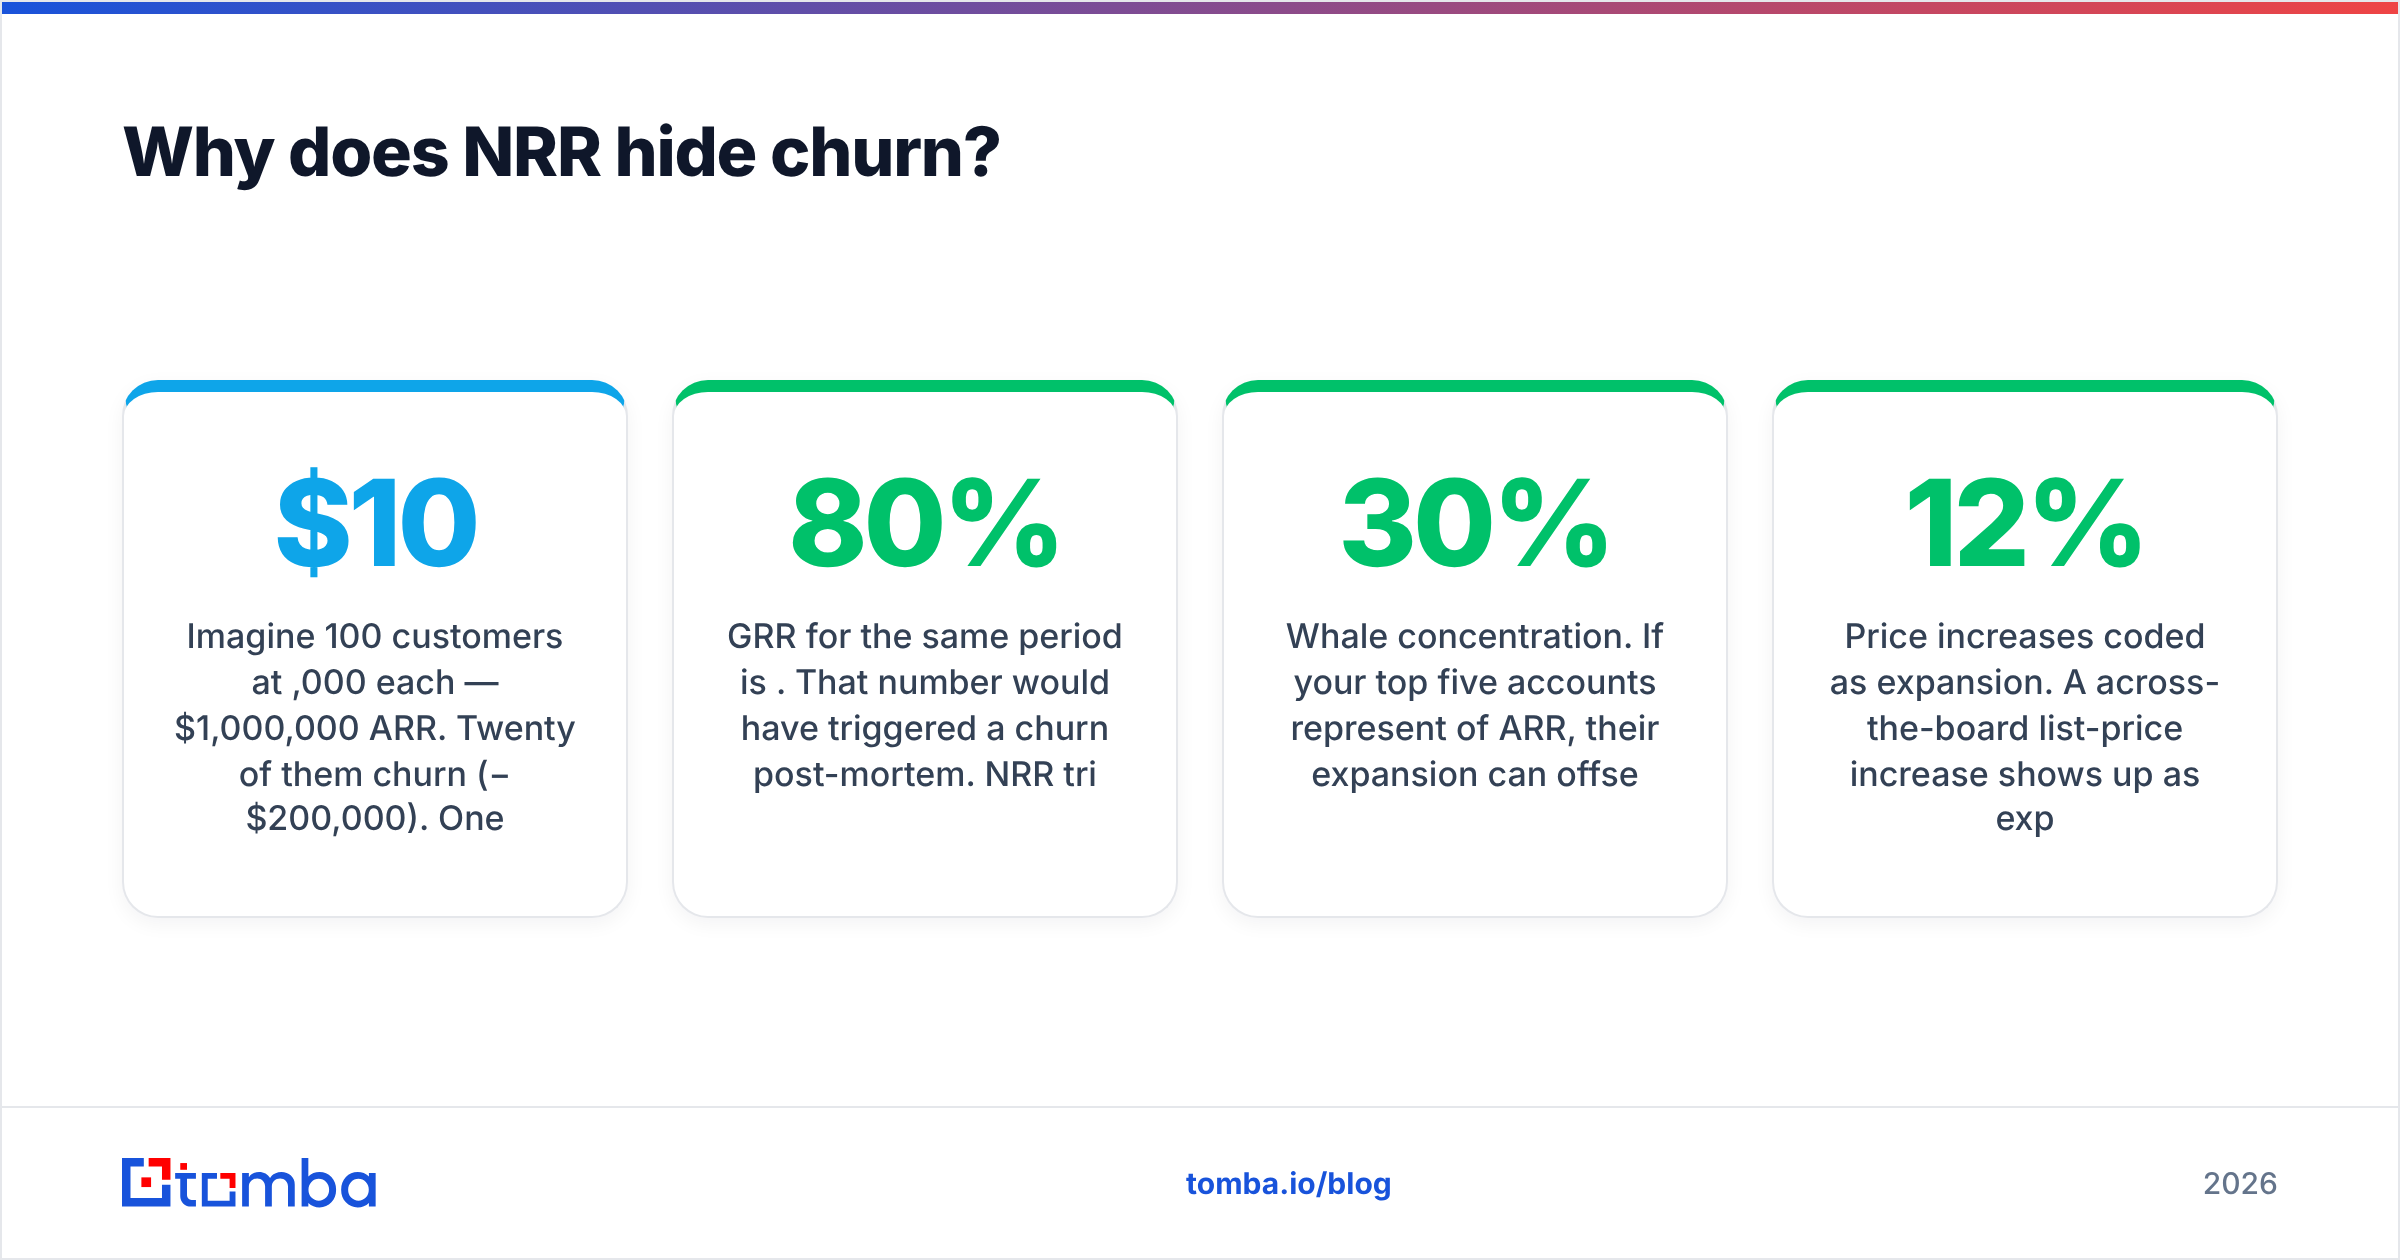
Imagine 100 customers at $10,000 each — $1,000,000 ARR. Twenty of them churn (−$200,000). One large account triples its contract (+$200,000). NRR = 100%. Clean. Boardroom-friendly. And you just lost a fifth of your customer base.
GRR for the same period is 80%. That number would have triggered a churn post-mortem. NRR triggered a celebration.
This is not hypothetical — it is the standard failure mode of any single-metric retention dashboard. Three specific traps:
- Whale concentration. If your top five accounts represent 30% of ARR, their expansion can offset a lot of small-logo bleeding. Always report NRR excluding your top 10 accounts as a sanity check.
- Price increases coded as expansion. A 12% across-the-board list-price increase shows up as expansion revenue. It inflates NRR without a single new seat sold, and it usually raises churn risk 6-12 months later.
- Cohort drift. If you recalculate the cohort every quarter instead of holding it fixed for 12 months, you quietly drop the customers most likely to churn out of the denominator.
The fix is boring and effective: publish GRR, NRR, and the gap between them in the same table, segmented by ACV band and by cohort year. Any exec who only wants the NRR line is asking to be misled.
Which metric should you report, and to whom?#
Different audiences need different framing. Reporting the same number to everyone is how RevOps loses credibility.
- Board and investors — both, always, with the gap called out. Lead with GRR if you are raising debt or in a tight market; lead with NRR if you are pitching a land-and-expand growth story and your GRR is genuinely above 90%.
- Product team — GRR by feature-adoption cohort. Product cannot influence upsell pricing, but it absolutely owns whether people stay.
- Customer success — GRR as the primary KPI, NRR as secondary. If you comp CS on NRR alone, they will optimize for the accounts easiest to expand and quietly let the small ones die.
- Sales leadership — NRR on the installed base, kept strictly separate from new-logo ARR. Blending them destroys the signal in both.
- Finance — GRR feeds the downside model and covenant math; NRR feeds the growth model. Use GRR for cash-flow floors.
If you want the definitions your team can share without arguing, keep the revenue operations and CRM glossary entries handy — half of every retention debate is really a disagreement about definitions, not about the data.
How do GRR and NRR change your GTM plan?#
This is where the metric stops being an accounting exercise and starts changing what your team does on Monday morning.
If GRR is the problem (below ~85% at mid-market ACV): stop investing in expansion plays. Every dollar spent on upsell motion while the drain is open is wasted. Audit churned accounts for a shared cause — bad-fit ICP, missing integration, single-champion dependency, onboarding drop-off. In practice, the most common root cause is not product quality. It is that you sold to the wrong companies. Fixing that is a targeting problem, which means it lives upstream in prospecting and data quality, not in customer success.
If NRR is the problem (GRR strong, NRR under 100%): you have a monetization ladder problem. Customers like the product and there is nothing else to buy. Options: usage-based components, a second product line, tiered seat pricing, or a services attach. Also check whether your CS team even has expansion targets and the contact data to reach new buyers inside existing accounts — most expansion stalls because nobody knows who runs the adjacent department.
That second point deserves emphasis. Expansion revenue almost always requires reaching a new person at an existing customer: a different department head, a new VP after a reorg, a champion who moved teams. If your CRM only holds the original buyer's email, your expansion motion is blind. Running data enrichment across your installed base — refreshing job titles, catching role changes, mapping org charts — is the cheapest NRR lever most teams never pull. A domain search across a customer's domain will often surface five relevant contacts where your CRM has one.
The same logic applies in reverse for churn prevention. When your champion leaves a customer's company, that account's renewal probability drops sharply. Catching the change early — via reverse email lookup on bounced contacts or periodic verification of your account contacts — buys you a quarter of lead time to build a second relationship.
What breaks GRR and NRR calculations?#
Five mistakes that show up in almost every first attempt:
- Mixing MRR and ARR mid-calculation. Pick one unit and stay in it for the whole period. Annualizing monthly numbers mid-stream produces phantom expansion.
- Including new logos. The most common error. New business belongs in growth metrics, never in retention metrics.
- Counting non-recurring revenue. Implementation fees, professional services, and one-off training are not recurring. Strip them out or you will see expansion that never repeats.
- Ignoring currency effects. For multi-currency books, FX swings can move reported NRR by several points. Report constant-currency retention alongside actuals.
- Inconsistent cohort windows. A trailing-twelve-month cohort and a fiscal-year cohort produce different numbers from identical data. Document which you use and never switch quietly.
For a broader primer on how churn is defined across industries, Wikipedia's churn rate entry is a decent neutral starting point, and HubSpot publishes practical retention playbooks that translate the math into CS workflows.
So which one wins?#
Neither. That framing is the trap.
If you are forced to pick one number for a single slide: report NRR, but only if GRR is above 90%. Below that, NRR is a vanity metric and any sophisticated reader will ask for GRR within thirty seconds anyway. Better to lead with the honest number and the plan to fix it.
The practical stance most good RevOps teams land on: GRR is the health metric, NRR is the performance metric. Health first. You cannot performance-manage your way out of a product that customers leave.
Get the contact data your retention math depends on#
Both metrics collapse if you cannot reach the people inside your accounts. Expansion needs new buyers; churn prevention needs a second champion before the first one leaves.
Tomba's Email Finder finds verified professional email addresses by name and company domain, so you can map every relevant stakeholder inside an existing customer instead of relying on a single stale CRM record. Start on the free tier with 25 searches a month, or move to the $49/mo Starter plan once you are enriching your whole installed base — full Tomba pricing is public, with Growth at $99/mo and Pro at $249/mo. Fix the data layer first; the retention metrics follow.
Related guides#
Ready to find emails that actually work?
Join 150,000+ professionals who stopped guessing and started sending. Free credits on signup — no credit card required.
Get the Tomba newsletter
Practical outbound tactics and product updates — once every two weeks.
About the author