GTM Efficiency in 2026: Metrics, Benchmarks, and Fixes
Most GTM efficiency programs cut the wrong line items and wonder why pipeline collapses two quarters later. Here are the metrics, benchmarks, and stack decisions that actually raise output per dollar.
TL;DR
- GTM efficiency is output per dollar of go-to-market spend — not cost-cutting. You can raise it by increasing revenue at flat cost, and that path usually beats layoffs.
- The four numbers that matter: CAC payback, net revenue retention, magic number, and pipeline per rep hour. Everything else is a diagnostic, not a target.
- Bad contact data is the most under-priced efficiency leak in B2B. A 25% bounce rate does not just waste sends; it burns domain reputation, rep hours, and sequence slots simultaneously.
- Tool consolidation returns less than people expect (usually 5–12% of GTM spend). Data quality and routing discipline return more, faster.
- Run efficiency work as a 90-day sprint with one owner, three metrics, and a kill list — not as a permanent committee.
What is GTM efficiency, actually?#
GTM efficiency is the ratio between the revenue your go-to-market motion produces and everything you spend to produce it: salaries, commissions, ads, tools, data, events, and the fully loaded cost of the people who support all of it.
Think of it like fuel economy in a truck. Miles per gallon does not improve because you removed the passenger seat. It improves because you fixed the tire pressure, stopped idling, and quit driving three routes to the same destination. Most "efficiency initiatives" are seat removal. The wins are in idling and duplicate routes.
The formal version most boards use:
GTM efficiency ratio = Net new ARR ÷ Total GTM spend in the same period
A ratio of 1.0 means you spent a dollar of sales and marketing to add a dollar of new recurring revenue. Below 0.5, you are buying growth at a price the market no longer rewards. Above 1.0 with healthy retention, you have earned the right to spend more.
Two clarifications that save a lot of arguing:
- Efficiency is not austerity. Cutting $2M of spend that was producing $3M of ARR makes your ratio worse, not better.
- Efficiency is a system property. No single team owns it. That is why it lives with revenue operations rather than with sales or marketing alone.

Which GTM efficiency metrics actually matter in 2026?#
You need four. More than that and nobody in the room can hold the model in their head.
- CAC payback period. Months of gross-margin-adjusted revenue needed to recover the fully loaded cost of acquiring a customer. This is the single best proxy for whether growth is self-funding. Formula:
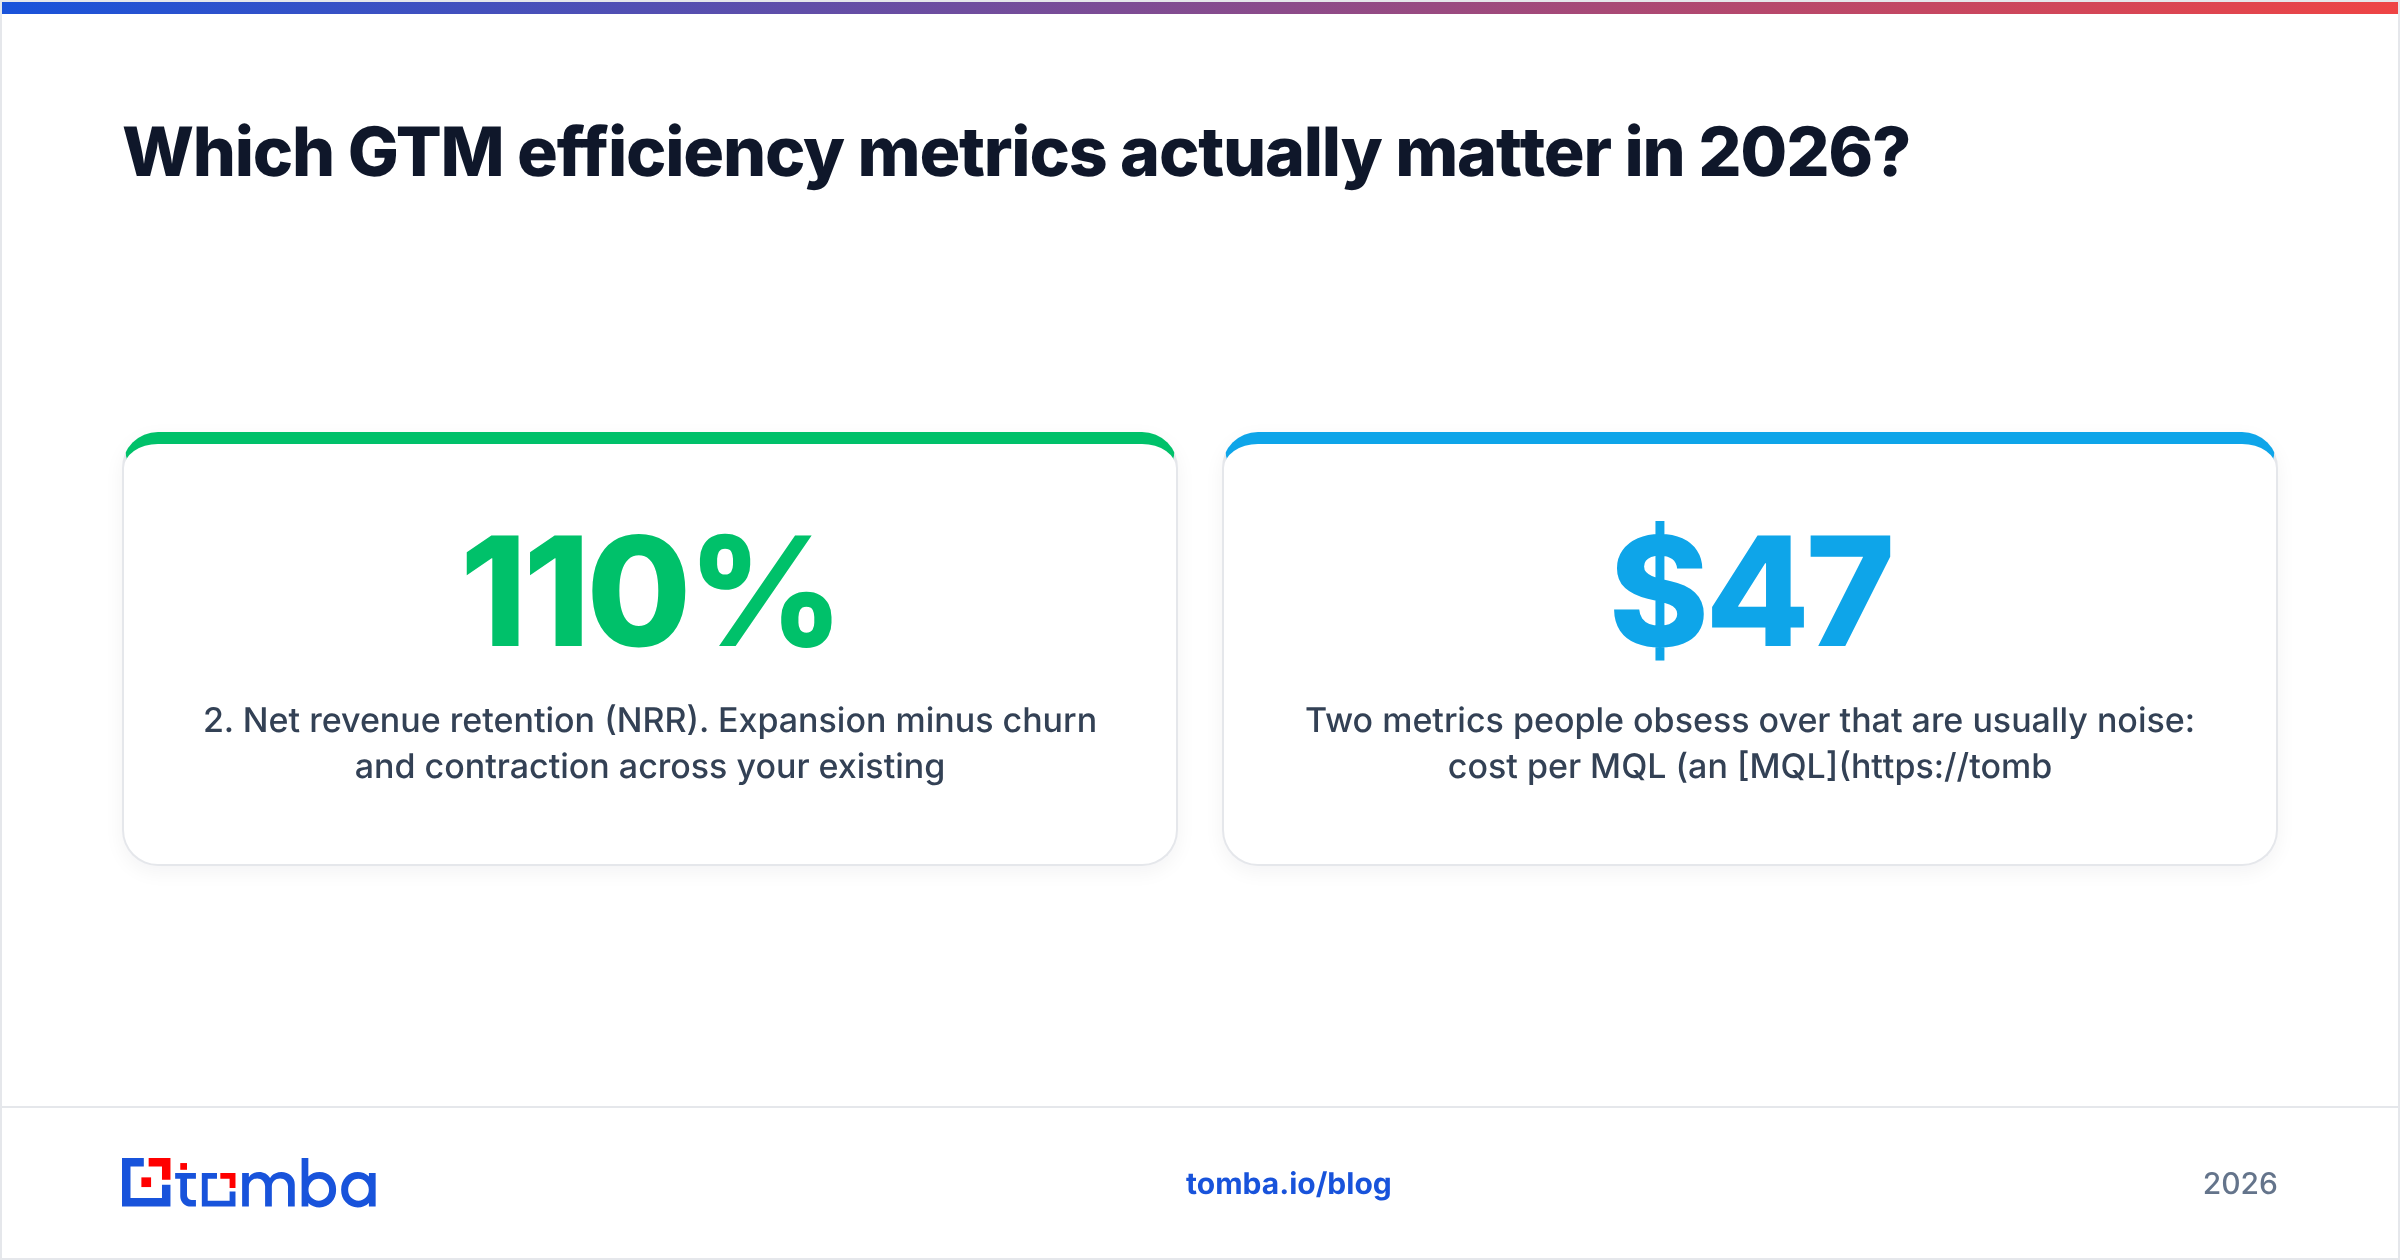
(S&M spend in period ÷ new customers) ÷ (ARPA × gross margin) × 12. - Net revenue retention (NRR). Expansion minus churn and contraction across your existing base. NRR above 110% means part of next year's growth is already paid for. NRR below 95% means every efficiency gain in acquisition gets eaten by the back door.
- Magic number. Net new ARR in a quarter divided by prior-quarter sales and marketing spend. Crude, but it answers "should we add spend or fix conversion?" in one number.
- Pipeline per rep hour. How much qualified pipeline a rep generates per hour of selling time. This is the metric that exposes data and tooling problems, because it collapses when reps spend their days researching contacts instead of talking to them.
Two metrics people obsess over that are usually noise: cost per MQL (an MQL that never converts costs infinity, not $47) and tool count. Tool count is a symptom, not a lever.
What do good GTM efficiency benchmarks look like?#
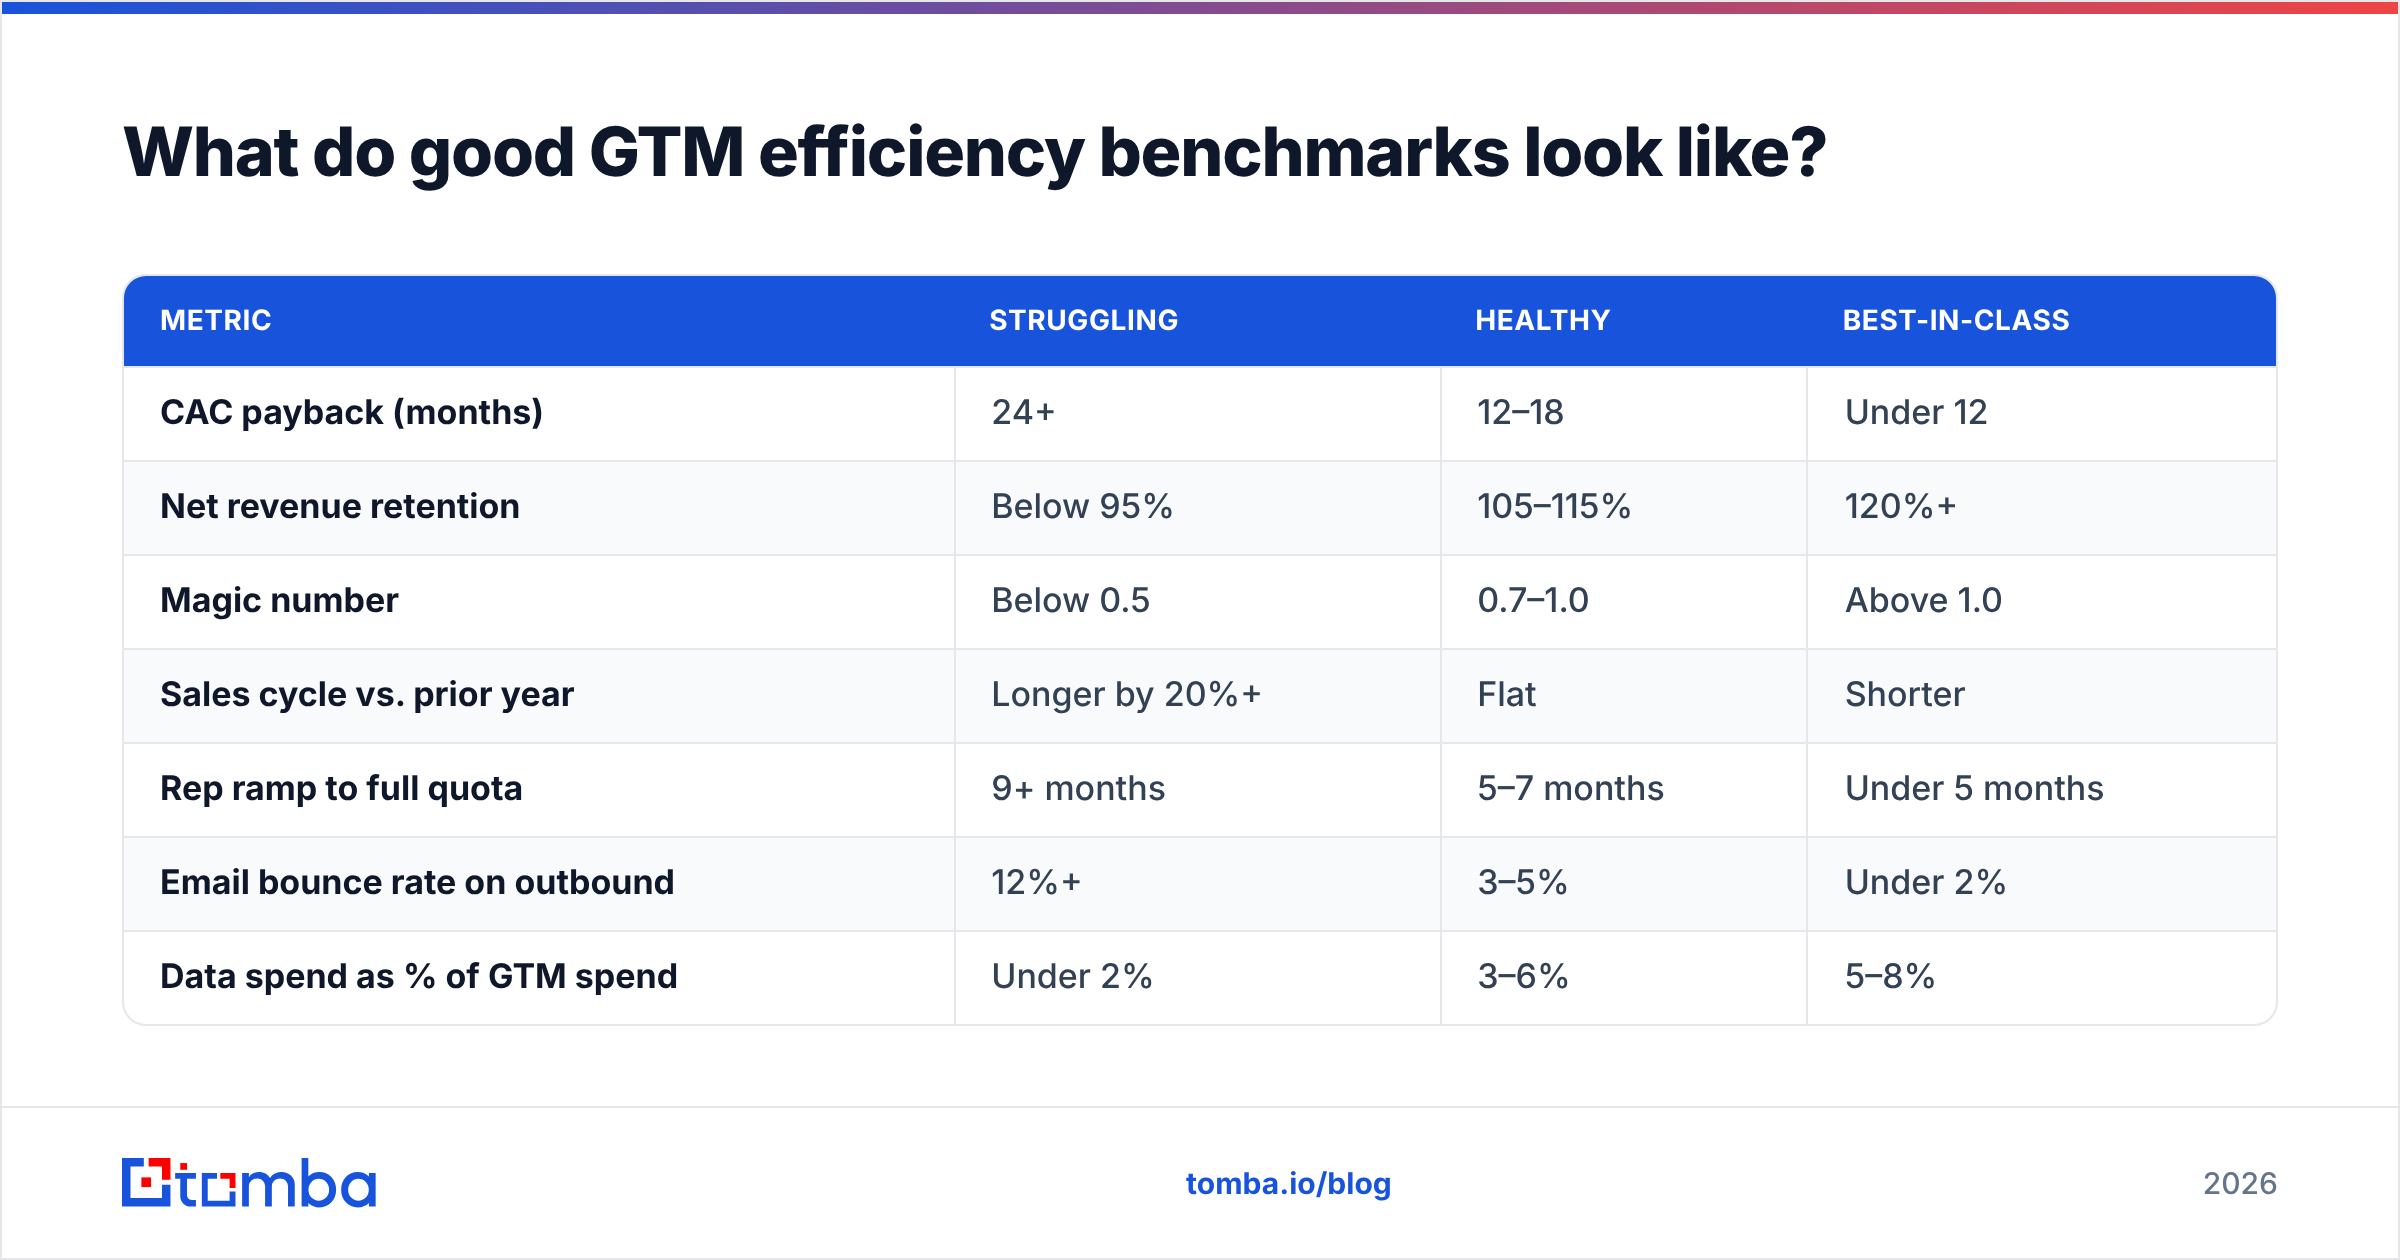
Benchmarks are context-dependent — a $30K ACV mid-market motion and a $400K enterprise motion should not share targets. Use these as bands, not verdicts. Public benchmark sets from Gartner's sales research and community data from G2 are worth cross-checking against your own segment before you commit to a number in a board deck.
| Metric | Struggling | Healthy | Best-in-class |
|---|---|---|---|
| CAC payback (months) | 24+ | 12–18 | Under 12 |
| Net revenue retention | Below 95% | 105–115% | 120%+ |
| Magic number | Below 0.5 | 0.7–1.0 | Above 1.0 |
| Sales cycle vs. prior year | Longer by 20%+ | Flat | Shorter |
| Rep ramp to full quota | 9+ months | 5–7 months | Under 5 months |
| Email bounce rate on outbound | 12%+ | 3–5% | Under 2% |
| Data spend as % of GTM spend | Under 2% | 3–6% | 5–8% |
That last row surprises people. Teams with the best efficiency numbers usually spend more of their GTM budget on data, not less — because accurate contact data is what keeps the expensive resource (rep time) productive.
Why does bad data quietly destroy GTM efficiency?#
Because it taxes every downstream step, and the tax is invisible on any single line item.
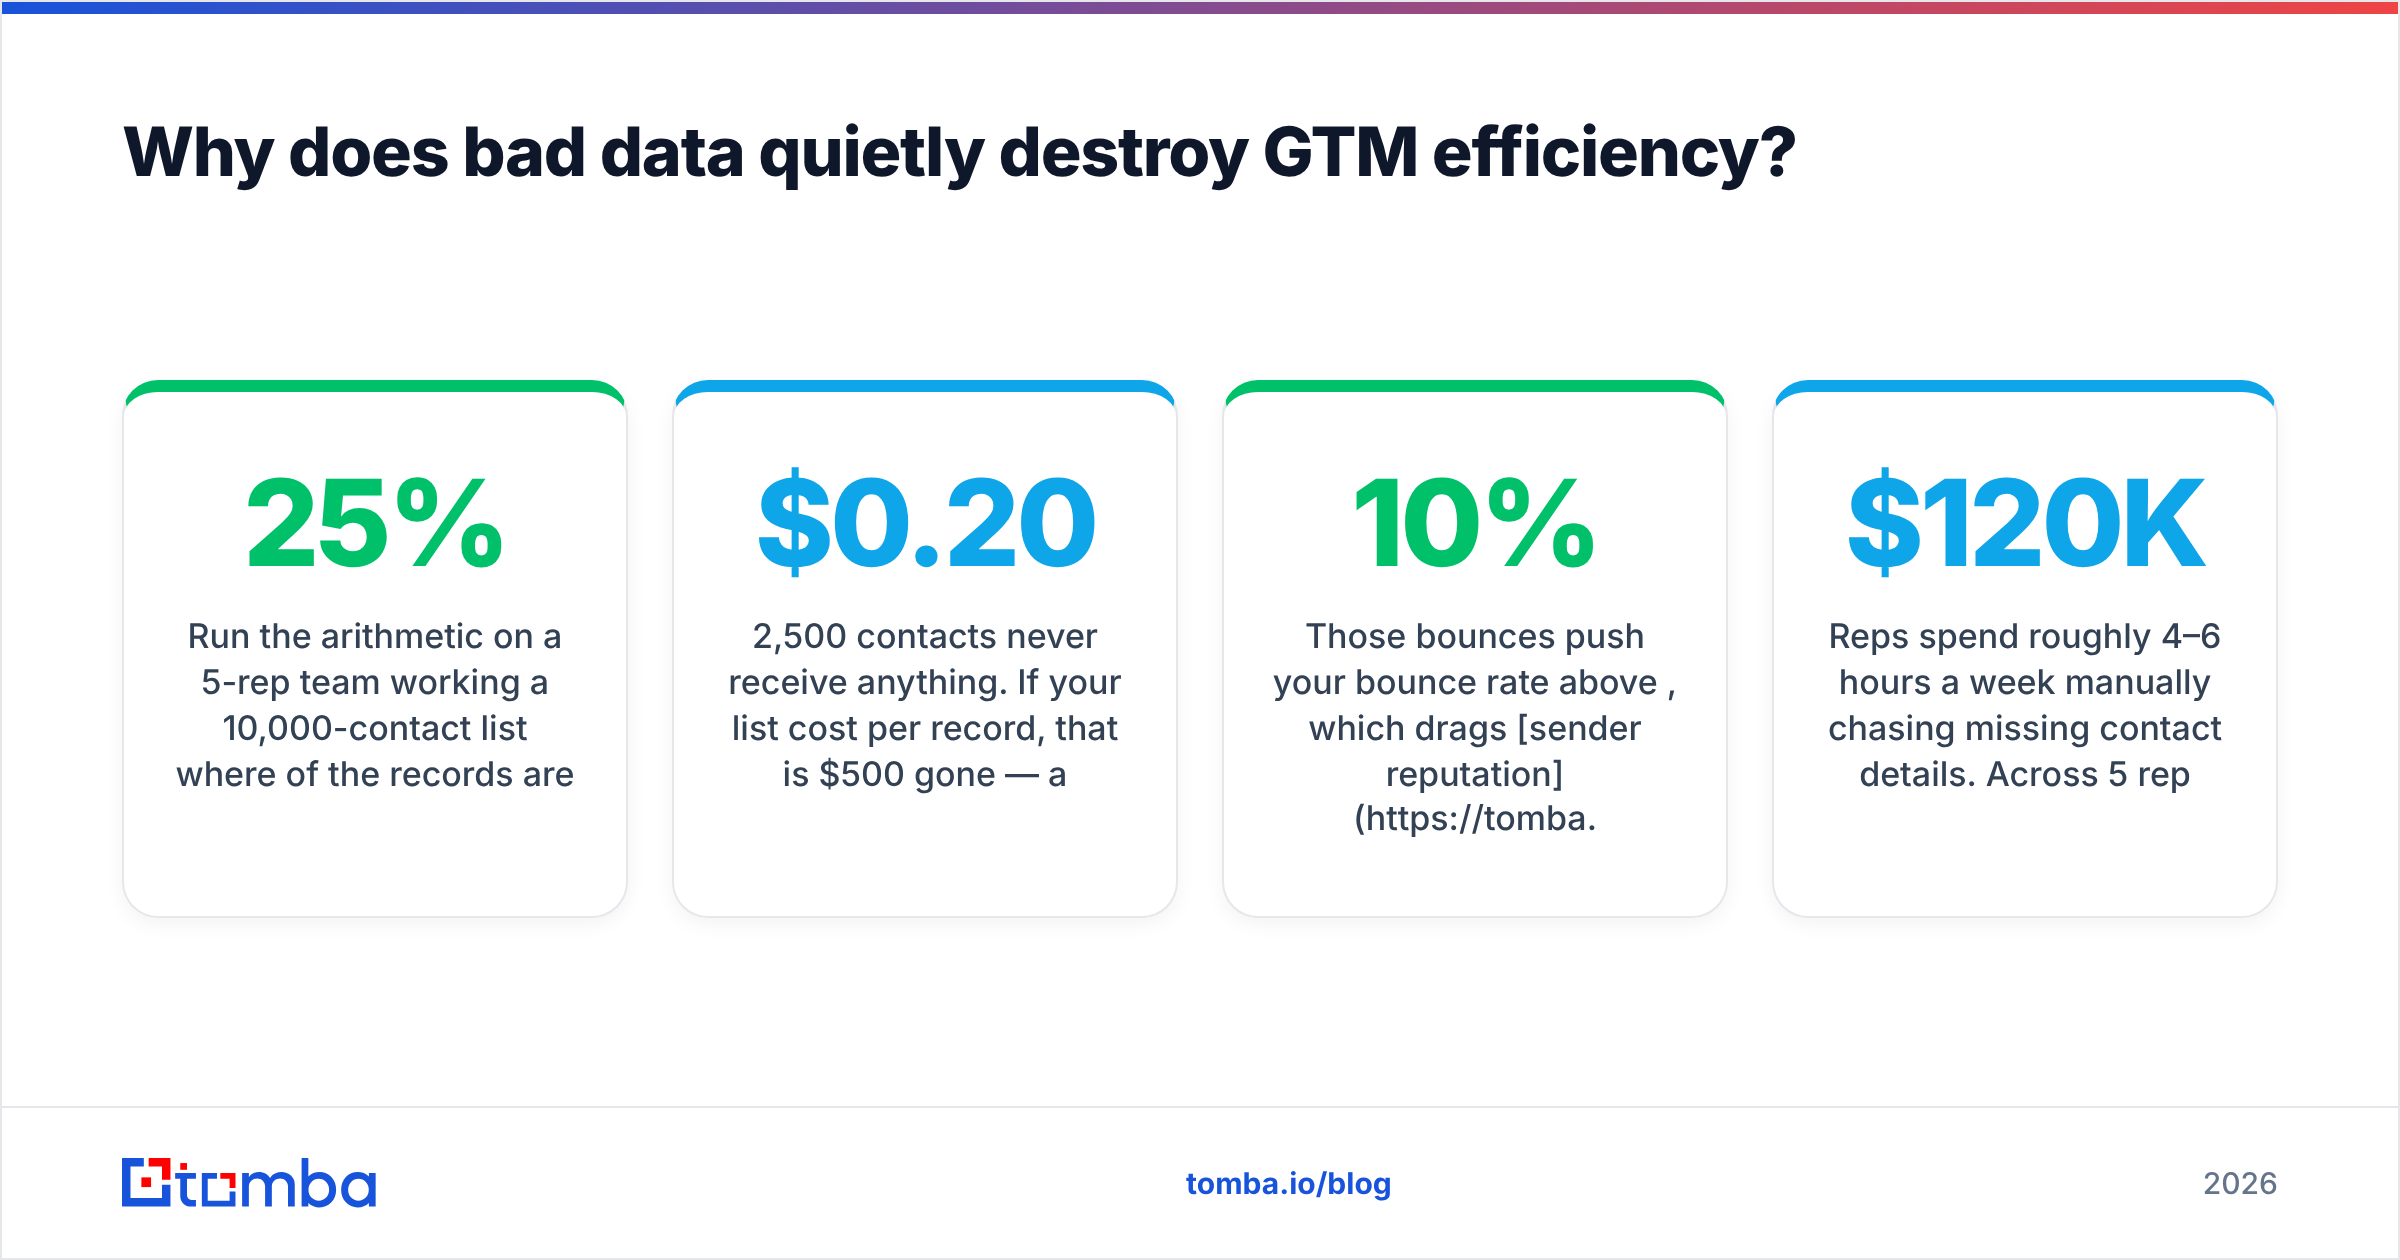
Run the arithmetic on a 5-rep team working a 10,000-contact list where 25% of the records are wrong:
- 2,500 contacts never receive anything. If your list cost $0.20 per record, that is $500 gone — annoying, not fatal.
- Those bounces push your bounce rate above 10%, which drags sender reputation down and reduces inbox placement for the 7,500 good contacts. Now you are losing replies from contacts you paid for and verified.
- Reps spend roughly 4–6 hours a week manually chasing missing contact details. Across 5 reps at a loaded cost of $120K, that is around $70K of annual selling time redirected into clerical work.
- Your conversion math is corrupted. You cannot tell whether the sequence underperformed or the list did, so you rewrite copy that was never the problem.
The $500 line item is the only part that shows up in a spend review. The other $70K+ shows up as "we need more reps."
This is why verification belongs before the send, not after. Running a list through an email verifier and handling catch-all domains separately with a catch-all verifier costs a fraction of a cent per record and protects the two assets you cannot buy back quickly: domain reputation and rep hours.
How do the main efficiency levers compare?#
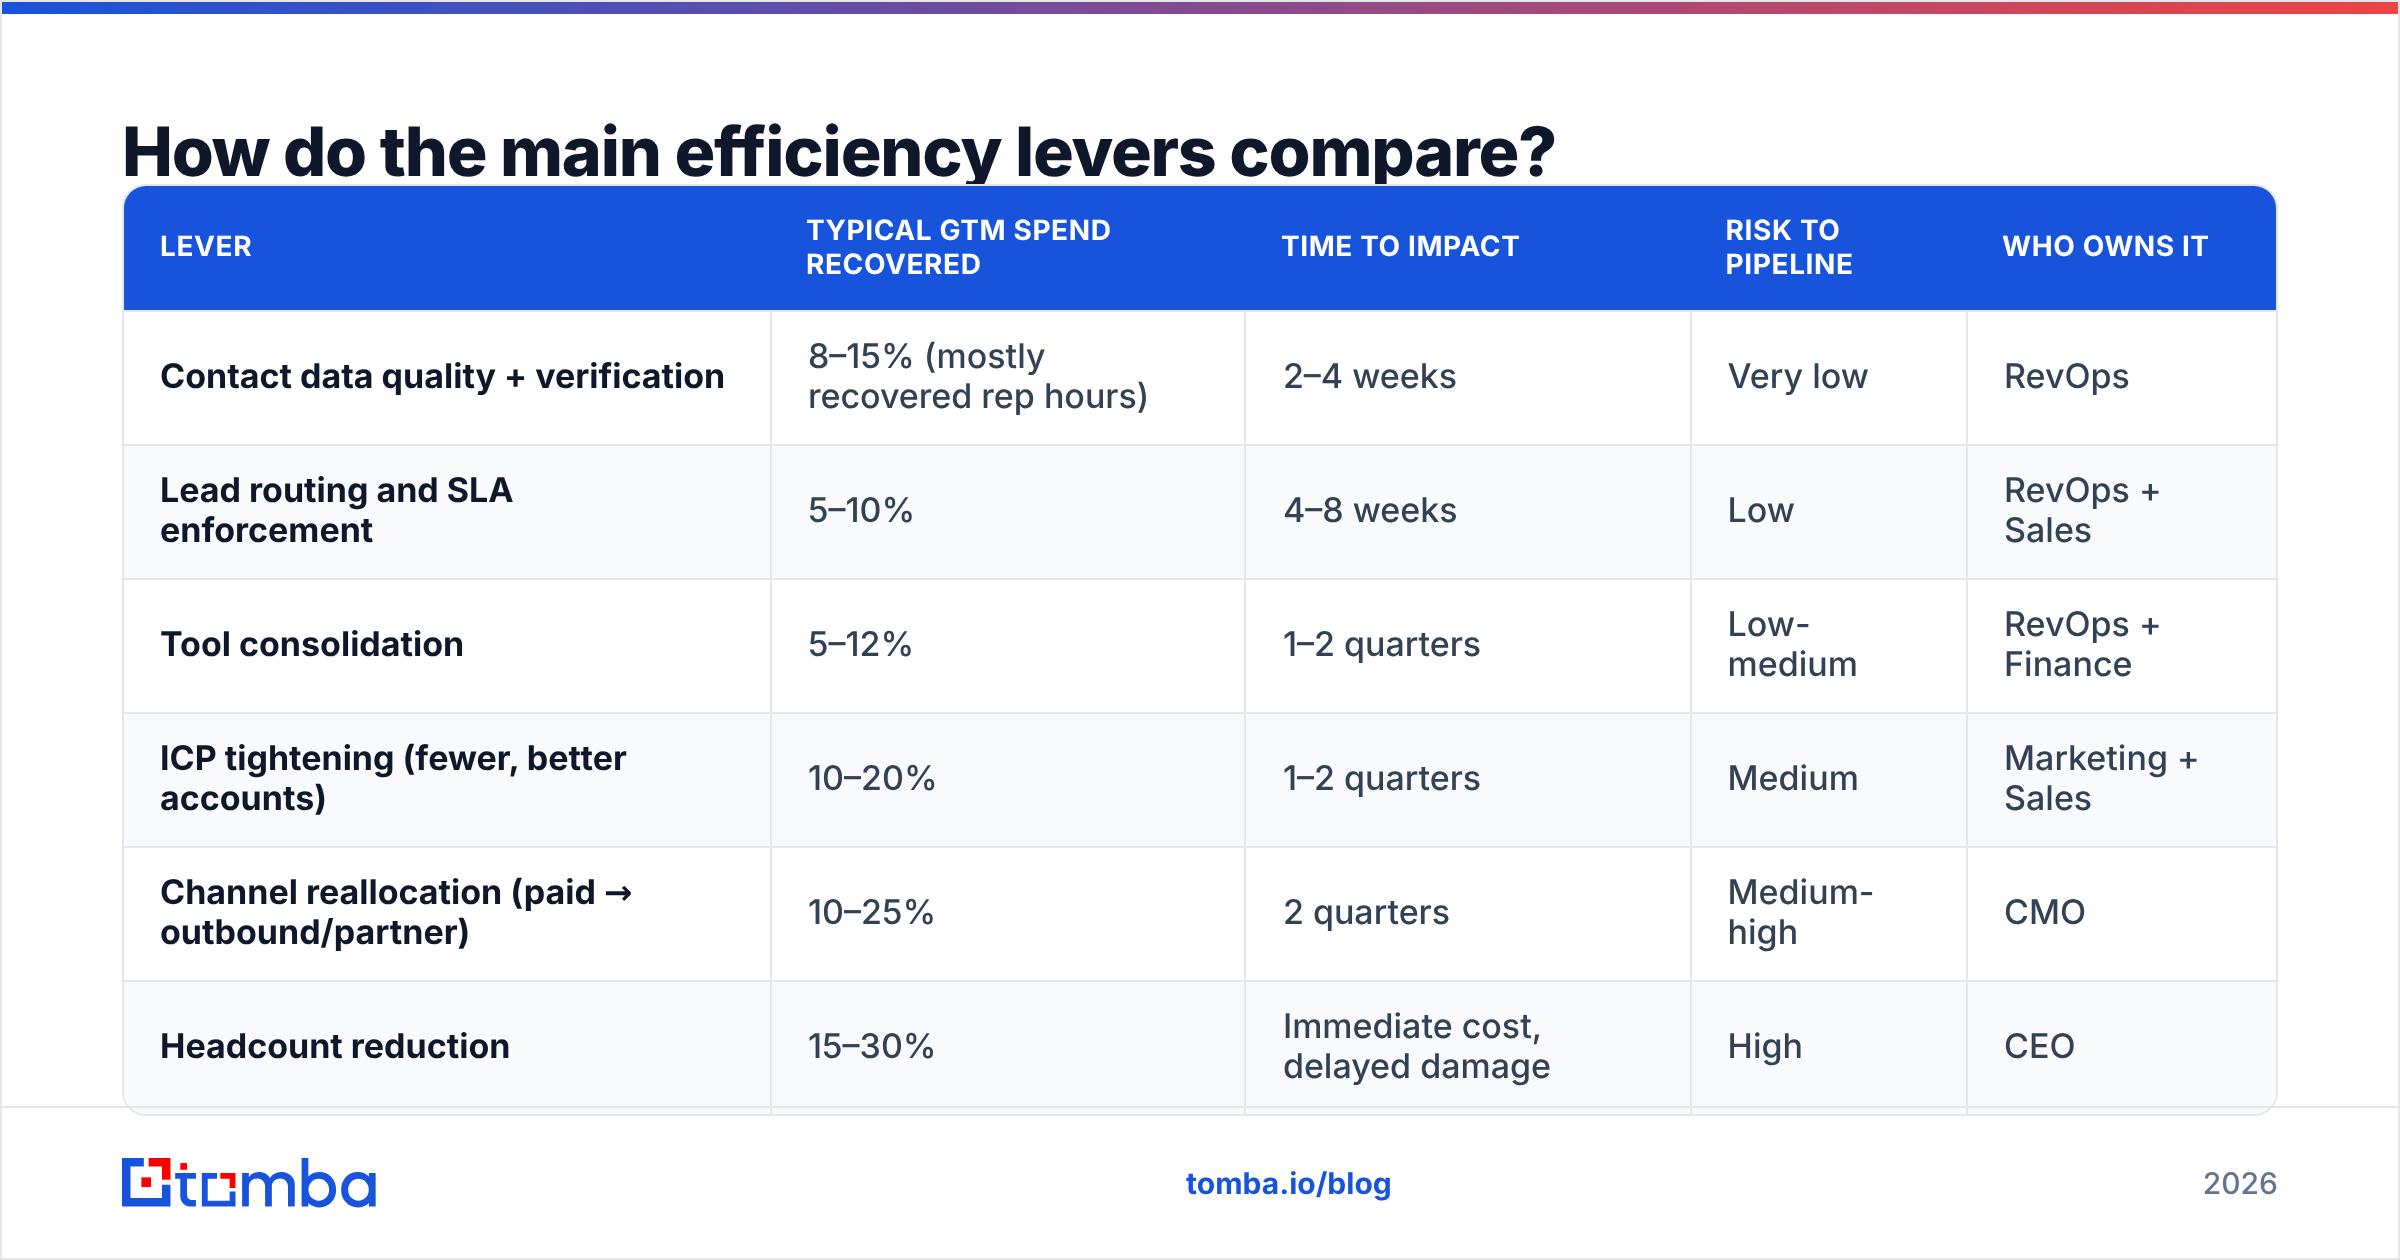
Not all levers pay back on the same timeline or with the same risk. Here is the honest comparison, ranked by what most B2B teams actually recover.
| Lever | Typical GTM spend recovered | Time to impact | Risk to pipeline | Who owns it |
|---|---|---|---|---|
| Contact data quality + verification | 8–15% (mostly recovered rep hours) | 2–4 weeks | Very low | RevOps |
| Lead routing and SLA enforcement | 5–10% | 4–8 weeks | Low | RevOps + Sales |
| Tool consolidation | 5–12% | 1–2 quarters | Low-medium | RevOps + Finance |
| ICP tightening (fewer, better accounts) | 10–20% | 1–2 quarters | Medium | Marketing + Sales |
| Channel reallocation (paid → outbound/partner) | 10–25% | 2 quarters | Medium-high | CMO |
| Headcount reduction | 15–30% | Immediate cost, delayed damage | High | CEO |
Read the risk column before the savings column. Headcount cuts look best on a spreadsheet and worst two quarters later, because you removed capacity you will re-hire at full ramp cost. Data and routing fixes are boring, cheap, and reversible — which is exactly why they should come first.

What does an efficient GTM stack look like?#
The efficient stack is not the smallest stack. It is the one where every tool has a named owner, a measurable job, and no overlap with the tool next to it.
- One system of record. Your CRM holds the truth. Anything that disagrees with it is a report, not a source. Teams that run two "sources of truth" spend 15–20% of RevOps time reconciling them.
- One enrichment layer, not four. Most teams accumulate three or four overlapping data vendors because each was bought by a different team for one missing field. Consolidate to a primary provider with waterfall fallback rather than four half-used seats. Contact enrichment that writes back into the CRM automatically removes the biggest recurring manual task in the stack.
- One sequencing tool. Two sequencers means two sets of unsubscribe records, two reputation profiles, and eventually one compliance incident.
- Verification in the pipeline, not as a cleanup job. Verify on ingest. A quarterly cleanup project is a confession that your intake is broken.
- API-first over seat-first where volume is predictable. If you enrich 20,000 records a month on a schedule, an email finder API call inside your workflow costs less and breaks less than five people doing lookups in a browser tab.
- A documented kill criterion per tool. Written at purchase: "if X doesn't move by Q3, we cancel." Without it, every renewal becomes a negotiation about sunk cost.
For a reference point on how mature GTM teams structure their operating cadence around this stack, HubSpot's research library publishes annual state-of-sales data that is useful for sanity-checking your own conversion assumptions against market medians.
Is headcount or tooling the bigger efficiency lever?#
Neither — the bigger lever is capacity utilization, and it usually sits between the two.
Most sales teams operate at 30–40% selling time. The other 60–70% goes to research, data entry, internal meetings, and CRM hygiene. If you move selling time from 35% to 45%, you have added roughly 28% more selling capacity without hiring anyone or buying a new platform.
The order of operations that works:
- Measure selling time for two weeks. Calendar audit plus CRM activity logs. Do not guess.
- Find the top three non-selling time sinks. In nearly every audit, contact research is one of them.
- Automate or eliminate those three. Not all twelve. Three.
- Re-measure. If selling time did not move, the automation failed — revert it, do not layer another tool on top.
- Only then decide on headcount. With accurate capacity numbers, hiring becomes a math problem instead of a vibe.
Step 3 is where a bulk email finder earns its keep: a rep who uploads a list of 300 target accounts and gets verified contacts back in minutes has just reclaimed a full day per month that used to go into LinkedIn tabs and guessed email patterns.
How do you run a 90-day GTM efficiency sprint?#
Committees produce documents. Sprints produce numbers. Structure it like this:
Days 1–15 — Instrument. Pick your four metrics. Build one dashboard. Get finance to agree on what counts as GTM spend before you report anything, or you will spend the whole quarter arguing about denominators.
Days 16–30 — Audit. Three audits, in parallel: data quality (bounce rate, field completeness, duplicate rate), tool utilization (seats assigned vs. seats active in the last 30 days), and time allocation (the selling-time study above).
Days 31–60 — Fix the cheap things. Verification on ingest. Deduplication. Cancel every tool with under 40% seat utilization and no kill-criterion defense. Fix routing SLAs. None of these require a strategy offsite.
Days 61–90 — Reallocate. Move the recovered budget and hours into the channel with the best marginal return, and document what you moved and why. Then re-run the four metrics and compare against day 15.
Two rules that keep the sprint honest: one owner (usually the RevOps lead, reporting to the CRO), and a hard stop. If it runs past 90 days it has become a permanent bureaucracy, which is itself an efficiency problem.
What are the most common GTM efficiency mistakes?#
- Cutting the tools reps actually use. Seat utilization data exists. Use it instead of intuition.
- Optimizing top-of-funnel volume when the leak is in stage 3. Fix conversion where the drop is steepest, not where the dashboard is prettiest.
- Treating data as a one-time purchase. B2B contact data decays roughly 2–3% per month as people change jobs. A list bought in January is meaningfully wrong by June.
- Measuring efficiency quarterly and reporting it annually. By the time an annual review flags a problem, you have funded it for four quarters.
- Confusing activity with output. More sequences sent is not more pipeline. Pipeline per rep hour is the check on this.
- Ignoring retention. A 5-point NRR improvement is usually cheaper than a 5-point CAC improvement, and it compounds.
Where should you start this week?#
Start with the audit that costs the least and exposes the most: take your current outbound list, verify it, and calculate what percentage was wrong. That single number tells you how much of your sequencing budget, rep time, and domain reputation you have been spending on contacts who do not exist.
If the answer is above 10%, you do not have a messaging problem or a headcount problem. You have a data problem wearing a messaging problem's costume.
The Tomba Email Finder is built for exactly that first fix — verified professional emails by name, domain, or company, with verification built into the lookup rather than bolted on afterward. The free tier gives you 25 searches a month to run the audit before you commit to anything, and paid plans start at $49/mo with bulk processing, API access, and CRM write-back included as you scale. See Tomba pricing for how the tiers map to list volume.
Fix the data, measure the selling time you get back, then decide what else your GTM engine actually needs.
Related guides#
Ready to find emails that actually work?
Join 150,000+ professionals who stopped guessing and started sending. Free credits on signup — no credit card required.
Get the Tomba newsletter
Practical outbound tactics and product updates — once every two weeks.
About the author