Historical Forecasting in Sales: How to Use Past Data in 2026
Historical forecasting turns last year's closed-won data into next quarter's number. Here's the math, the accuracy you can expect, and the four conditions that quietly break it.
TL;DR
- Historical forecasting predicts future revenue by extrapolating from what actually closed in prior periods — not from what reps say will close.
- It is the cheapest accurate method for teams with 12+ months of clean CRM history and a stable motion. Median error in mature teams lands around 8-15%, versus 25-40% for gut-feel rep commits.
- It breaks in exactly four situations: you changed pricing, you changed segment, your data hygiene is bad, or your sample is too small (fewer than ~30 closed deals per period).
- The best setups blend it: historical baseline for the floor, weighted pipeline for the upside, rep commit for the last two weeks of the quarter.
- Garbage contact data corrupts the inputs before the math ever runs. Bounced sends and dead records inflate your top-of-funnel counts and deflate every conversion rate downstream.
What is historical forecasting?#
Historical forecasting is a revenue prediction method that uses your own past performance as the primary input. You take what closed in prior periods, adjust for known growth and seasonality, and project that forward. No rep opinions, no deal-by-deal judgment calls — just observed outcomes.
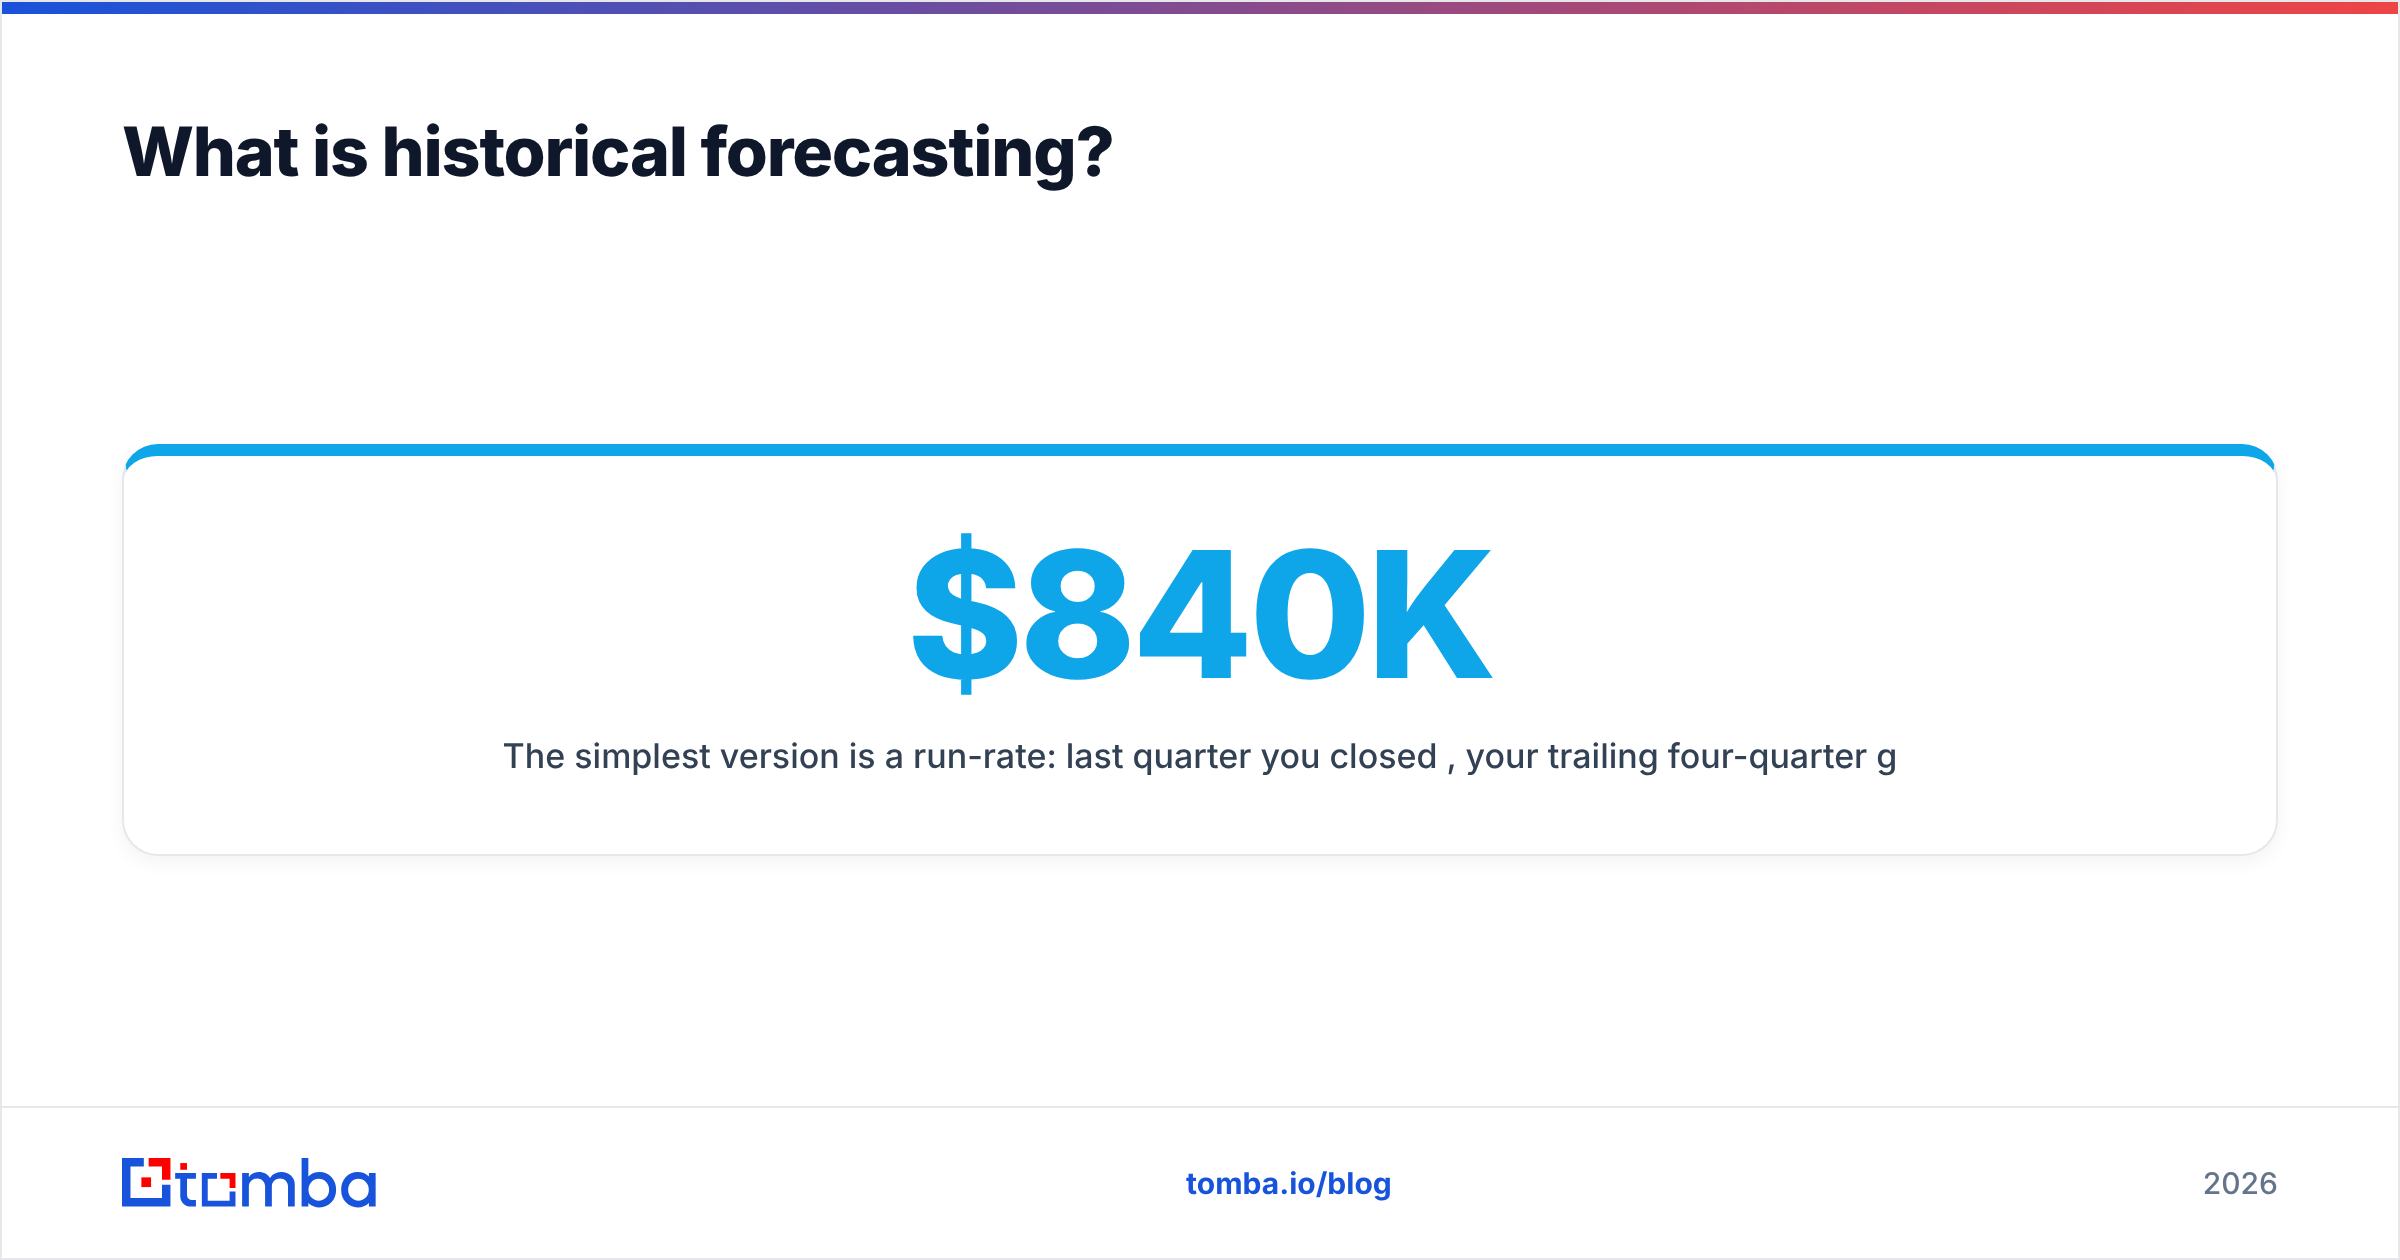
The simplest version is a run-rate: last quarter you closed $840K, your trailing four-quarter growth is 6% per quarter, so your baseline forecast is roughly $890K. The more useful version breaks that number into its components — lead volume, conversion rate by stage, average deal size, sales cycle length — and projects each one separately.
The distinction that matters: historical forecasting is backward-looking evidence applied forward. Pipeline forecasting is forward-looking claims discounted by history. They use overlapping data but answer different questions. Historical asks "what does this machine normally produce?" Pipeline asks "what is currently inside the machine?"
Both are forms of time series analysis applied to a sales org, and both fail in predictable ways. The trick is knowing which failure mode you're exposed to this quarter.
How does historical forecasting actually work?#
Five steps. Do them in order — skipping step 2 is the single most common reason a historical forecast reads confident and lands wrong.
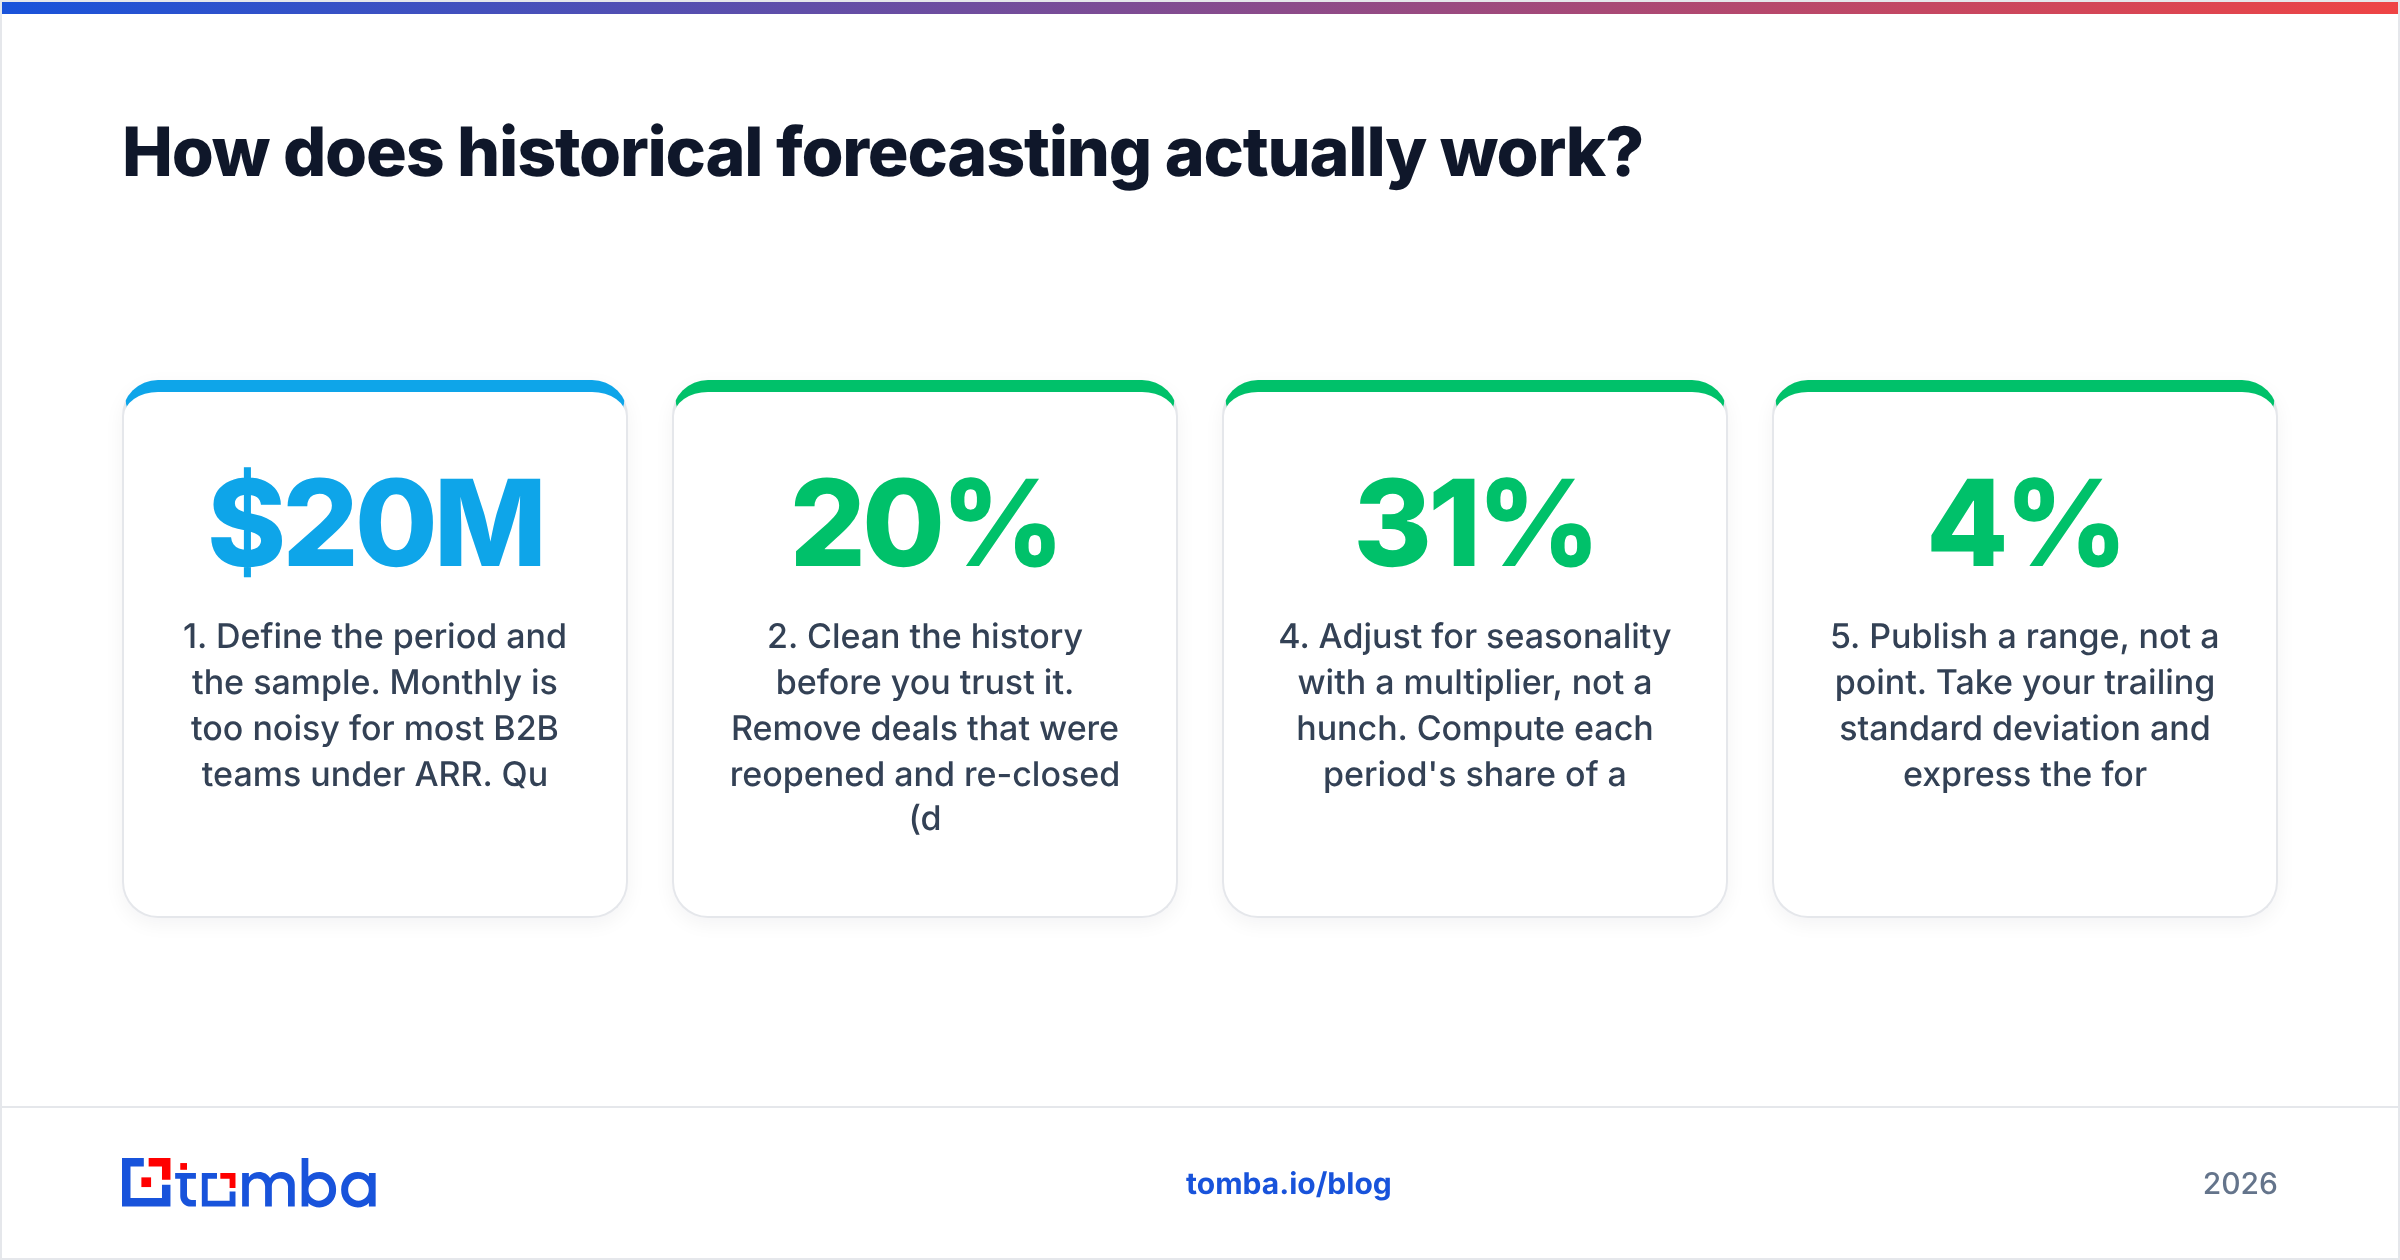
- Define the period and the sample. Monthly is too noisy for most B2B teams under $20M ARR. Quarterly with at least six trailing quarters gives you enough signal to separate trend from noise. Fewer than 30 closed-won deals per period means your averages are dominated by outliers.
- Clean the history before you trust it. Remove deals that were reopened and re-closed (double counting), deals migrated from a legacy CRM with fabricated close dates, and any period distorted by a one-off enterprise whale. If a single deal was more than 20% of a quarter, model it separately.
- Decompose the number into drivers. Revenue = leads × MQL rate × SQL rate × win rate × average contract value. Forecasting the composite number hides which driver is actually moving. Forecasting the drivers tells you where to intervene.
- Adjust for seasonality with a multiplier, not a hunch. Compute each period's share of annual revenue across two or more years. If Q4 has consistently been 31% of the year and Q1 has been 19%, apply those multipliers rather than assuming a flat quarter.
- Publish a range, not a point. Take your trailing standard deviation and express the forecast as base / low / high. A single number invites false precision and gets you fired when you miss by 4%.
Which forecasting method should you actually use?#
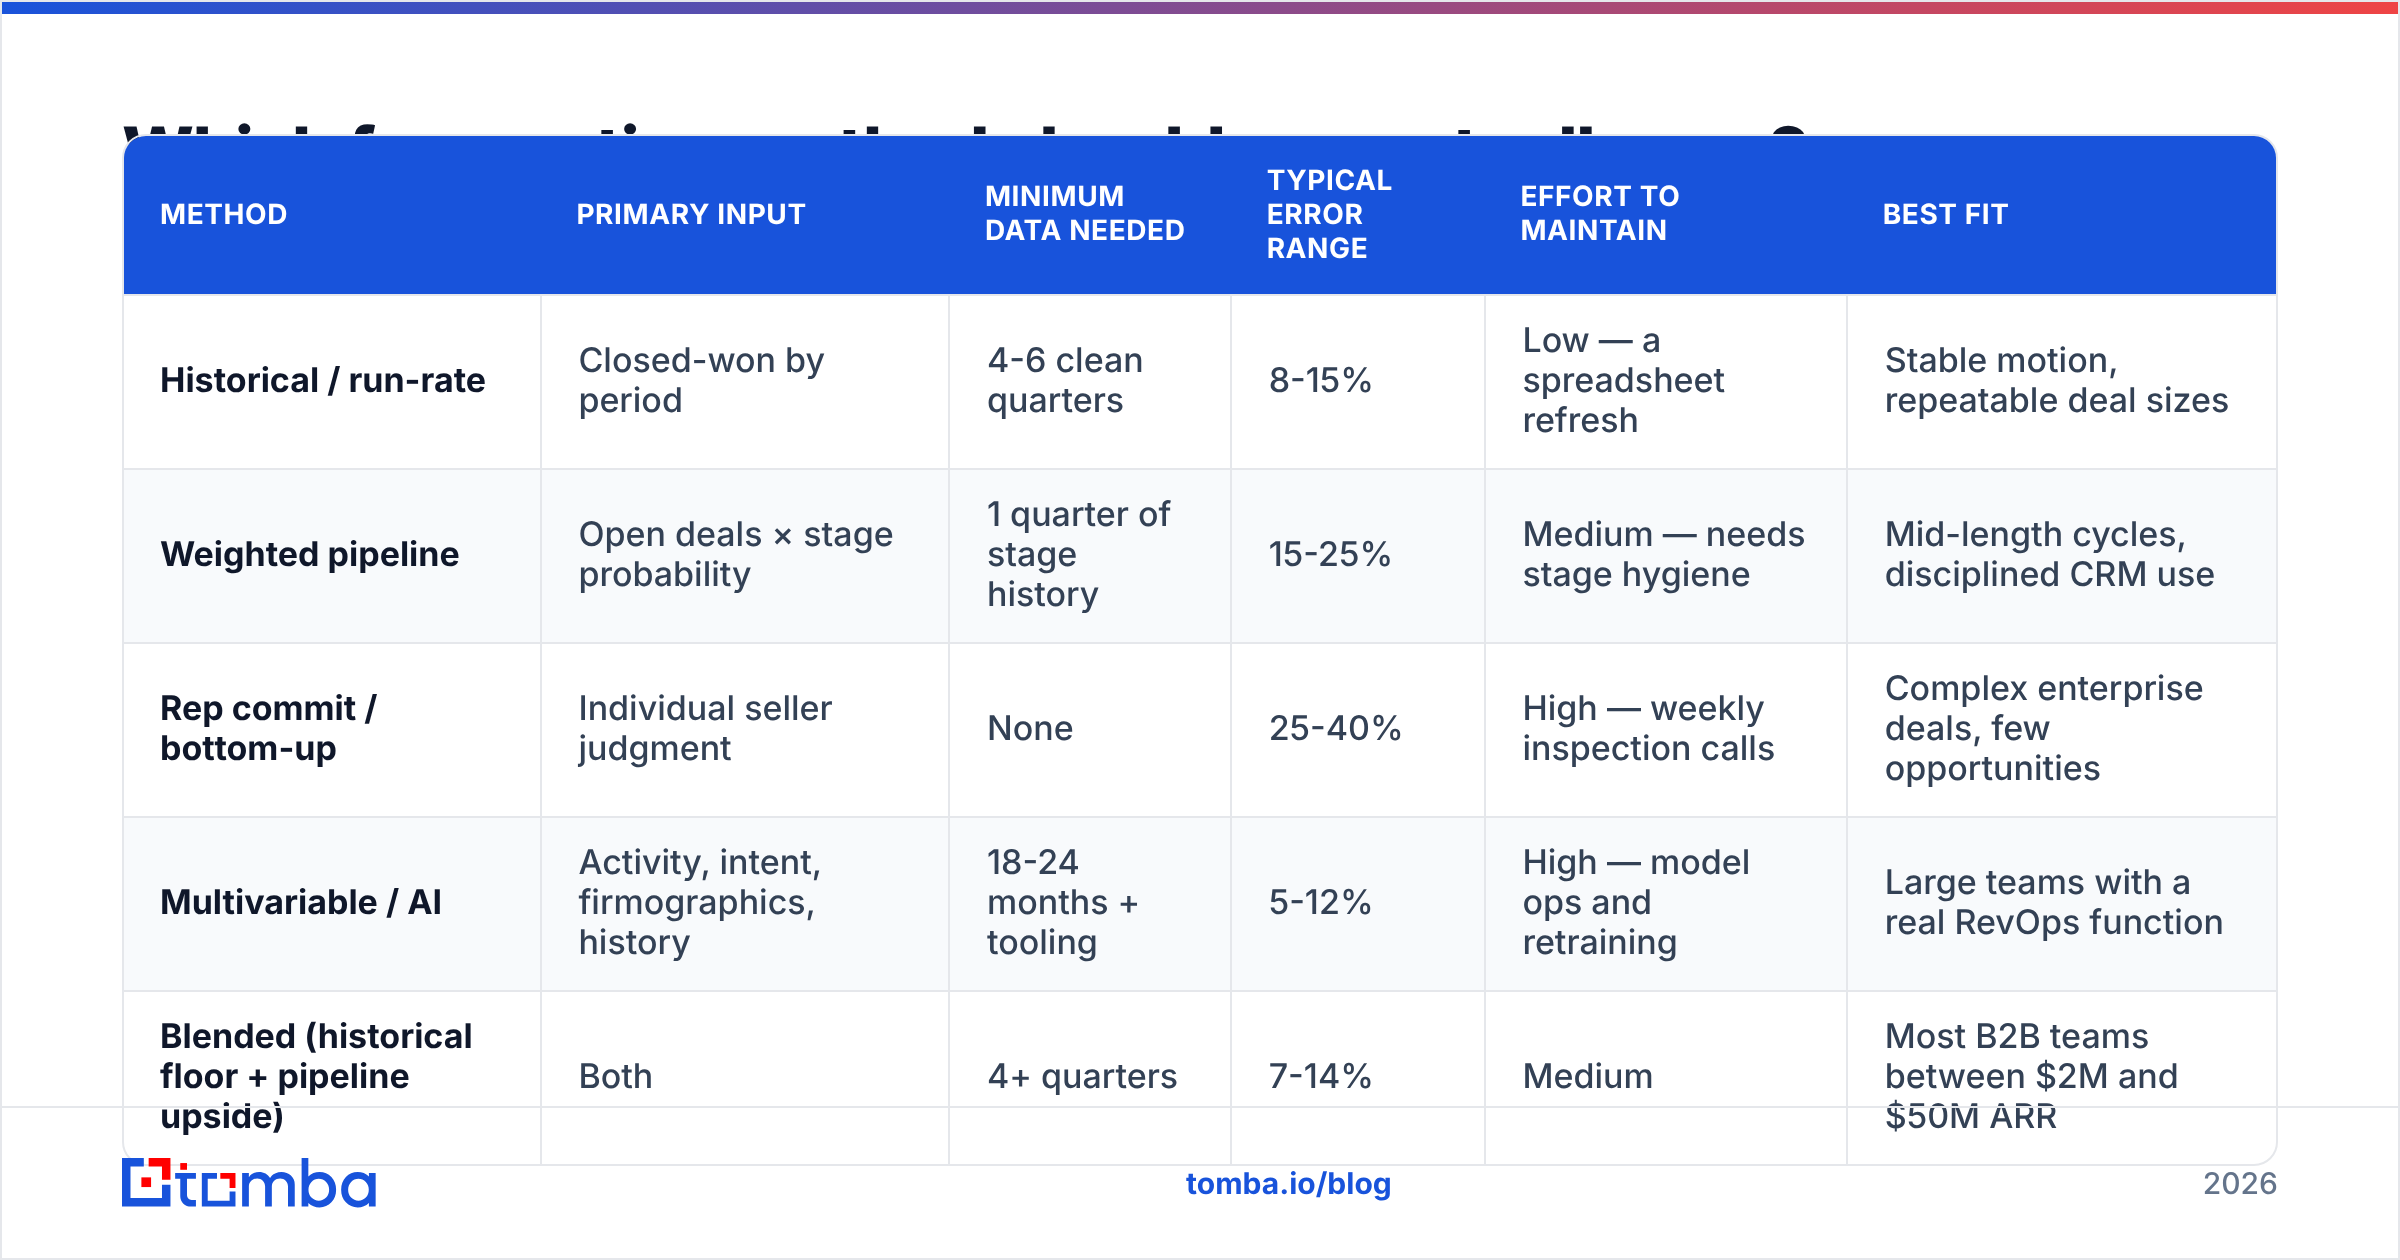
There is no universally best method — there is a best method for your data maturity and deal count. Here's how the main approaches compare on the dimensions that decide the choice.
| Method | Primary input | Minimum data needed | Typical error range | Effort to maintain | Best fit |
|---|---|---|---|---|---|
| Historical / run-rate | Closed-won by period | 4-6 clean quarters | 8-15% | Low — a spreadsheet refresh | Stable motion, repeatable deal sizes |
| Weighted pipeline | Open deals × stage probability | 1 quarter of stage history | 15-25% | Medium — needs stage hygiene | Mid-length cycles, disciplined CRM use |
| Rep commit / bottom-up | Individual seller judgment | None | 25-40% | High — weekly inspection calls | Complex enterprise deals, few opportunities |
| Multivariable / AI | Activity, intent, firmographics, history | 18-24 months + tooling | 5-12% | High — model ops and retraining | Large teams with a real RevOps function |
| Blended (historical floor + pipeline upside) | Both | 4+ quarters | 7-14% | Medium | Most B2B teams between $2M and $50M ARR |
The blended row is where most teams should land. Use historical as the floor because it is grounded in outcomes that already happened. Use weighted pipeline for the delta above that floor, because it is the only method that reacts to a pipeline surge in real time. When the two disagree by more than 20%, that gap is the actual thing worth discussing in your forecast call — not the individual deals.
What does a historical forecast look like with real numbers?#
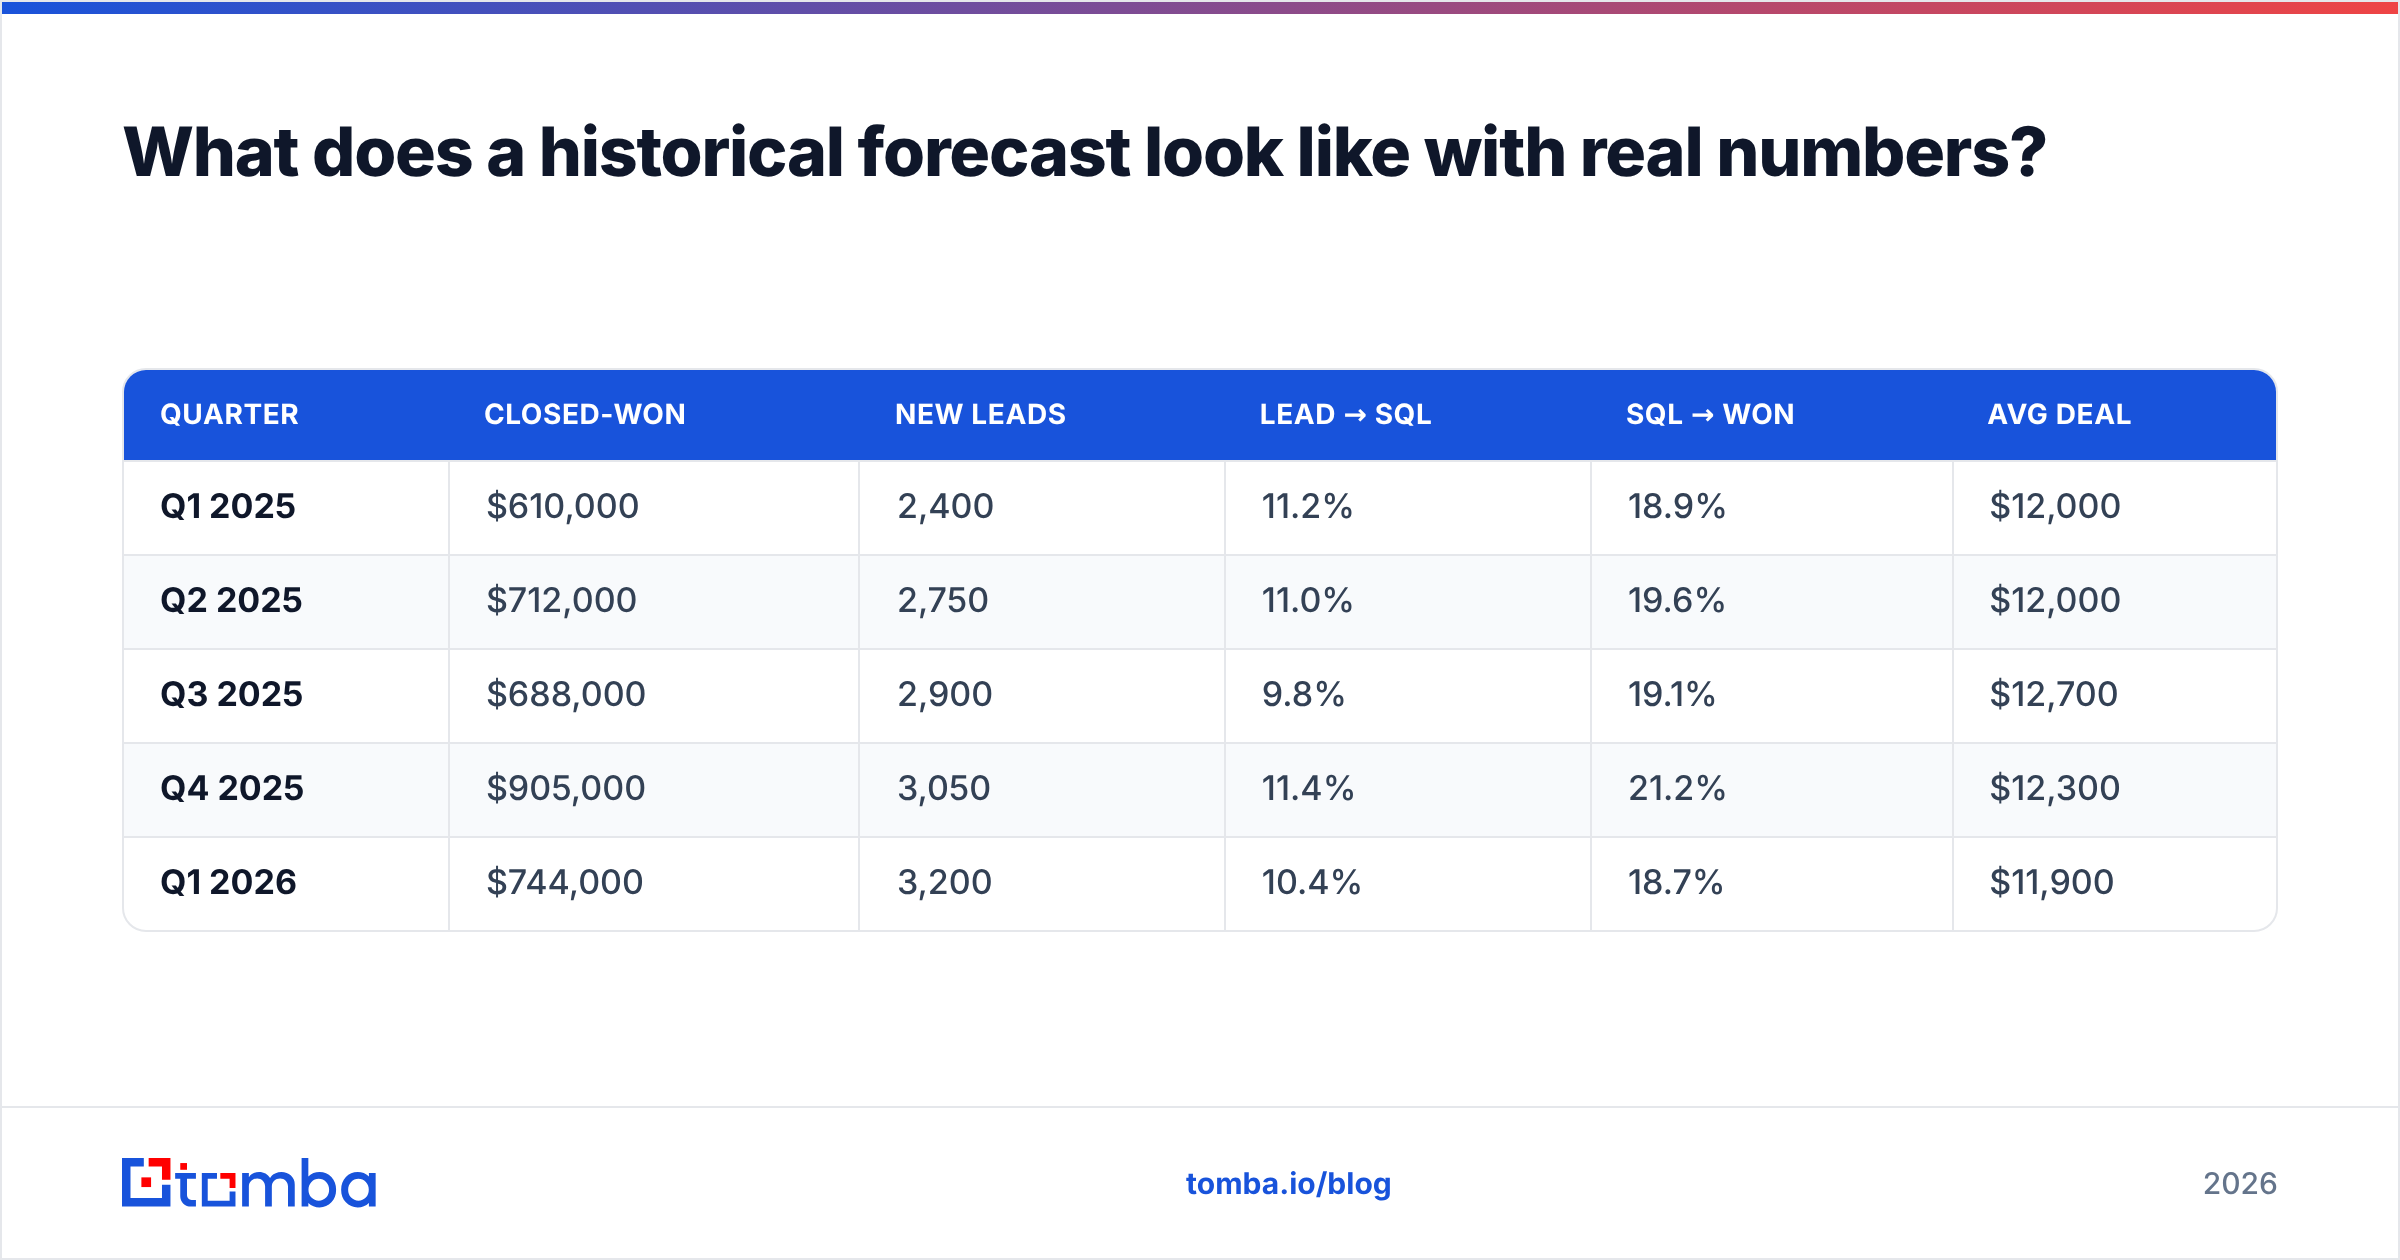
Take a team with this trailing history:
| Quarter | Closed-won | New leads | Lead → SQL | SQL → Won | Avg deal |
|---|---|---|---|---|---|
| Q1 2025 | $610,000 | 2,400 | 11.2% | 18.9% | $12,000 |
| Q2 2025 | $712,000 | 2,750 | 11.0% | 19.6% | $12,000 |
| Q3 2025 | $688,000 | 2,900 | 9.8% | 19.1% | $12,700 |
| Q4 2025 | $905,000 | 3,050 | 11.4% | 21.2% | $12,300 |
| Q1 2026 | $744,000 | 3,200 | 10.4% | 18.7% | $11,900 |
Baseline projection for Q2 2026: leads trending to ~3,350, apply the four-quarter mean SQL rate of 10.8% (348 SQLs), apply the mean win rate of 19.5% (68 deals), apply the trailing average deal size of $12,180. That gives you roughly $828K.
Then apply the seasonality multiplier. Q2 has run about 1.04× the four-quarter mean across two years, so the adjusted base is ~$861K. Your low case uses the worst observed conversion pair (9.8% and 18.7%) for $706K. Your high case uses the best (11.4% and 21.2%) for $972K.
Now you have a defensible range and, more importantly, a diagnostic: Q3 2025's dip was a lead-quality problem (SQL rate fell to 9.8%), not a closing problem. The composite revenue number would never have told you that.
Notice the vulnerable link. Every number in that chain starts with "new leads." If 18% of those records carry invalid email addresses, your lead count is inflated, your SQL rate looks artificially low, and the model bakes a data-quality defect into next quarter's target. Running your list through an email verifier before it enters the CRM is not a deliverability chore — it is forecast hygiene.
Where does historical forecasting break?#
Four failure modes, ranked by how often they actually bite.
You changed the motion. New pricing, a new segment, a new channel, or a PLG motion layered onto sales-led — any of these invalidate the historical base. Your model is describing a company that no longer exists. Rule of thumb: after a material motion change, historical forecasting needs two full quarters of new data before it's trustworthy again, and you run weighted pipeline in the interim.
Your sample is too thin. With 12 deals per quarter, one lost whale swings the average by 30%. Small-sample teams should forecast on deal count and handle large deals as named line items, not blend them into an average.
Your CRM lies. Stages advanced in bulk at quarter end, close dates pushed rather than lost, duplicate accounts from three enrichment vendors. Historical forecasting is more sensitive to dirty data than rep commits are, because the model has no skepticism. A rep knows the Acme deal is dead; the spreadsheet doesn't. Consistent data enrichment and deduplication is a forecasting prerequisite, not a marketing nicety.
You extrapolate through a discontinuity. Recessions, category shocks, a competitor's collapse, a major platform policy change. Historical methods have zero ability to anticipate regime change — that is their defining structural weakness. Gartner's sales research has repeatedly flagged forecast overconfidence during demand shifts as a top cause of missed boards.
How accurate should you expect it to be?#
Set expectations by maturity, not by ambition.
- Under 30 deals/quarter: expect 20-30% error. Historical forecasting is a sanity check here, not a commit.
- 30-150 deals/quarter, clean data: 8-15% error is realistic and beats most rep-commit processes outright.
- 150+ deals/quarter with driver-level modeling: 5-10% is achievable, and at this point you should be evaluating a multivariable model.
Measure error the same way every period: absolute percentage error against actual, tracked over a rolling four quarters. Reporting only the quarters where you were close is how forecasting programs lose credibility. HubSpot's sales forecasting guide makes the same point about consistency of methodology — switching methods mid-year makes your accuracy trend meaningless.
One underrated metric: forecast bias, not just error. If you are consistently 6% low, that's not noise, that's a systematic correction you should be applying. If your error swings +14% then -11% then +9%, you have a variance problem and a wider range is the honest answer.
How does this fit into your RevOps stack?#
Historical forecasting is a revenue operations function, not a sales-management ritual. Three practical integration points:
- Upstream — data integrity. Every forecast driver depends on record quality. Deduplicated accounts, verified contacts, enriched firmographics. If your top-of-funnel counts are inflated by invalid records, your conversion rates are wrong in a way no model can correct for.
- Midstream — stage definitions. Historical conversion rates are only comparable across periods if "SQL" meant the same thing in Q1 2025 as it does now. Version your stage definitions and note the change date on the forecast.
- Downstream — capacity planning. The real payoff isn't the revenue number. It's deriving how many SQLs a rep needs to hit quota, which tells you how much pipeline marketing owes you, which tells you how many contacts you need to source. A B2B database with predictable coverage makes that last step a planning input instead of a monthly scramble.
Vendors in this space — including data providers like BookYourData, which does well on verified, ready-to-send B2B lists — differ mostly in coverage depth versus freshness. Both matter to a forecast, but freshness matters more: a stale record inflates your denominator every single period until someone cleans it out.
Should you replace historical forecasting with AI?#
Not yet, and probably not entirely. Multivariable models genuinely outperform when you have 18+ months of clean activity data, enough deal volume for the model to learn from, and someone accountable for retraining it. That's a real RevOps function, not a checkbox in a CRM.
What most teams get when they buy "AI forecasting" today is a weighted-pipeline model with engagement signals added. That's an improvement over stage-probability alone, but it inherits every data-quality problem you already have — and adds opacity. When a spreadsheet is wrong, you can see why in ten minutes. When a black-box score is wrong, you file a ticket.
The pragmatic sequence: get historical forecasting working and measured first. Once your rolling error is under 15% and you trust your CRM, layer in a model. Skipping straight to AI on dirty data reliably produces a confident wrong number, which is worse than an uncertain right range.
What should you do this week?#
- Pull six trailing quarters of closed-won, by deal, with close date and amount.
- Strip outliers over 20% of any single quarter and model them separately.
- Compute the four driver rates — lead volume, SQL rate, win rate, average deal size — per quarter.
- Build the base/low/high range from observed extremes, not from optimism.
- Log your forecast, then log the actual. Do it every quarter. Accuracy is a track record, not a claim.
The whole method rests on one assumption: that the records feeding your funnel are real. Before your next forecast cycle, audit the top of it. Tomba's Email Finder sources verified professional addresses by domain, name, or company so the lead counts entering your model reflect contactable humans rather than inflated row counts — with a free tier at 25 searches/month and paid plans from $49/mo on Tomba pricing when you're ready to run it at list scale. Fix the inputs, and the forecast starts telling you the truth.
Related guides#
Ready to find emails that actually work?
Join 150,000+ professionals who stopped guessing and started sending. Free credits on signup — no credit card required.
Get the Tomba newsletter
Practical outbound tactics and product updates — once every two weeks.
About the author