How Do You Calculate a Conversion Rate? Formula + Examples
Conversion rate looks like one simple formula until you pick the denominator. Here is how to calculate it correctly across cold email, ads, and pipeline stages — plus the mistakes that inflate your numbers.
TL;DR
- Conversion rate = (conversions ÷ total opportunities) × 100. The formula is trivial; picking the denominator is where teams go wrong.
- Use unique counts, not raw events. Counting three form submissions from one person as three conversions inflates your rate instantly.
- Cold email has four different "conversion rates" (delivered, open, reply, meeting booked). Always name which one you mean.
- Bad contact data silently deflates every rate downstream — bounced sends still sit in your denominator.
- Segment before you optimize. A blended 2.1% rate can hide a 6% channel and a 0.3% channel that should be killed.
What is a conversion rate, exactly?#
A conversion rate is the percentage of people who took the action you wanted, out of everyone who had the chance to take it.
The formula:
Conversion Rate = (Conversions ÷ Total Opportunities) × 100That's it. If 40 of 1,000 website visitors requested a demo, your demo conversion rate is (40 ÷ 1000) × 100 = 4%.
The analogy: a conversion rate is a batting average. Hits divided by at-bats. The argument in every revenue team isn't about division — it's about what counts as an at-bat. Does a visitor who bounced in two seconds count? Does an email that hard-bounced count as an attempt? Those choices move the number by multiples.
Three rules keep the math honest:
- Count unique actors, not events. One prospect who books, cancels, and rebooks is one conversion.
- Match the time window on both sides. Conversions in March divided by traffic in Q1 is not a rate; it's a fiction.
- Keep the denominator to people who could actually convert. Bots, bounced emails, and internal traffic don't belong.
- Name the conversion event in writing. "Conversion" means demo booked to sales and email captured to marketing. Write it down once.
How do you calculate a conversion rate step by step?#
Work it in five steps. The example below uses an outbound email campaign, but the sequence is identical for ads, landing pages, or pipeline stages.
- Define the conversion event. Pick one: meeting booked. Not "interested reply," not "opened." One event, one definition.
- Define the denominator. Contacts who received a delivered email — 4,600 delivered out of 5,000 sent.
- Set the attribution window. 14 days from first touch. Anything later belongs to the next cohort.
- De-duplicate both sides. 4,600 delivered → 4,410 unique people after removing role accounts and duplicates.
- Divide and label. 63 meetings booked ÷ 4,410 = 1.43% delivered-to-meeting rate.
That label matters more than the number. "1.43%" alone is meaningless. "1.43% delivered-to-meeting over 14 days" is a metric someone can act on and reproduce next quarter.

Which denominator should you use?#
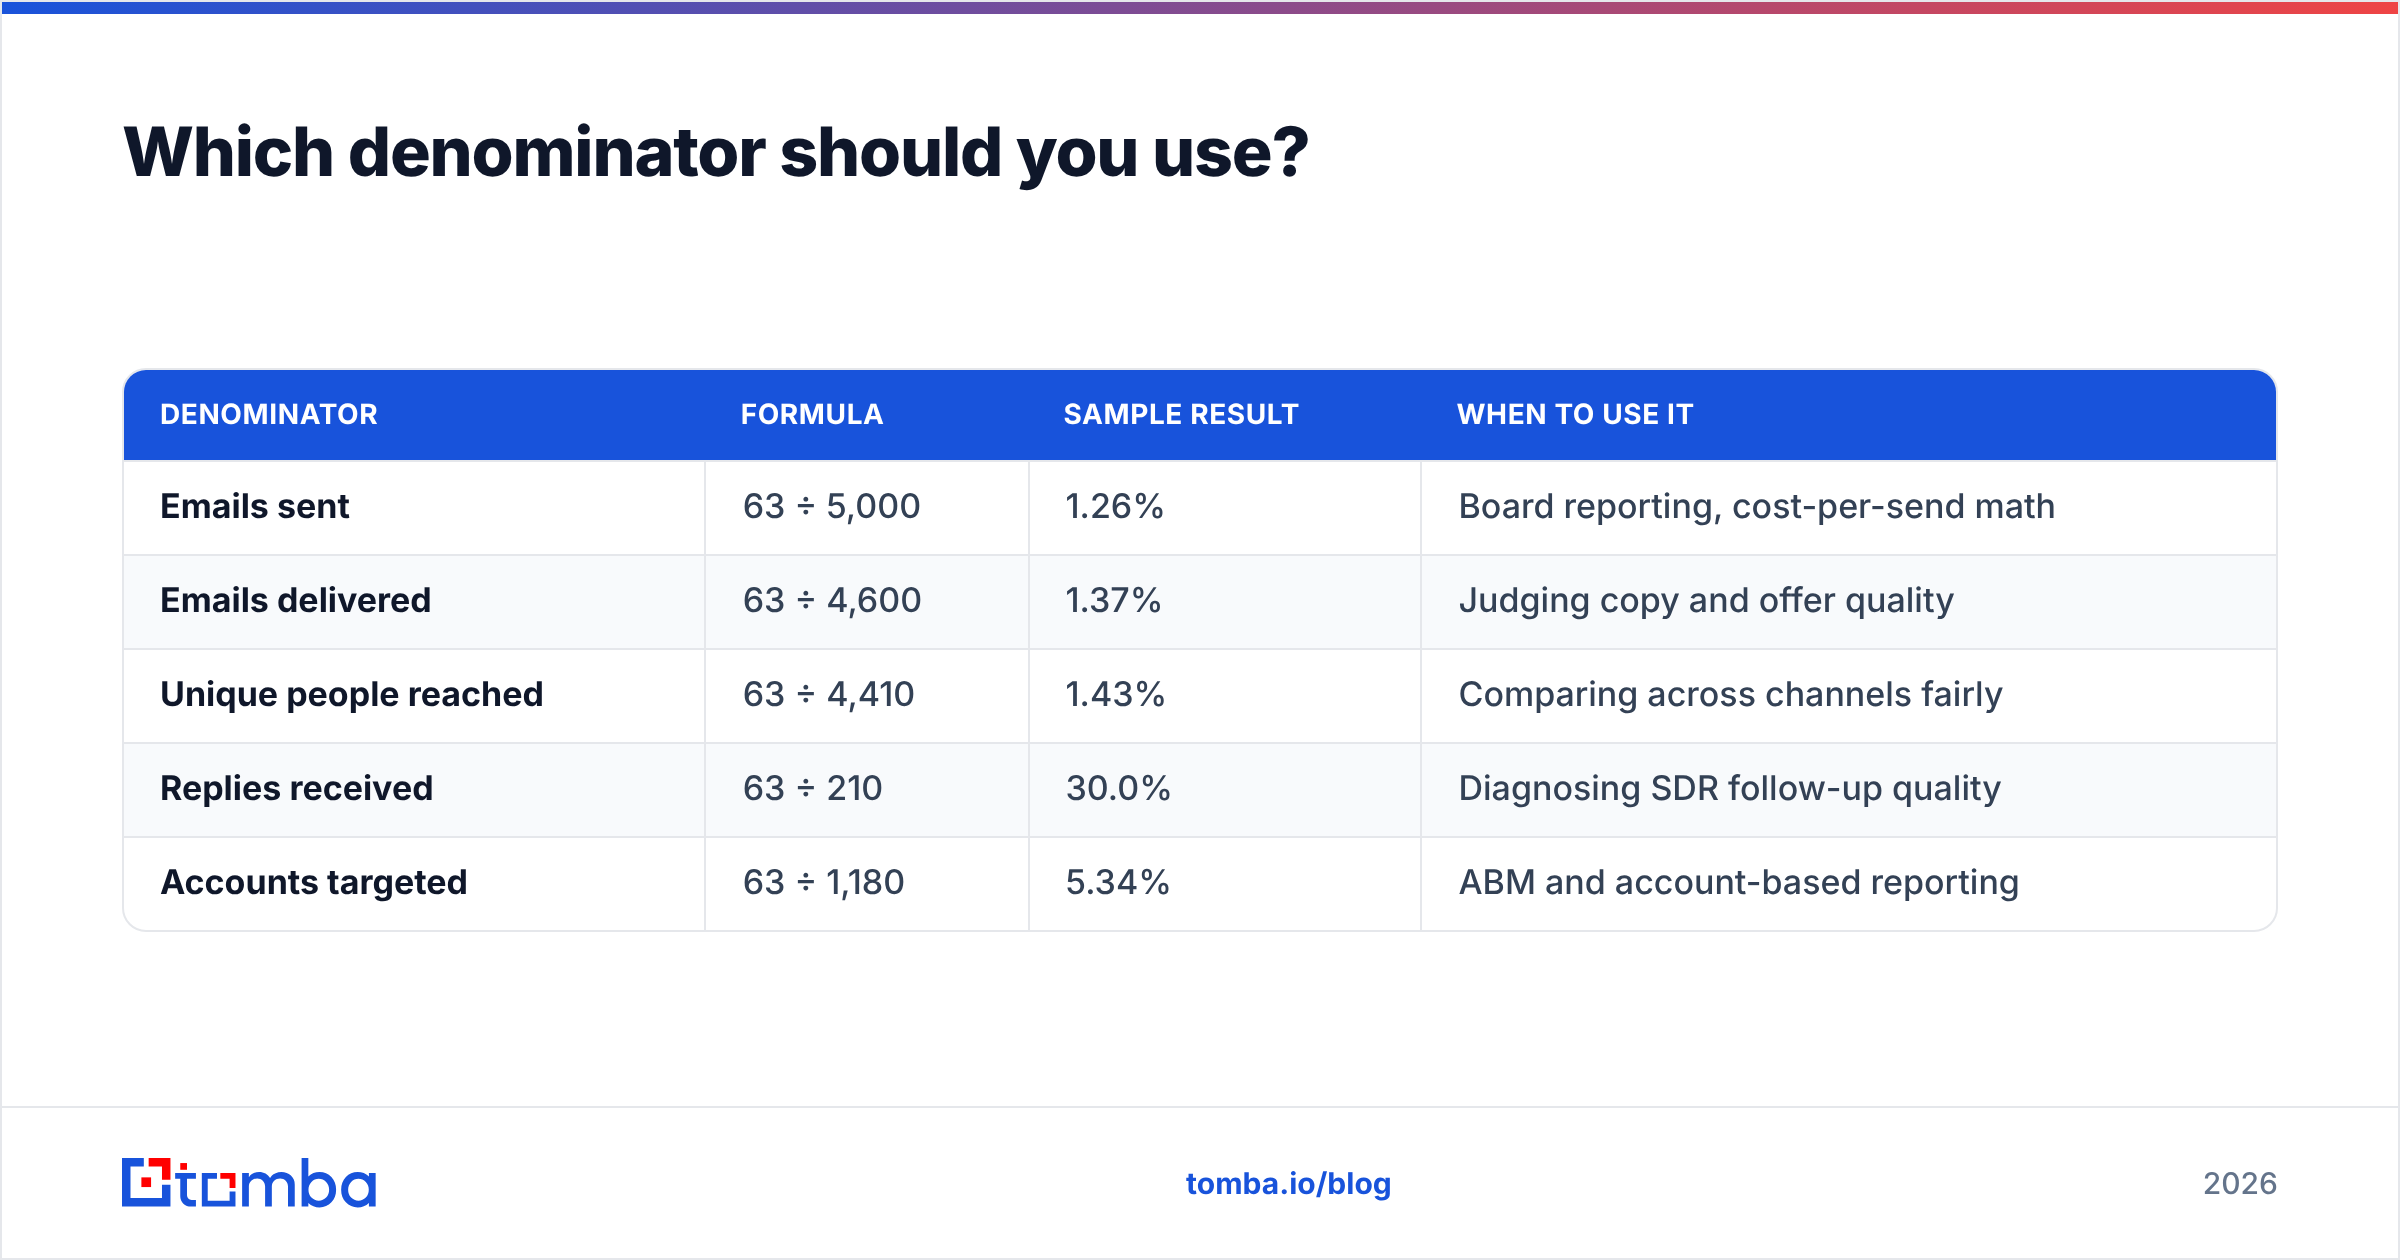
This is the whole game. The same campaign produces wildly different rates depending on what you divide by — and none of them are technically wrong.
| Denominator | Formula | Sample result | When to use it |
|---|---|---|---|
| Emails sent | 63 ÷ 5,000 | 1.26% | Board reporting, cost-per-send math |
| Emails delivered | 63 ÷ 4,600 | 1.37% | Judging copy and offer quality |
| Unique people reached | 63 ÷ 4,410 | 1.43% | Comparing across channels fairly |
| Replies received | 63 ÷ 210 | 30.0% | Diagnosing SDR follow-up quality |
| Accounts targeted | 63 ÷ 1,180 | 5.34% | ABM and account-based reporting |
Notice the spread: 1.26% to 30.0% from one campaign. Anyone can pick the flattering number. The discipline is picking one denominator per question and never switching mid-analysis.
Pick by the decision you're making. If you're deciding whether to rewrite the email, delivered is right — you can't blame copy for undelivered mail. If you're deciding whether outbound beats paid search, unique people reached is the only fair comparison, because both channels get counted the same way.
What are the main conversion rate formulas by channel?#
Each channel has its own conventional denominator. Use these unless you have a reason not to.
- Website conversion rate — (Unique converting visitors ÷ Unique visitors) × 100. Filter out bot traffic first, or you'll understate by 10–30%.
- Landing page conversion rate — (Form submissions ÷ Unique page views) × 100. Session-based, not pageview-based, so refreshes don't double-count.
- Cold email reply rate — (Unique repliers ÷ Delivered emails) × 100. Auto-responders and out-of-office replies get excluded.
- Lead-to-opportunity rate — (Opportunities created ÷ Leads created in the same cohort) × 100. Cohort matters; leads take weeks to mature.
- Opportunity-to-close rate — (Closed-won ÷ Total closed opportunities) × 100. Note the denominator excludes still-open deals, which is what separates this from a naive win rate.
- Ad conversion rate — (Conversions ÷ Clicks) × 100. Impressions belong in CTR, not conversion rate.
The lead-to-opportunity formula trips up the most teams. If you divide this month's opportunities by this month's new leads, and your sales cycle is 45 days, you're dividing mature numerator by immature denominator. The rate looks stable while nothing real is measured. Cohort the leads by creation month and let them age.
How do you calculate conversion rate across a multi-stage funnel?#
Two ways, and they answer different questions.
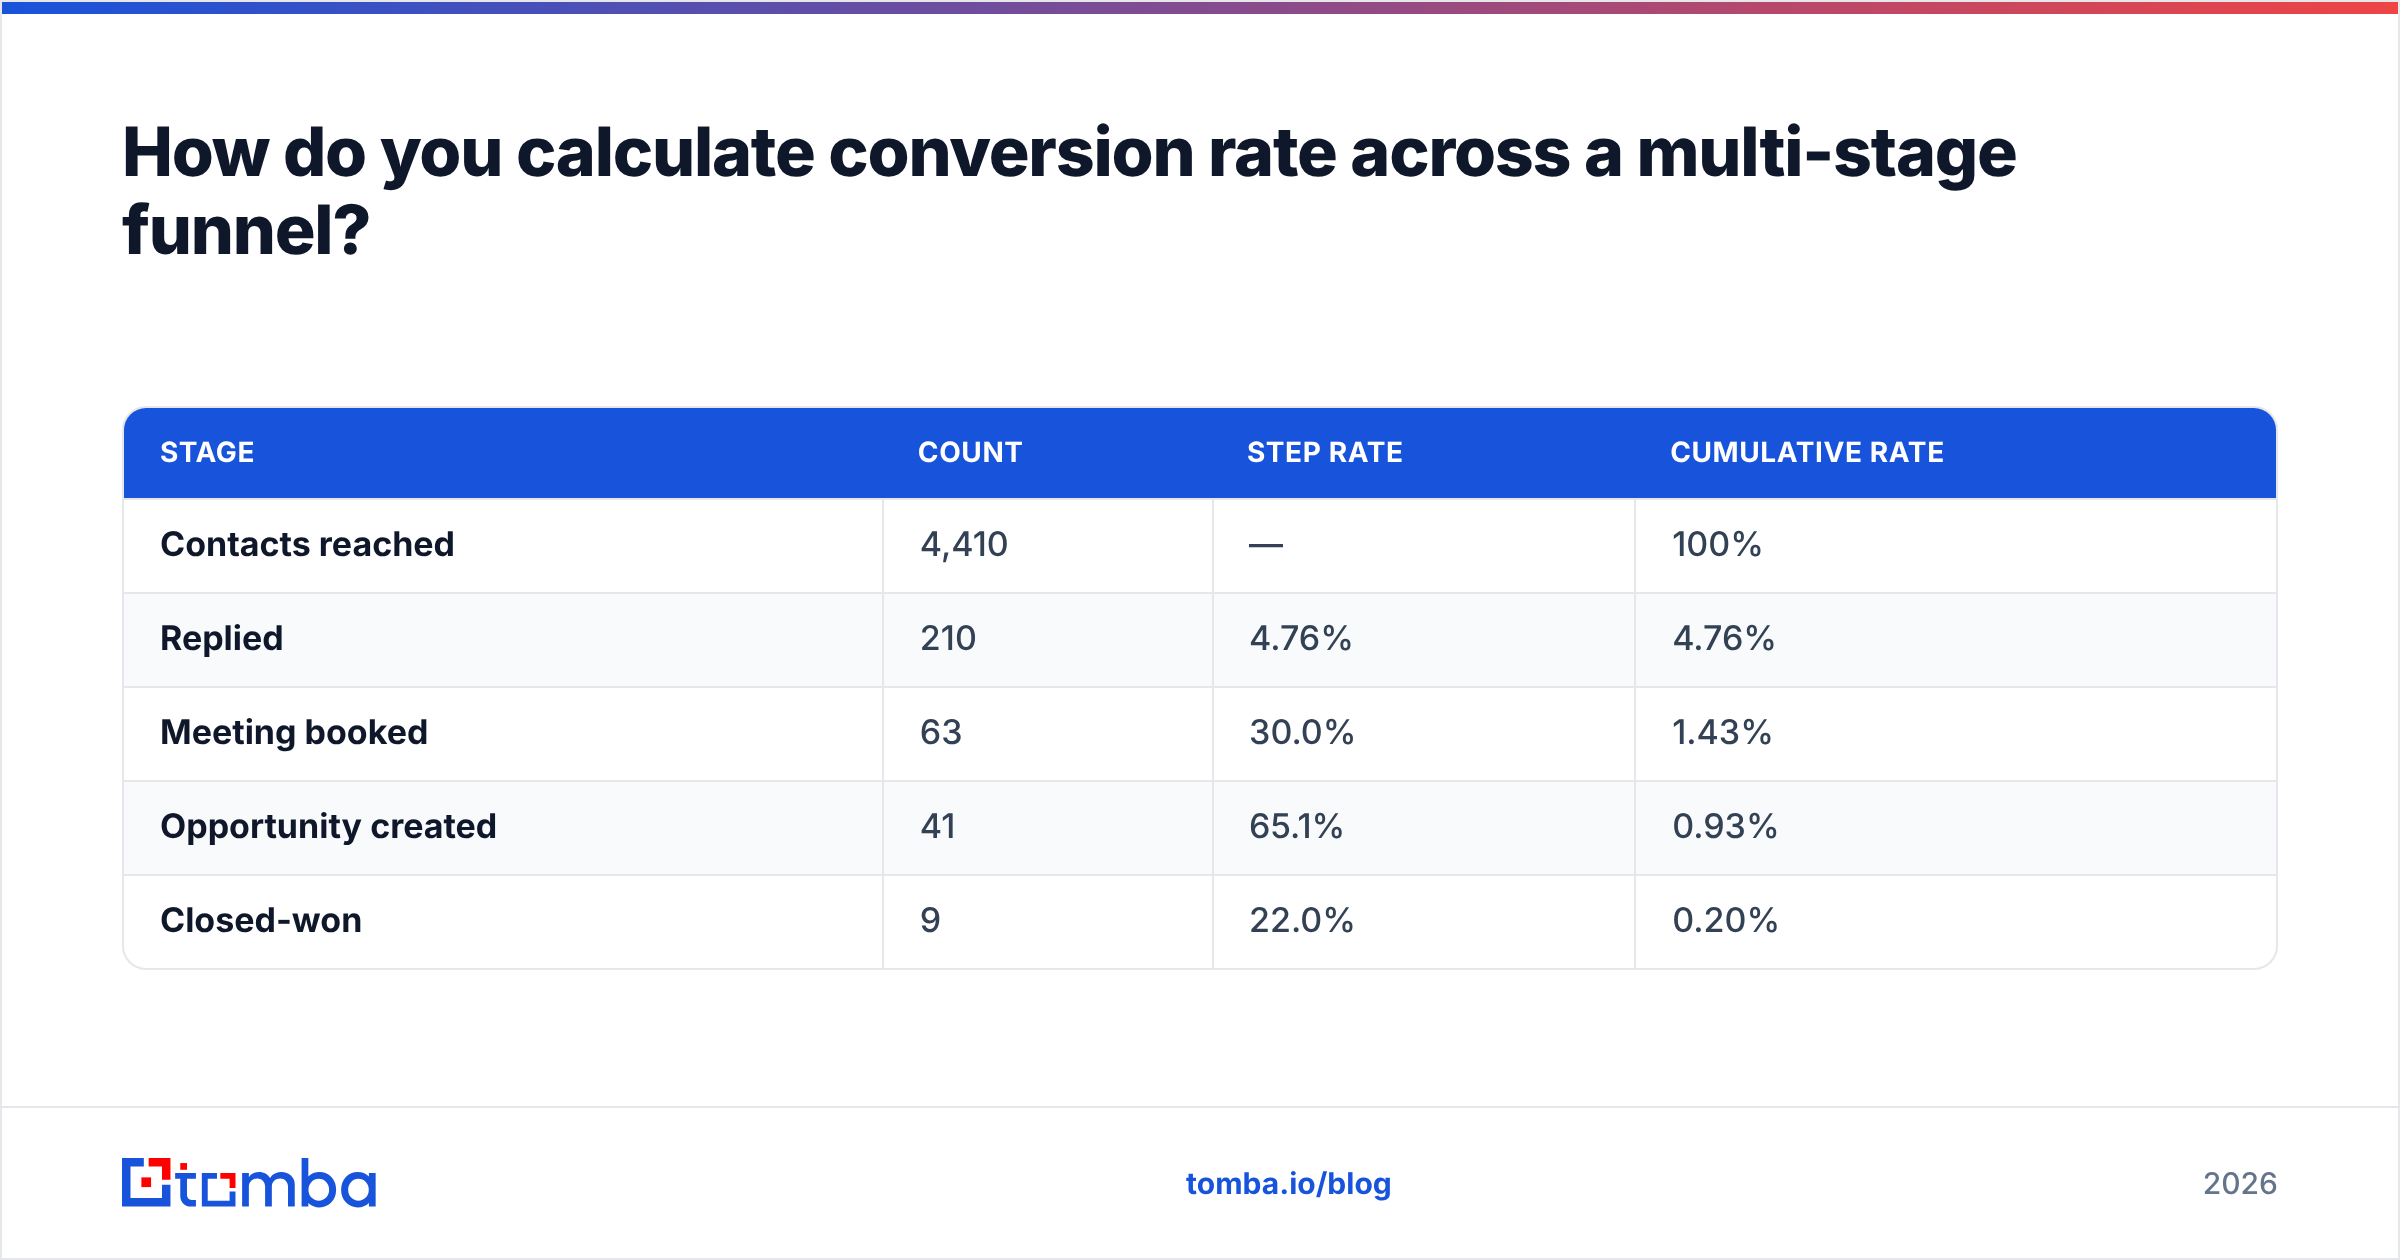
Step conversion measures one stage against the prior stage. Cumulative conversion measures each stage against the original top-of-funnel count.
| Stage | Count | Step rate | Cumulative rate |
|---|---|---|---|
| Contacts reached | 4,410 | — | 100% |
| Replied | 210 | 4.76% | 4.76% |
| Meeting booked | 63 | 30.0% | 1.43% |
| Opportunity created | 41 | 65.1% | 0.93% |
| Closed-won | 9 | 22.0% | 0.20% |
Read the step-rate column to find the leak. Here, reply-to-meeting at 30% is healthy and meeting-to-opportunity at 65% is strong — the bottleneck is the 4.76% reply rate at the top. Adding SDRs won't fix that. Better targeting and better data will.
Read the cumulative column to forecast. At 0.20% end-to-end, hitting 20 closed-won deals next quarter needs roughly 10,000 contacts reached — assuming the rates hold, which they won't at scale. Model a 15–25% degradation as you expand the list beyond your best-fit accounts.
Why do bad contact lists ruin conversion rate math?#
Because invalid contacts sit in your denominator while contributing zero to the numerator, and they distort your read on everything upstream.
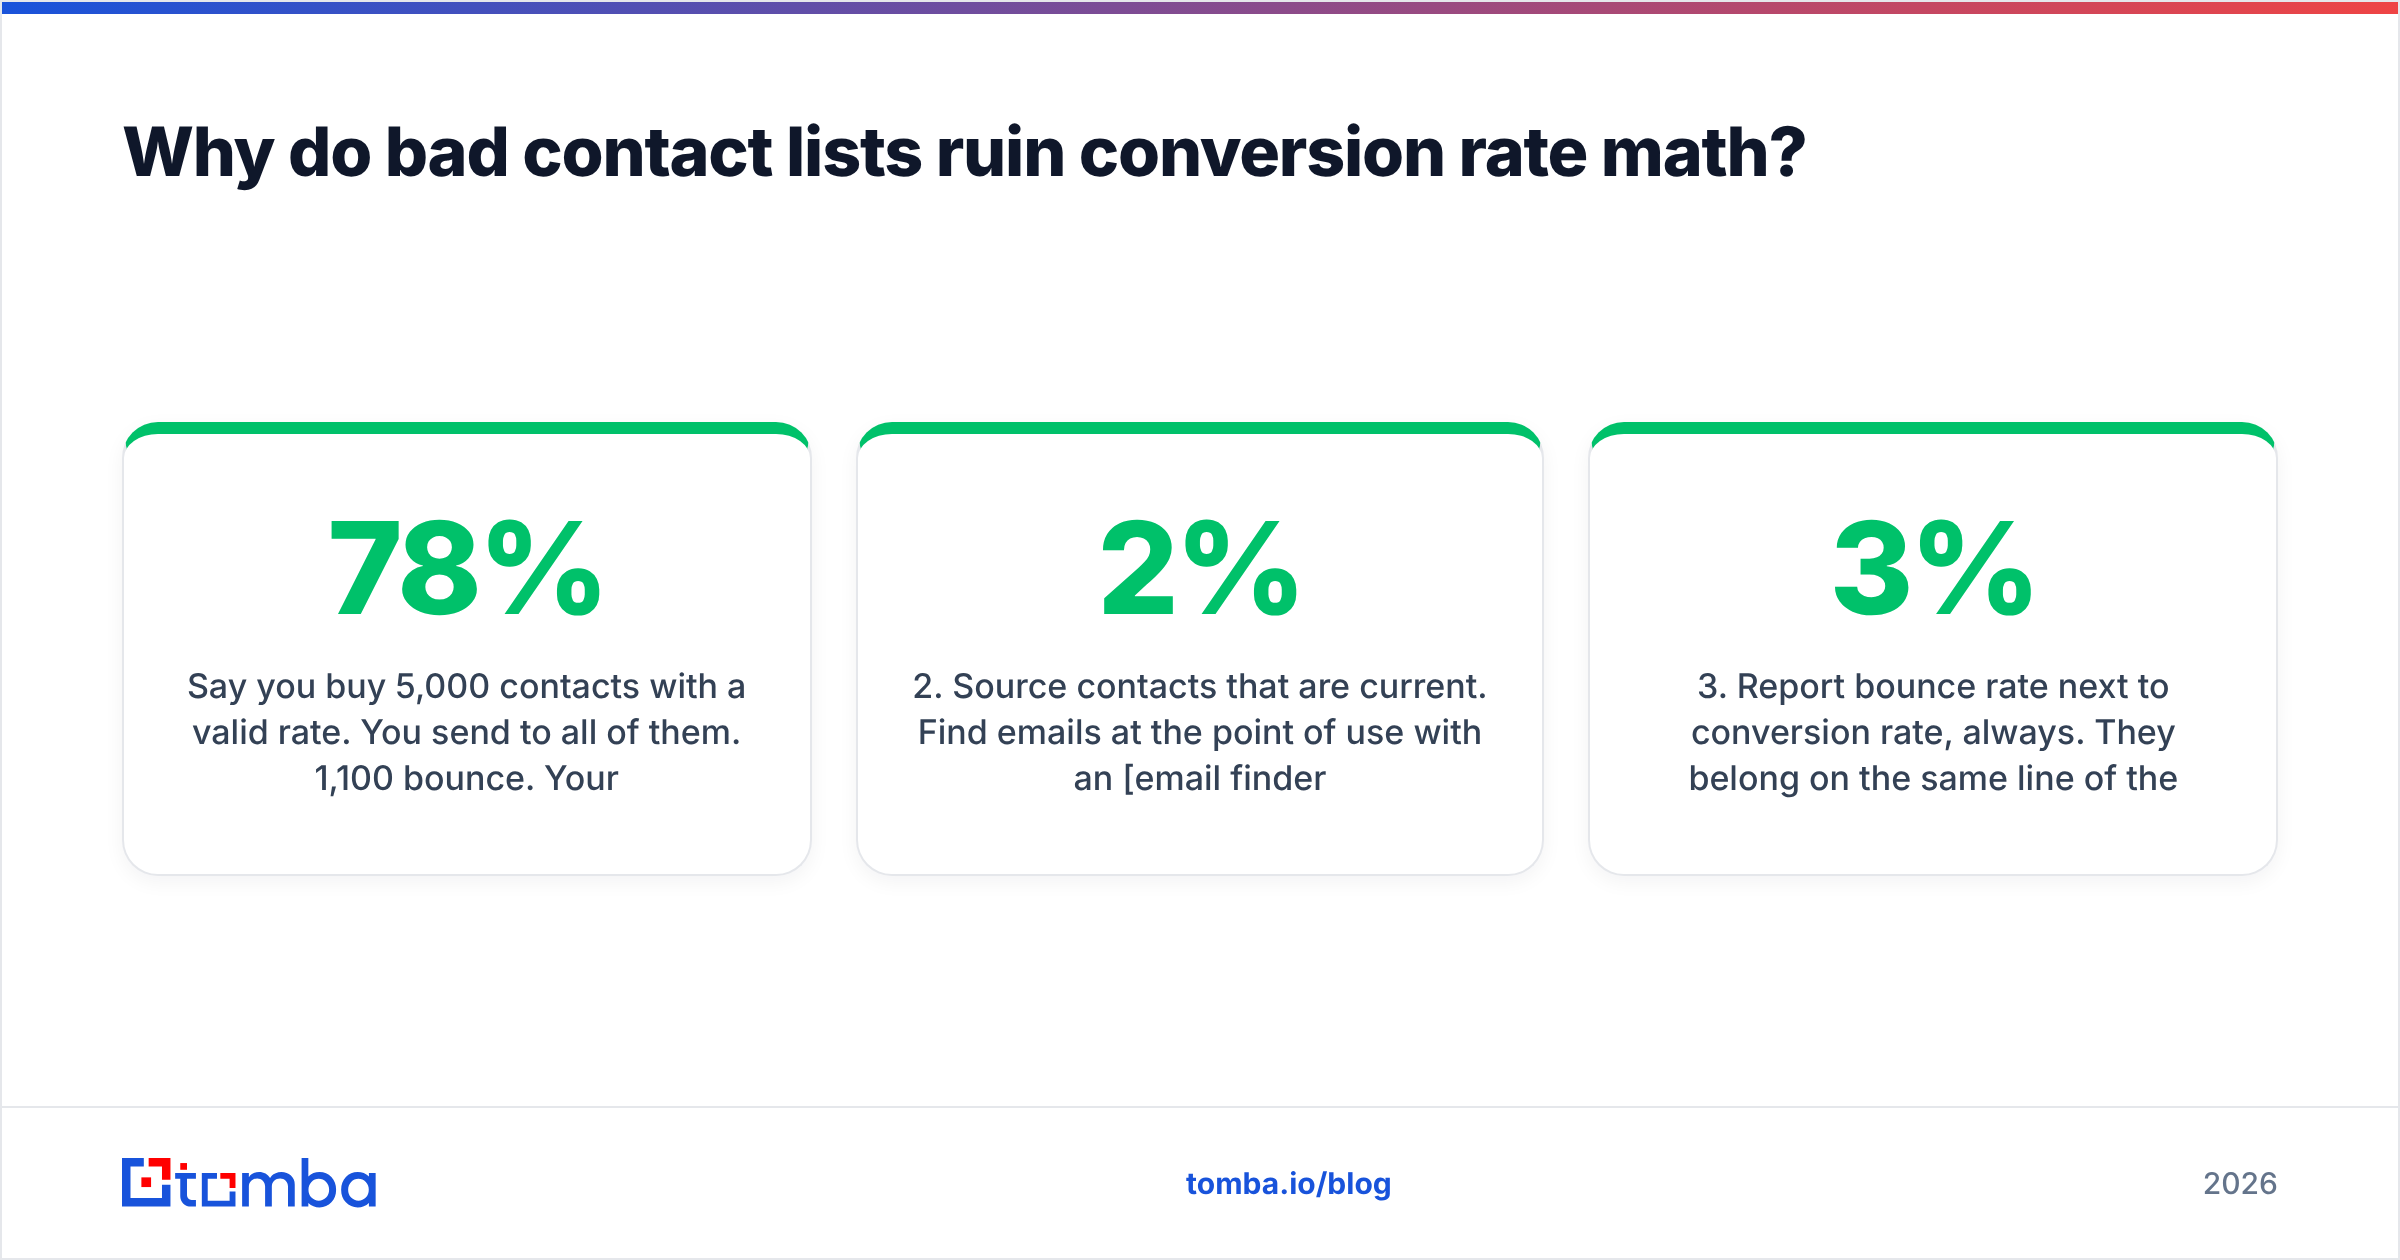
Say you buy 5,000 contacts with a 78% valid rate. You send to all of them. 1,100 bounce. Your platform reports on delivered mail, so those 1,100 quietly disappear from the analysis — but you paid for them, your sender reputation absorbed the damage, and your cost-per-meeting silently rose 22%. The conversion rate on your dashboard looks fine. The economics do not.
Worse, a high bounce rate suppresses inbox placement for the mail that does deliver. So your reply rate drops for reasons that have nothing to do with your copy — and if you're A/B testing subject lines that week, you'll draw the wrong conclusion and ship it everywhere.
Three fixes, in order of impact:
- Verify before you send. Run every list through an email verifier and drop anything that isn't deliverable. This alone recovers most of the distortion.
- Source contacts that are current. Find emails at the point of use with an email finder or a domain search rather than working from a static file that decays roughly 2% per month as people change jobs.
- Report bounce rate next to conversion rate, always. They belong on the same line of the same dashboard. A 3% conversion rate at a 2% bounce rate is a different business than 3% at 18%.

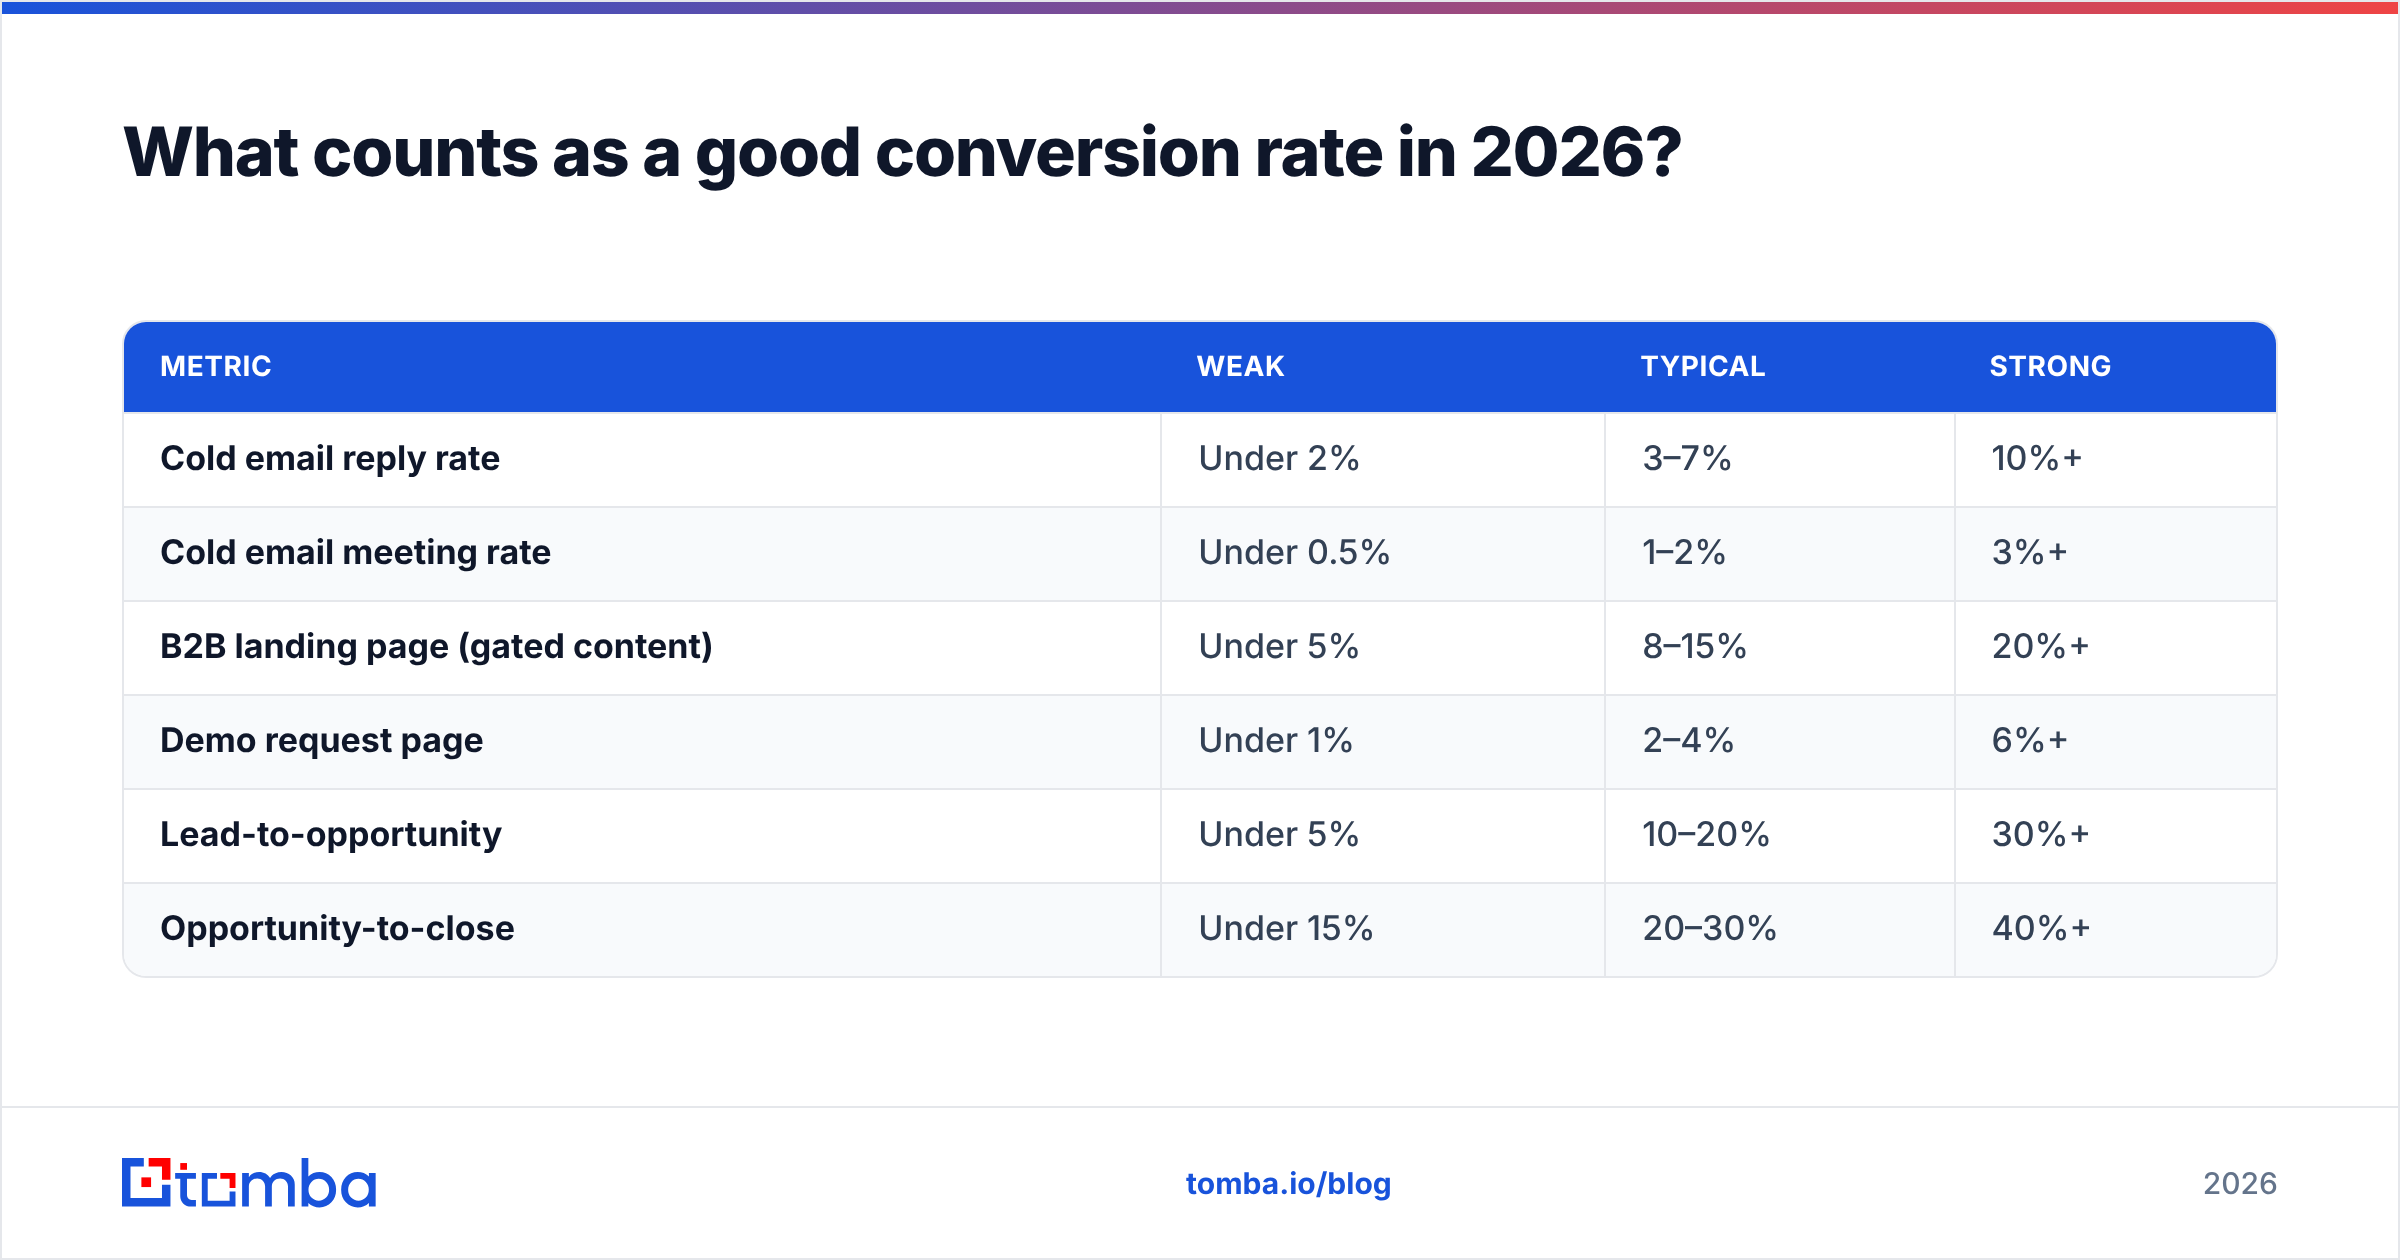
What counts as a good conversion rate in 2026?#
Benchmarks are useful as sanity checks and dangerous as targets. Your ICP, ACV, and channel mix move these ranges more than any tactic does.
| Metric | Weak | Typical | Strong |
|---|---|---|---|
| Cold email reply rate | Under 2% | 3–7% | 10%+ |
| Cold email meeting rate | Under 0.5% | 1–2% | 3%+ |
| B2B landing page (gated content) | Under 5% | 8–15% | 20%+ |
| Demo request page | Under 1% | 2–4% | 6%+ |
| Lead-to-opportunity | Under 5% | 10–20% | 30%+ |
| Opportunity-to-close | Under 15% | 20–30% | 40%+ |
Two caveats worth more than the table. First, high-ACV enterprise motions run lower rates at every stage and that's correct — a 0.4% meeting rate against Fortune 500 CFOs can be a better business than 4% against small agencies. Second, published benchmarks skew high because nobody blogs about their bad quarter. Research from HubSpot and peer reviews on G2 are directionally useful, but your own trailing four quarters is the only benchmark that governs your decisions.
Compare yourself to yourself, segmented. Your rate last quarter, same segment, same denominator definition.
What are the most common conversion rate mistakes?#
- Blending segments. A 2.1% blended rate hiding a 6% enterprise segment and a 0.4% SMB segment tells you to do nothing. Split it and the decision is obvious.
- Switching denominators mid-report. Slide 4 uses sent, slide 9 uses delivered, the trend line is fabricated. Lock the definition in your reporting layer, not in each analyst's head.
- Counting events instead of people. Especially bad on multi-step forms and retargeting, where one person generates six events.
- Ignoring statistical significance. 2 conversions out of 40 is 5%, but the confidence interval spans roughly 1% to 17%. You need a few hundred trials per variant before an A/B result means anything. Optimizing on 40-visitor samples is how teams ship changes that do nothing.
- Excluding the cost side. A 6% conversion rate at $400 per lead loses to a 2% rate at $60. Conversion rate is an input to CAC, not a goal by itself.
- Never re-baselining. Definitions drift as tooling changes. Re-derive your rates from raw data once a quarter and reconcile against the dashboard.
How do you improve a conversion rate you've measured correctly?#
Fix the stage with the worst step rate, not the stage that's easiest to change.
If the leak is at the top — few replies, low form fills — the problem is almost always targeting or data quality, not copy. Tighten the ICP definition before you rewrite a single subject line. Pull cleaner contacts, add firmographic filters, and use data enrichment to fill in the fields your qualification logic actually depends on.
If the leak is mid-funnel — replies that never become meetings — the problem is follow-up speed and offer clarity. Measure time-to-first-response in minutes, not days.
If the leak is at the bottom — opportunities that stall — it's usually qualification. You're converting well at the top precisely because you're letting in prospects who were never going to buy. Raising the bar upstream will lower your top-of-funnel rate and raise revenue, which is why optimizing a single conversion rate in isolation is a trap. Track the full chain and let the cumulative rate arbitrate.
One practical habit: before every campaign, write down the exact formula you'll use to judge it. Numerator, denominator, window. Do it before you see results and you remove the temptation to pick the flattering denominator after the fact.
Where should you start?#
Start with the denominator you can trust. Most conversion-rate arguments are really data-quality arguments in disguise — you can't compute a defensible rate on a list where a fifth of the addresses don't exist.
Build your denominator from contacts you sourced and verified yourself. The Tomba Email Finder pulls current professional emails by domain, name, or company, with verification built into the same workflow — so the number you divide by reflects real people who could actually convert. The free tier gives you 25 searches a month to validate the approach on a small segment; paid plans start at $49/mo with Growth at $99/mo. Full Tomba pricing breaks down credits per tier.
Clean the denominator first. The formula was never the hard part.
Related guides#
Ready to find emails that actually work?
Join 150,000+ professionals who stopped guessing and started sending. Free credits on signup — no credit card required.
Get the Tomba newsletter
Practical outbound tactics and product updates — once every two weeks.
About the author