How Many Sales Reps Do I Need? A 2026 Capacity Model
Most teams size their sales headcount from gut feel and end up over-hired and under-piped. Here is the quota, ramp, and pipeline math that tells you exactly how many reps your 2026 number actually requires.
TL;DR
- Start from the number, not the org chart: divide your net-new revenue target by effective quota (quota × realistic attainment), not by quota on paper.
- Then apply a ramp factor. A rep hired in June does not deliver a full year of capacity, and ignoring that is the single most common headcount error.
- Cross-check with pipeline math. If your capacity model says 13 reps but your lead engine only produces enough opportunities for 8, you are hiring a bench, not a team.
- Ratios like 1 SDR per 2 AEs are outputs of the model, not inputs. Copying a competitor's ratio imports their conversion rates, which you do not have.
- Before adding a body, check whether the constraint is people or data. A rep who spends 11 hours a week chasing bad contact records is a capacity problem you can fix for less than a salary.
What does "how many sales reps do I need" actually mean?#
The question is almost always asked backwards. Founders and VPs ask "how many reps do I need" when what they mean is "how much selling capacity do I need, and how much of it has to come from headcount?"
Those are different questions with different answers. Capacity is the total amount of qualified opportunity a team can work and close in a period. Headcount is one way to buy capacity. Better data, tighter territories, higher win rates, and shorter cycles are the others — and they are usually cheaper.
So the honest version of the question is: given my revenue target, my average deal size, my win rate, and my ramp time, what is the minimum number of quota-carrying bodies that gets me there without leaving a third of them starved for pipeline?
That is a math problem, and it has three steps.
What inputs do you need before you can size a sales team?#
You cannot run the model without these six numbers. If you are guessing at more than two of them, stop and pull the data first — a capacity model built on fiction produces confident, expensive nonsense.
- Net-new revenue target. New logo plus expansion ARR for the period. Exclude renewals unless a quota-carrier owns them.
- Average contract value (ACV). Use the median of the last 12 months of closed-won, not your aspirational enterprise deal.
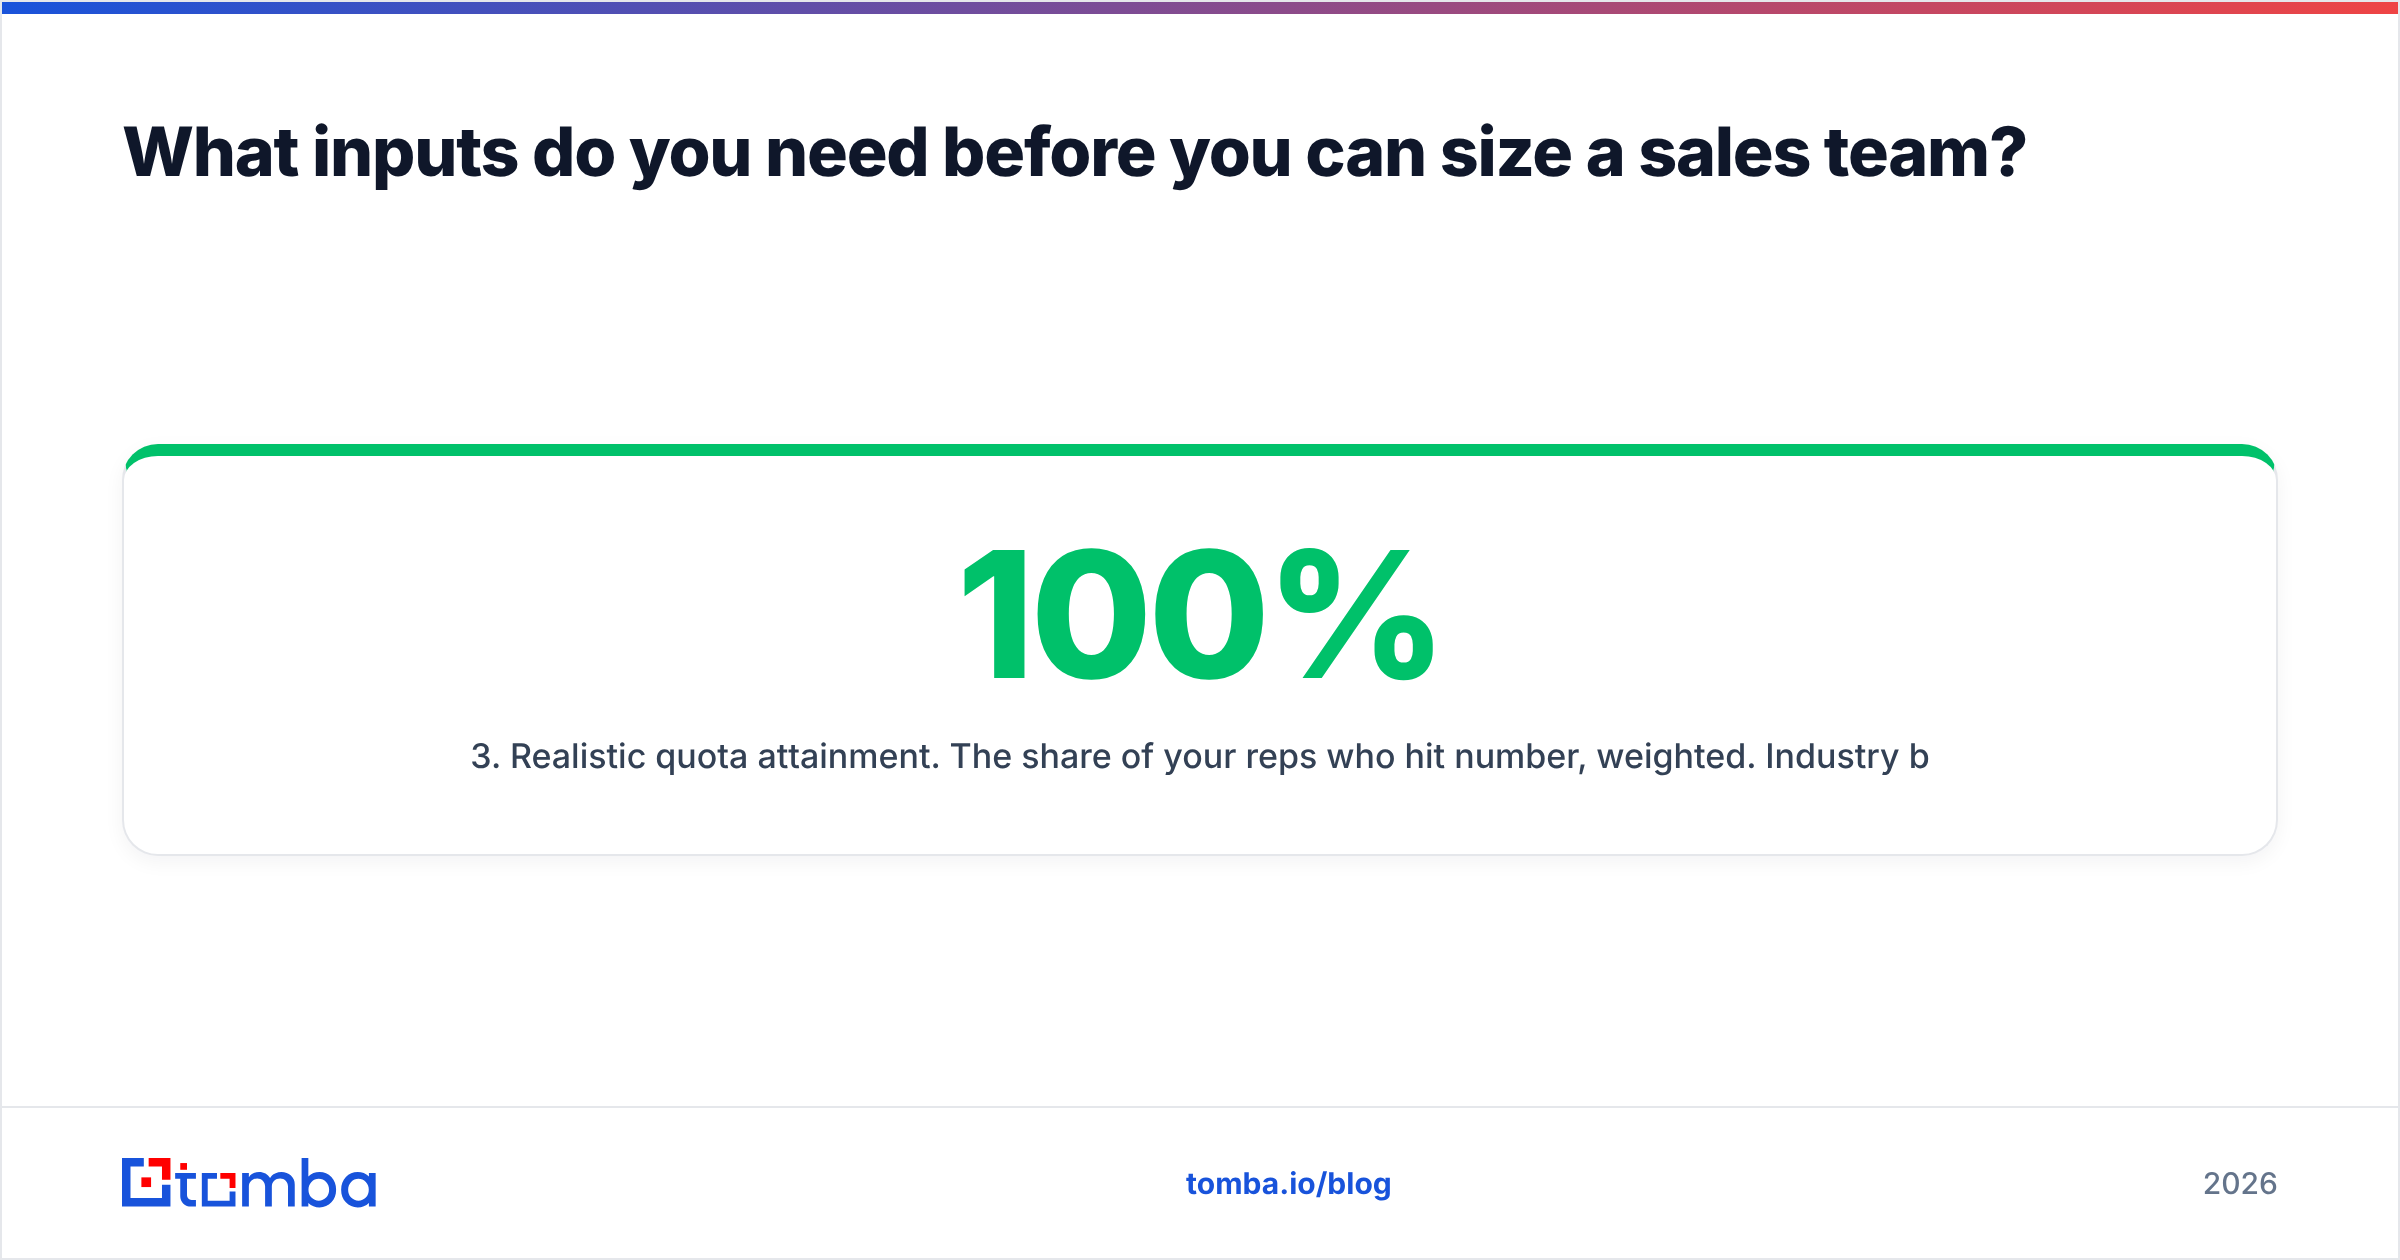
- Realistic quota attainment. The share of your reps who hit number, weighted. Industry benchmarks hover well under 100% — Salesforce's State of Sales research has consistently found a large minority of reps missing quota entirely. Plan for 65–75%, not 100%.
- Win rate from qualified opportunity. Stage-2-to-closed-won. If you do not track this cleanly, your model's error bars are wider than its answer. See how win rate is defined if your team measures it three different ways.
- Sales cycle length. Determines how much of a rep's year is actually harvestable and how early pipeline must be built.
- Ramp time to full productivity. Typically 3–6 months for mid-market SaaS, 6–9 for enterprise.

How do you calculate how many sales reps you need?#
Work it in three passes. Here is a worked example for a company targeting $6M in net-new ARR in 2026.
Pass 1 — Quota capacity.
- AE quota on paper: $700,000
- Expected attainment: 70%
- Effective capacity per fully ramped AE: $490,000
- Reps required: $6,000,000 ÷ $490,000 = 12.2 → 13 fully ramped AEs
Pass 2 — Ramp adjustment.
Nobody starts fully ramped. If you have 8 tenured reps today and need 13 units of ramped capacity, the 5 new hires deliver only partial output in their first year. With a four-month ramp at 0% / 30% / 60% / 100% productivity by month, a rep hired in January delivers roughly 78% of a full year. A rep hired in July delivers about 35%.
To net 5 units of ramped capacity across the year, you need to hire closer to 8 heads, front-loaded into Q1. Hiring the same 5 in Q3 buys you roughly 1.7 units of 2026 capacity and a full year of 2027 payroll.
Pass 3 — Pipeline reality check.
- Deals needed: $6,000,000 ÷ $24,000 ACV = 250 closed-won
- At a 25% win rate: 1,000 qualified opportunities
- At 3x coverage: $18M of pipeline created in-period
- Per-AE opportunity throughput: ~80 well-worked opps per year
1,000 ÷ 80 = 12.5 AEs. The two methods converge on 12–13. When they don't converge, the smaller number is your real answer, because the constraint binds before the capacity does.
What's the difference between quota capacity and pipeline capacity?#
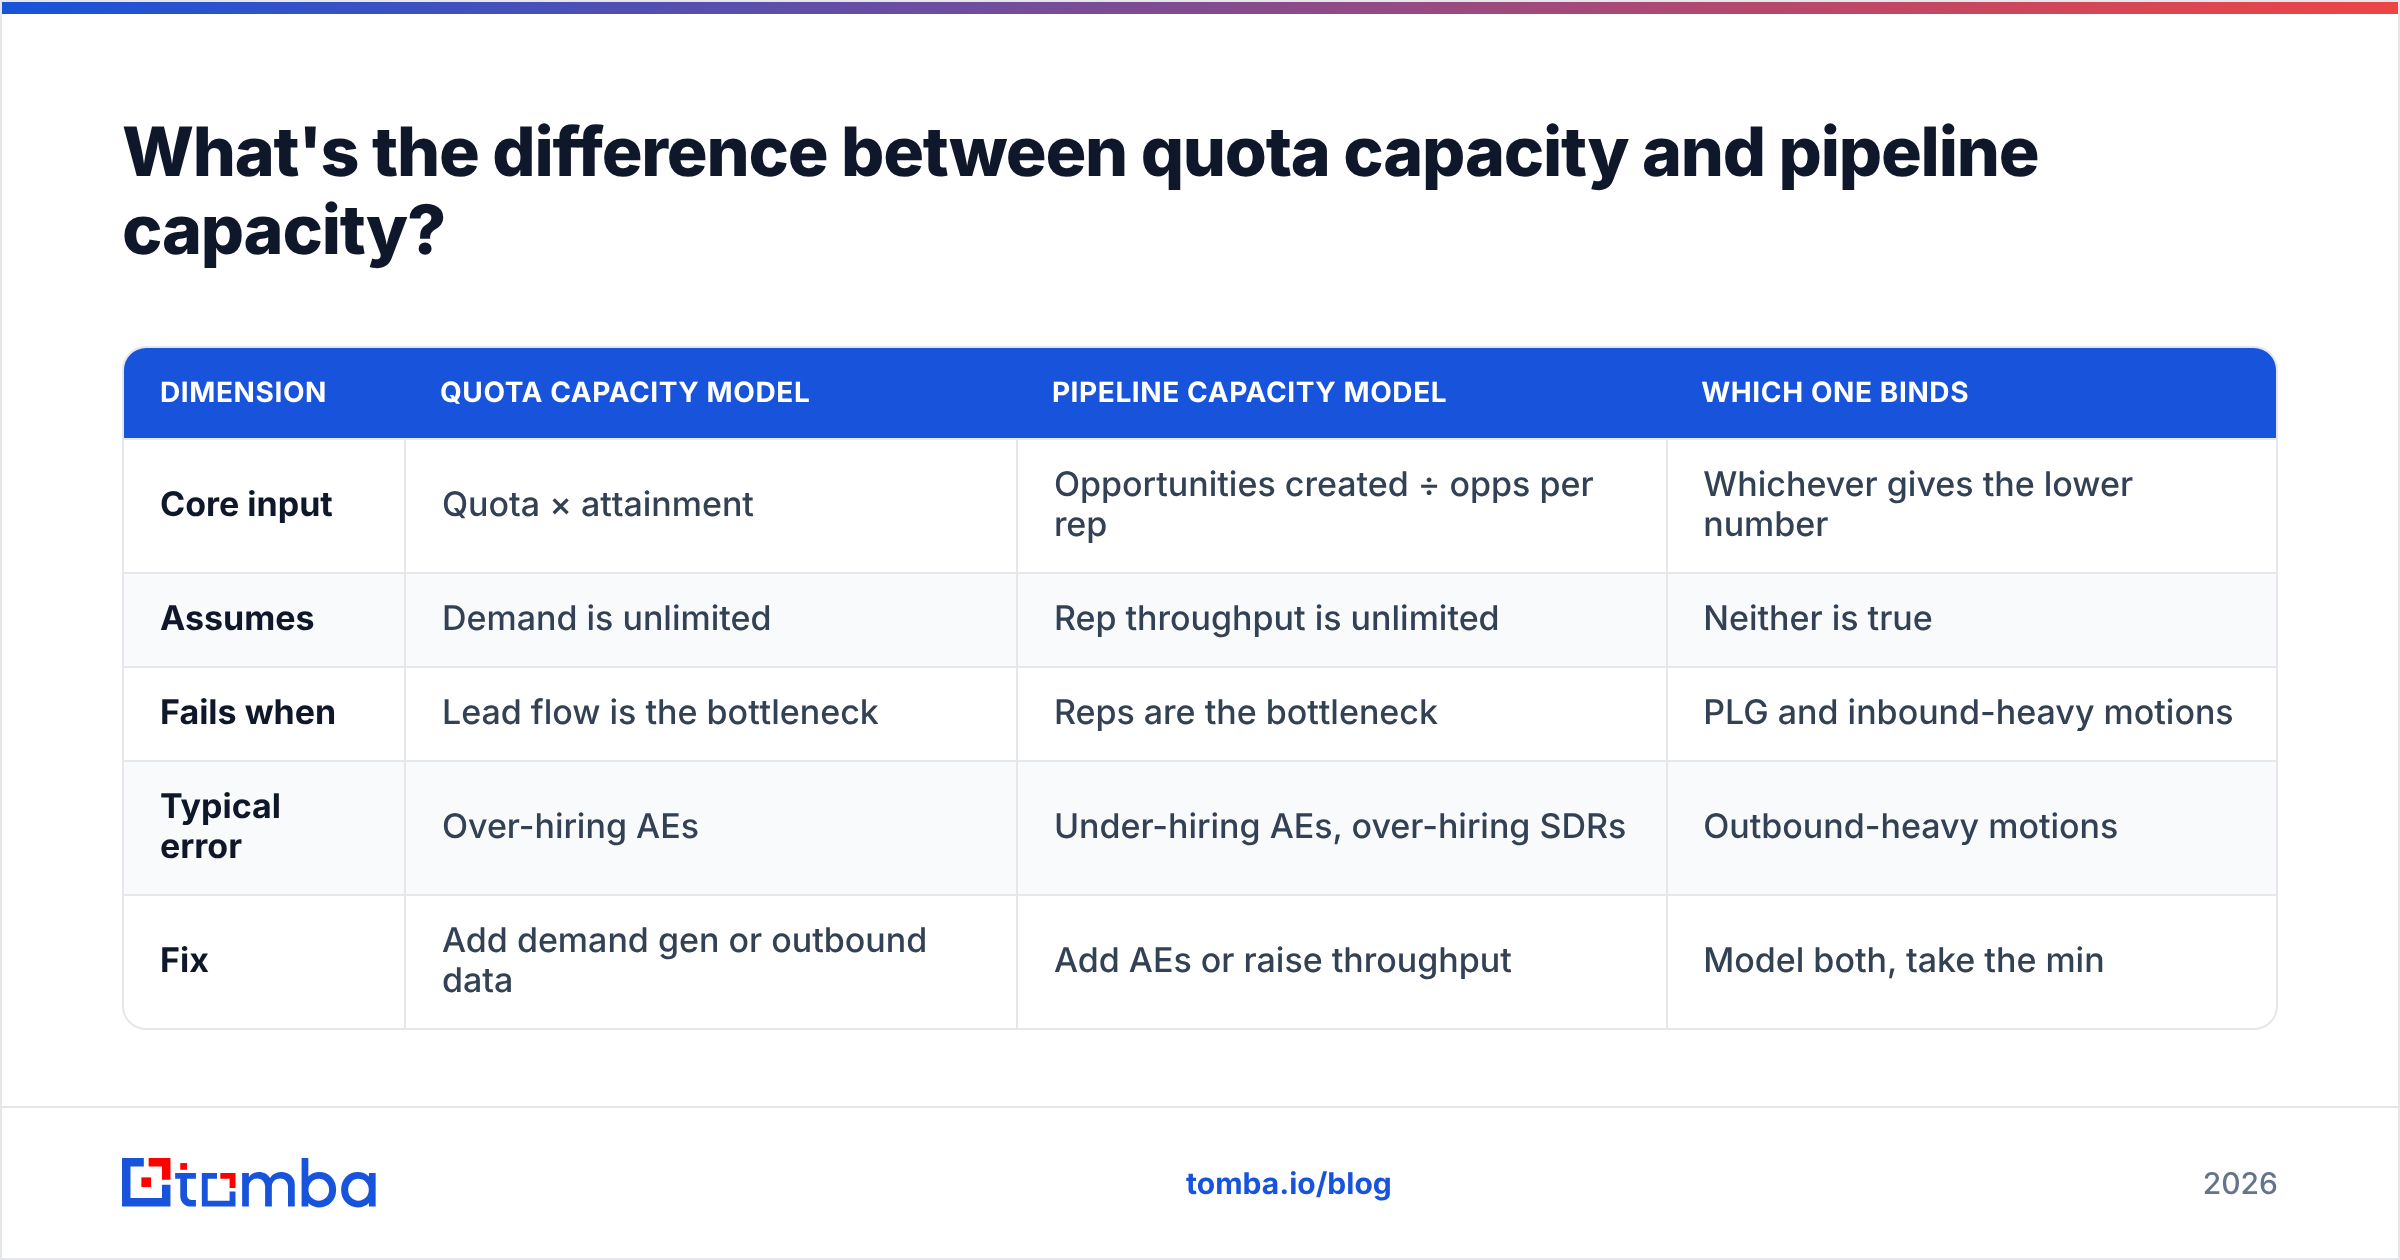
Quota capacity asks how much a rep can close. Pipeline capacity asks how much they will be given to close. Teams that model only the first hire people who then sit idle.
| Dimension | Quota capacity model | Pipeline capacity model | Which one binds |
|---|---|---|---|
| Core input | Quota × attainment | Opportunities created ÷ opps per rep | Whichever gives the lower number |
| Assumes | Demand is unlimited | Rep throughput is unlimited | Neither is true |
| Fails when | Lead flow is the bottleneck | Reps are the bottleneck | PLG and inbound-heavy motions |
| Typical error | Over-hiring AEs | Under-hiring AEs, over-hiring SDRs | Outbound-heavy motions |
| Fix | Add demand gen or outbound data | Add AEs or raise throughput | Model both, take the min |
Run both. The gap between them is your actual investment decision: if pipeline capacity is the smaller number, your next dollar goes to demand generation and contact data, not to a recruiter.
How many SDRs do you need per AE?#
Derive it, don't copy it. The commonly cited 1:2 or 1:3 SDR-to-AE ratio is a result of a specific set of conversion rates, and importing it wholesale means importing assumptions that may not be yours.
Using the same example:
- Outbound share of the 1,000 required opportunities: 60% = 600 opps
- Meetings booked per SDR per month: 12
- Meeting-to-qualified-opportunity rate: 60%
- Annual opportunities per ramped SDR: 12 × 12 × 0.6 = 86
- SDRs required: 600 ÷ 86 = 7
Seven SDRs against 13 AEs is roughly 1:2. But move the meeting-to-opp rate from 60% to 40% — which is what happens when your contact data is stale and half your "meetings" are with people who left the company — and you need 10.4 SDRs for the same output. That is three extra salaries paid to compensate for a database problem.
This is where most headcount plans quietly leak money. Before you approve the tenth SDR, check what share of their outbound list actually resolves to a valid, current mailbox. A bulk email verifier pass across a 20,000-row list takes minutes and routinely removes 15–25% of records that would otherwise consume rep hours and burn sending reputation.
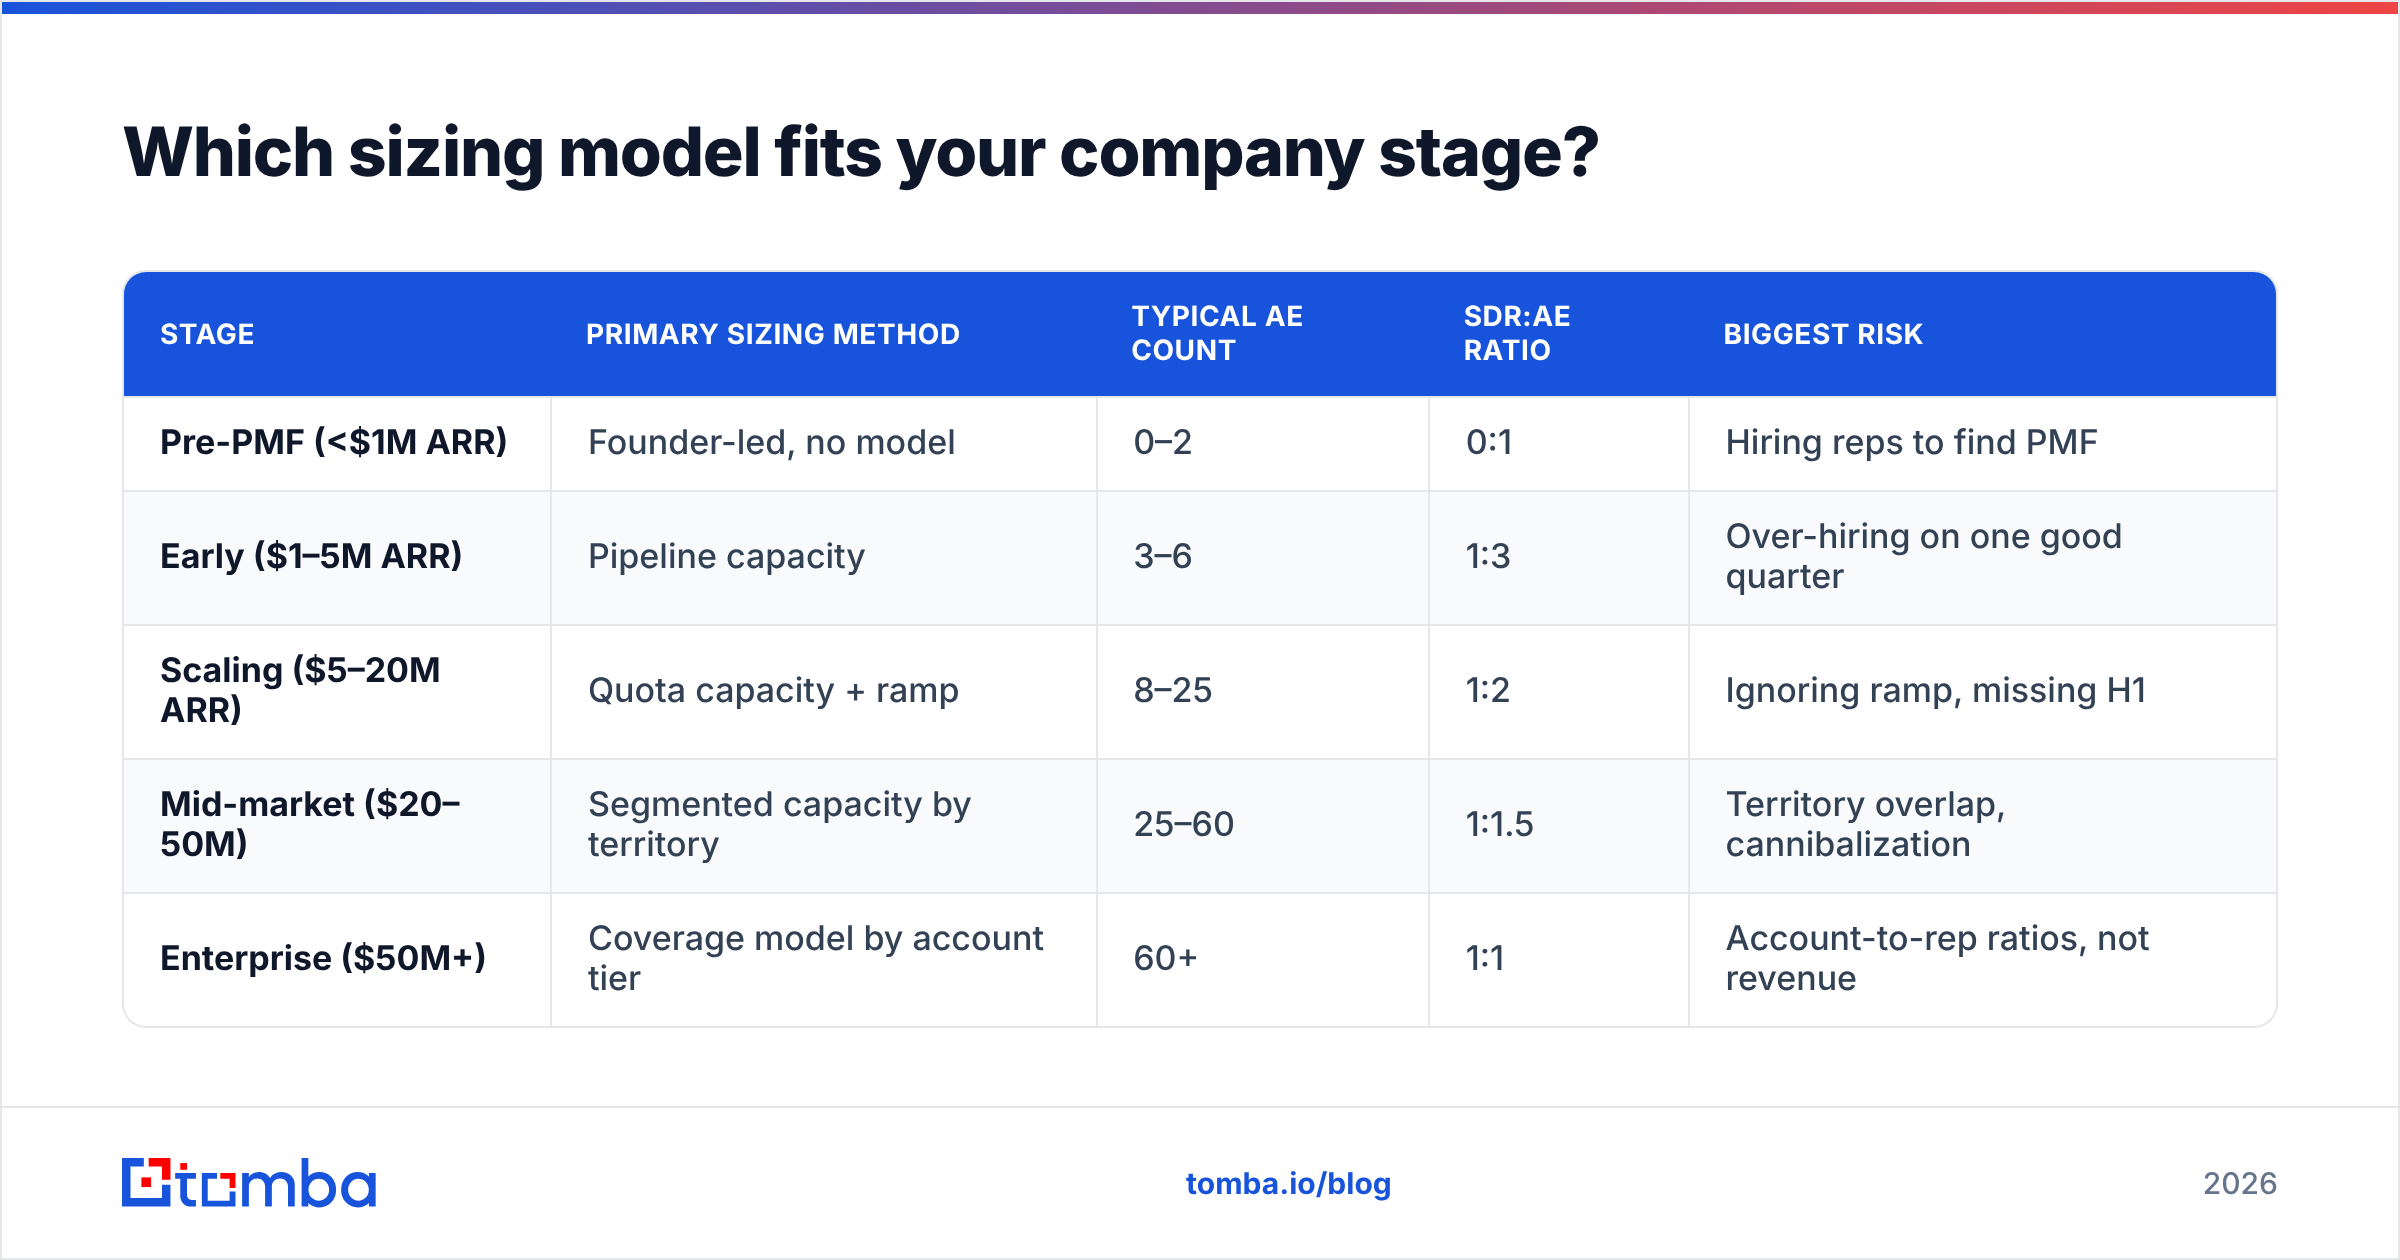
Which sizing model fits your company stage?#
| Stage | Primary sizing method | Typical AE count | SDR:AE ratio | Biggest risk |
|---|---|---|---|---|
| Pre-PMF (<$1M ARR) | Founder-led, no model | 0–2 | 0:1 | Hiring reps to find PMF |
| Early ($1–5M ARR) | Pipeline capacity | 3–6 | 1:3 | Over-hiring on one good quarter |
| Scaling ($5–20M ARR) | Quota capacity + ramp | 8–25 | 1:2 | Ignoring ramp, missing H1 |
| Mid-market ($20–50M) | Segmented capacity by territory | 25–60 | 1:1.5 | Territory overlap, cannibalization |
| Enterprise ($50M+) | Coverage model by account tier | 60+ | 1:1 | Account-to-rep ratios, not revenue |
Note the shift at the bottom of the table. Enterprise teams stop sizing on revenue and start sizing on coverage — how many named accounts one rep can credibly touch in a quarter, usually 30–50 for strategic and 80–150 for mid-market. Gartner's sales practice research is a reasonable starting point for tier definitions if you are building this for the first time.
What does ramp time really cost you?#
Ramp is the tax nobody budgets for. A $180,000 fully loaded AE who ramps over five months costs you roughly $75,000 in salary before producing their first meaningful dollar, and delivers 60–75% of annual quota capacity in year one at best.

Three practical consequences:
- Hire in cohorts, not in dribs. Onboarding four reps together costs barely more manager time than onboarding one, and cohorts ramp faster because they learn from each other.
- Front-load the year. Every month you delay a Q1 hire removes roughly 8% of that rep's annual contribution. A hiring plan approved in April for a January-planned number is already short.
- Backfill is not free capacity. If you expect 20% attrition on a 13-person team, you need to hire ~16 people to hold 13, and each replacement restarts the ramp clock.
If your model shows you need reps producing in Q2, recruiting has to start now. That is a data problem too — sourcing hiring managers and heads of sales at target companies is the same motion as sourcing buyers, and a domain search across a shortlist of competitors will surface the org structure faster than scrolling LinkedIn.
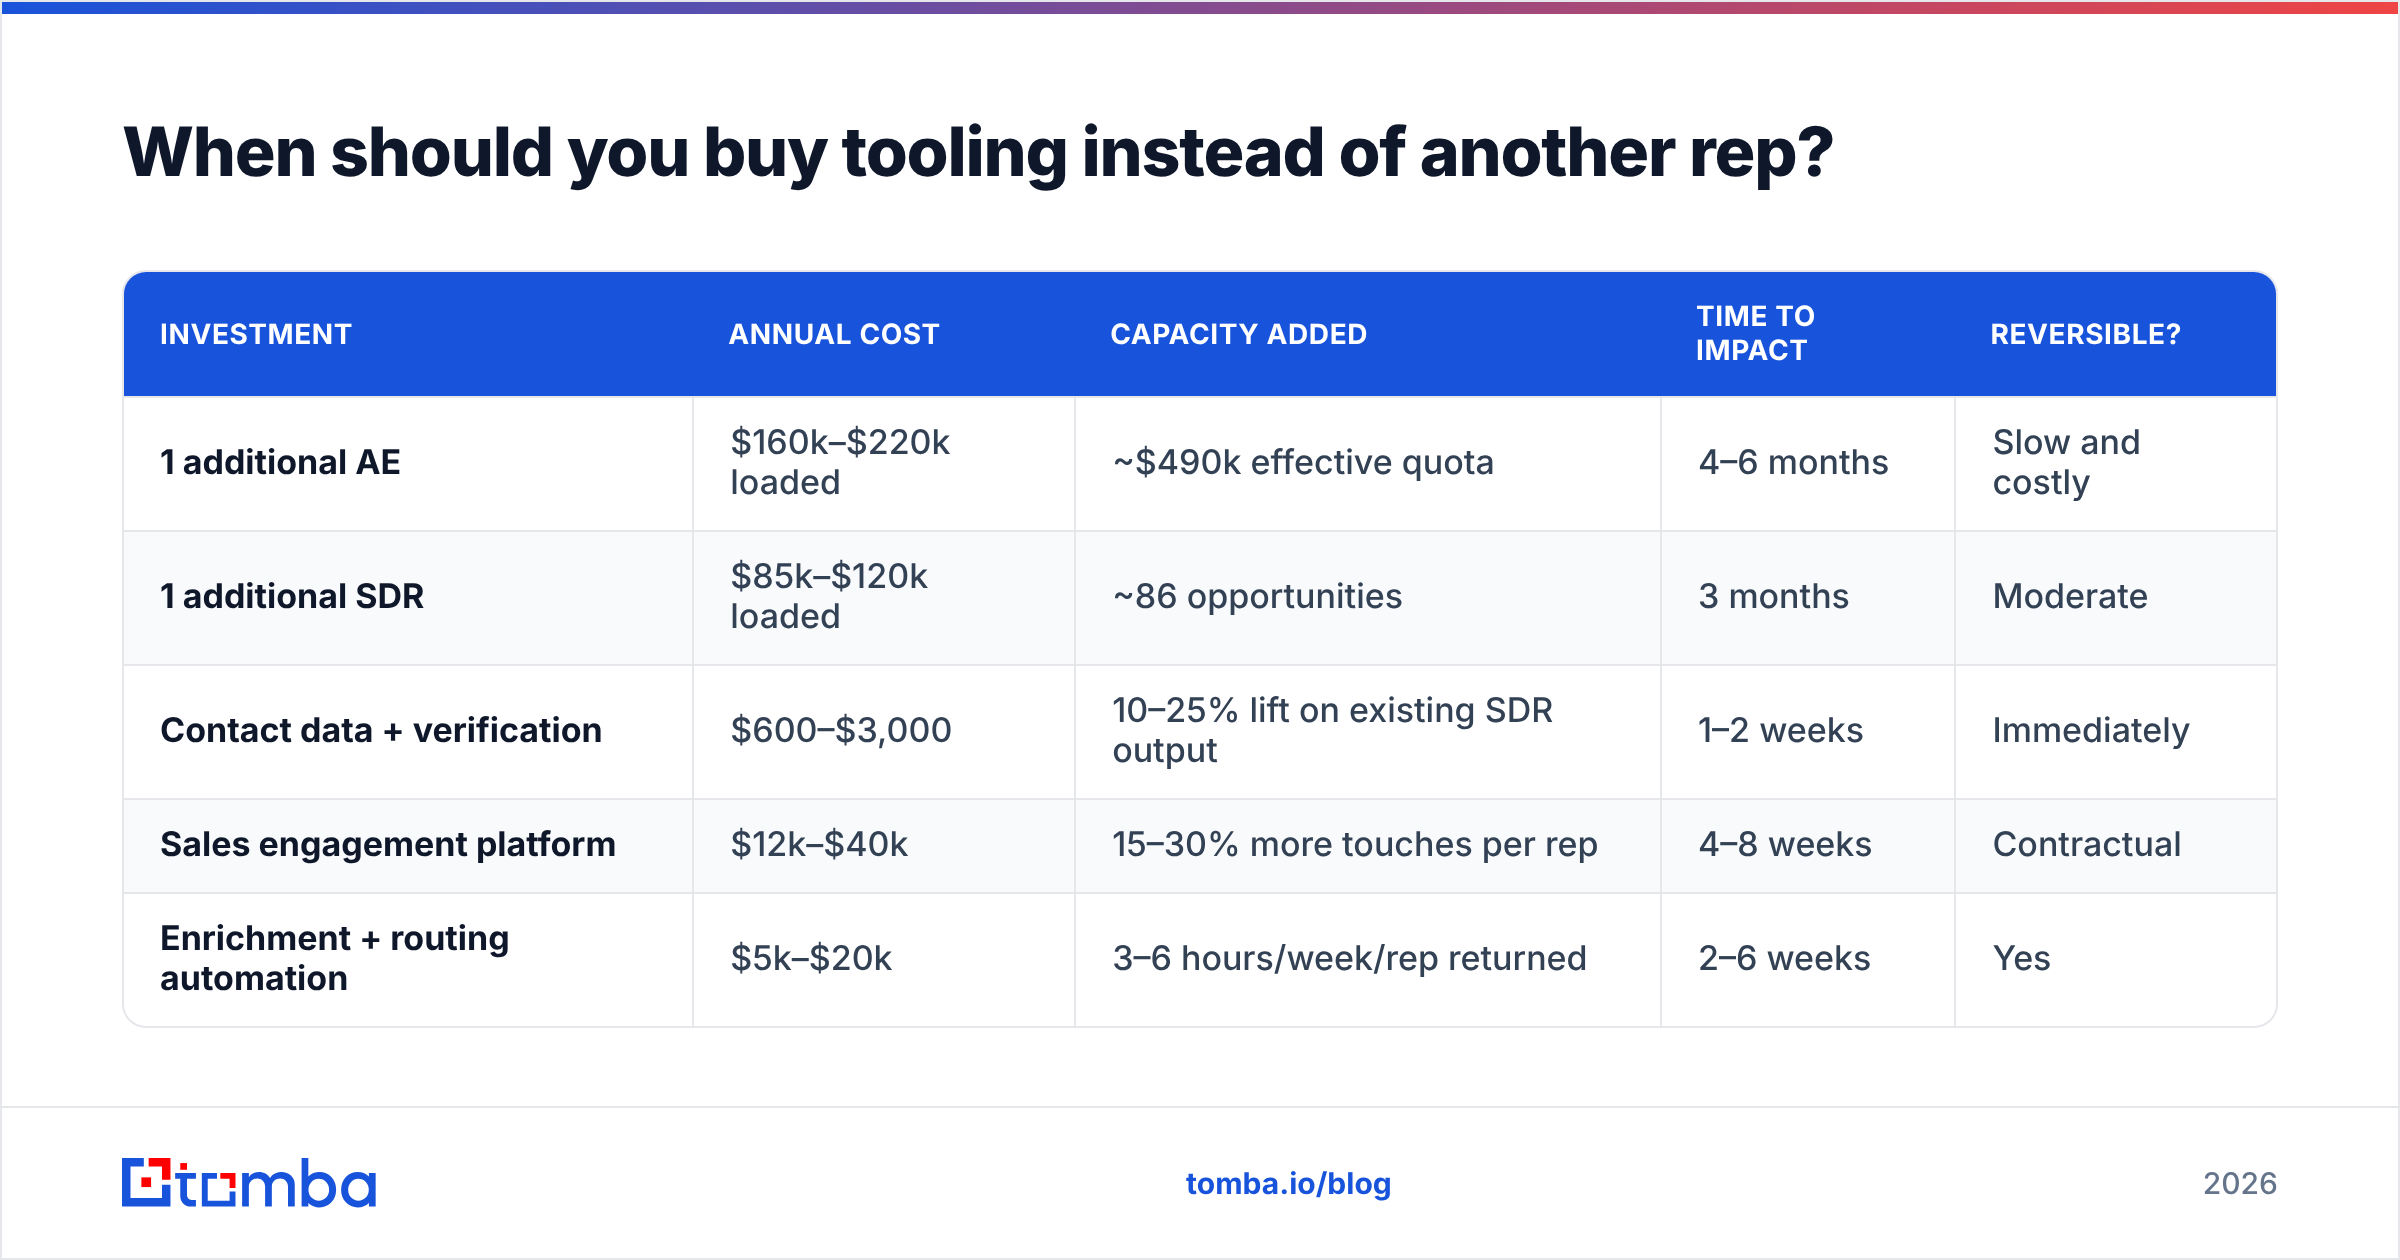
When should you buy tooling instead of another rep?#
Compare marginal capacity per dollar. This is the calculation most teams skip.
| Investment | Annual cost | Capacity added | Time to impact | Reversible? |
|---|---|---|---|---|
| 1 additional AE | $160k–$220k loaded | ~$490k effective quota | 4–6 months | Slow and costly |
| 1 additional SDR | $85k–$120k loaded | ~86 opportunities | 3 months | Moderate |
| Contact data + verification | $600–$3,000 | 10–25% lift on existing SDR output | 1–2 weeks | Immediately |
| Sales engagement platform | $12k–$40k | 15–30% more touches per rep | 4–8 weeks | Contractual |
| Enrichment + routing automation | $5k–$20k | 3–6 hours/week/rep returned | 2–6 weeks | Yes |
The pattern is consistent: data and workflow spend has a far shorter payback window than headcount, and it raises the denominator in your capacity model. If verified contact data lifts your meeting-to-opportunity rate from 40% to 55%, you just removed two SDR hires from the plan and paid for it with a rounding error. HubSpot's sales research library is worth a look for benchmark conversion data if you want an outside reference point on where your rates sit.
That is not an argument against hiring. It is an argument for hiring after you have removed the obvious friction, so each new rep inherits a working system rather than an expensive one.
What are the signs you hired too many reps?#
Watch for these four, in this order:
- Pipeline per rep is falling while total pipeline is flat. You added bodies without adding demand. Classic over-hire.
- Attainment distribution is bimodal. Two reps hit 140% and six hit 45%. That is territory or lead-distribution failure, not a talent problem.
- Activity per rep is climbing but response rate is falling. More reps are hitting the same finite list harder. You need more addressable contacts, not more senders.
- Manager span exceeds 8 direct reports. Coaching quality collapses past that point, and ramp times stretch, which quietly invalidates your original model.
If two or more of these are true, freeze hiring and re-run the pipeline capacity pass. In most cases the corrective action is fixing lead flow and data coverage, then resuming hiring one quarter later at a smaller number.
What's the fastest way to sanity-check your number?#
Give yourself a 15-minute version:
- Take your target. Divide by effective quota. That is your ramped-AE requirement.
- Take your target. Divide by ACV, divide by win rate. That is your opportunity requirement.
- Divide the opportunity requirement by what your demand engine actually produced last year. If the ratio is above 1.3, your plan requires a demand miracle.
- Add 20–25% to the hire count for ramp and attrition, and front-load it.
If those four lines disagree with the headcount in your board deck by more than 20%, the deck is wrong. Peer reviews on G2's sales tooling categories will tell you what other teams are stacking to close that gap, but the arithmetic above tells you whether you have a people problem or a pipeline problem — and that distinction is worth more than any tool.
Where does contact data fit into the headcount plan?#
Every model above has one hidden variable: how many reachable buyers exist in your addressable market. A capacity model that assumes 1,000 qualified opportunities is silently assuming you can identify and contact roughly 20,000–40,000 real people. If your list is 60% guesswork, no headcount number saves the plan.
Fix the denominator before you fund the numerator. Tomba's Email Finder resolves verified, current work addresses by name and domain so the reps you do hire spend their ramp learning your product instead of bouncing emails. Start on the free tier at 25 searches a month to test coverage against your ICP list, then scale to Starter at $49/mo or Growth at $99/mo once the model tells you how many seats you actually need — full Tomba pricing is public, so it slots straight into the cost-per-capacity table above. Size the team from the math, then give that team data worth working.
Related guides#
Ready to find emails that actually work?
Join 150,000+ professionals who stopped guessing and started sending. Free credits on signup — no credit card required.
Get the Tomba newsletter
Practical outbound tactics and product updates — once every two weeks.
About the author