How To Analyze Firmographic Data: A 2026 GTM Playbook
Most teams collect firmographic data and never analyze it. Here is the seven-step process for turning company size, industry, and revenue fields into an ICP that actually predicts revenue.
TL;DR — how to analyze firmographic data
- Learning how to analyze firmographic data is not a reporting exercise. You are looking for the company attributes that separate your closed-won accounts from your closed-lost ones. Then you use those attributes to filter, score, and route.
- Start by auditing field completeness. Most CRMs have 40-60% fill rates on employee count and industry. That one gap makes every segment cut downstream wrong.
- Run the win-rate-by-segment cut first: revenue band, headcount band, industry, geography, tech stack. Anything with under 30 closed opportunities is noise, not a signal.
- Build a weighted score from the three or four attributes that actually correlate. Leave out the other twelve fields you happen to store.
- Refresh quarterly. Firmographics decay at roughly 25-30% per year through headcount changes, funding, M&A, and rebrands.
What is firmographic data, exactly?#
Firmographic data is demographic data for companies. B2C marketers segment by age, income, and location. B2B teams use the company-level version of those traits. Think industry, employee count, annual revenue, head office, ownership, growth stage, and the tech a company already runs.
Think of it like sorting a warehouse. Demographics tell you who is walking the aisles. Firmographics tell you the shape and weight of each box. You cannot design the picking process until you know which boxes you are handling.
The core fields most teams work with:
- Industry / vertical — usually NAICS, SIC, or a proprietary taxonomy. It is the messiest field you own. "Software," "SaaS," and "Information Technology" often describe the same account across three sources.
- Employee count — the single most predictive field for most B2B products. It stands in for budget, process complexity, and the size of the buying committee.
- Annual revenue — hard to source for private companies. It is often modeled rather than reported.
- Geography — head office country or region, plus office footprint. It drives compliance, timezone routing, and language.
- Growth signals — funding rounds, headcount velocity, job postings, new office openings.
- Technographics — what they already run. It is a separate category on paper, but nobody analyzes firmographics without it anymore.
One thing separates a team that has firmographic data from a team that uses it: normalized fields. A field you cannot group by is a field you cannot analyze. That is why every honest guide on how to analyze firmographic data starts with cleanup, not with charts.

How do you audit firmographic data before analyzing it?#
Run the completeness audit first. Analysis on a 45%-complete field produces confident nonsense. The missing 55% is almost never missing at random. It skews toward smaller, newer, or non-US companies that your data vendor covers poorly.
Export every account record and compute four numbers per field:
- Fill rate — the share of records with any value at all.
- Distinct-value count — say "industry" holds 340 distinct values across 2,000 accounts. That is a normalization problem, not a taxonomy.
- Staleness — the median age of the last enrichment timestamp. Treat anything past 12 months as unverified.
- Cross-source agreement — where two sources both fill in employee count, how often do they land in the same band? Under 70% agreement, you need a tiebreaker rule first.
Then normalize. Map every industry string to a single controlled vocabulary. Bucket headcount into bands instead of treating it as a raw number. The bands 1-10, 11-50, 51-200, 201-500, 501-1000, 1001-5000, 5000+ work for most GTM analysis. They also match how LinkedIn and most data vendors report. Raw employee counts create false precision. No one's win rate really differs between 187 and 203 employees.
Fill the gaps with enrichment rather than guesswork. A domain search against your account list recovers company attributes and contacts in the same pass. Data enrichment then backfills the fields your CRM never captured at form-submit time.
How to analyze firmographic data in seven steps#
Seven steps, in order. Each one gates the next.
Step 1 — Define the outcome variable. Pick one: closed-won rate, average contract value, time-to-close, or 12-month retention. Analyze one at a time. The profile that maximizes win rate is often not the profile that maximizes ACV. Blend the two and you get an ICP that optimizes nothing.
Step 2 — Cut win rate by single attribute. For each clean field, compute win rate per bucket alongside opportunity count. Sort descending. Ignore any bucket under 30 closed opportunities. Small-sample win rates swing wildly, and they will send you chasing a vertical you closed twice.
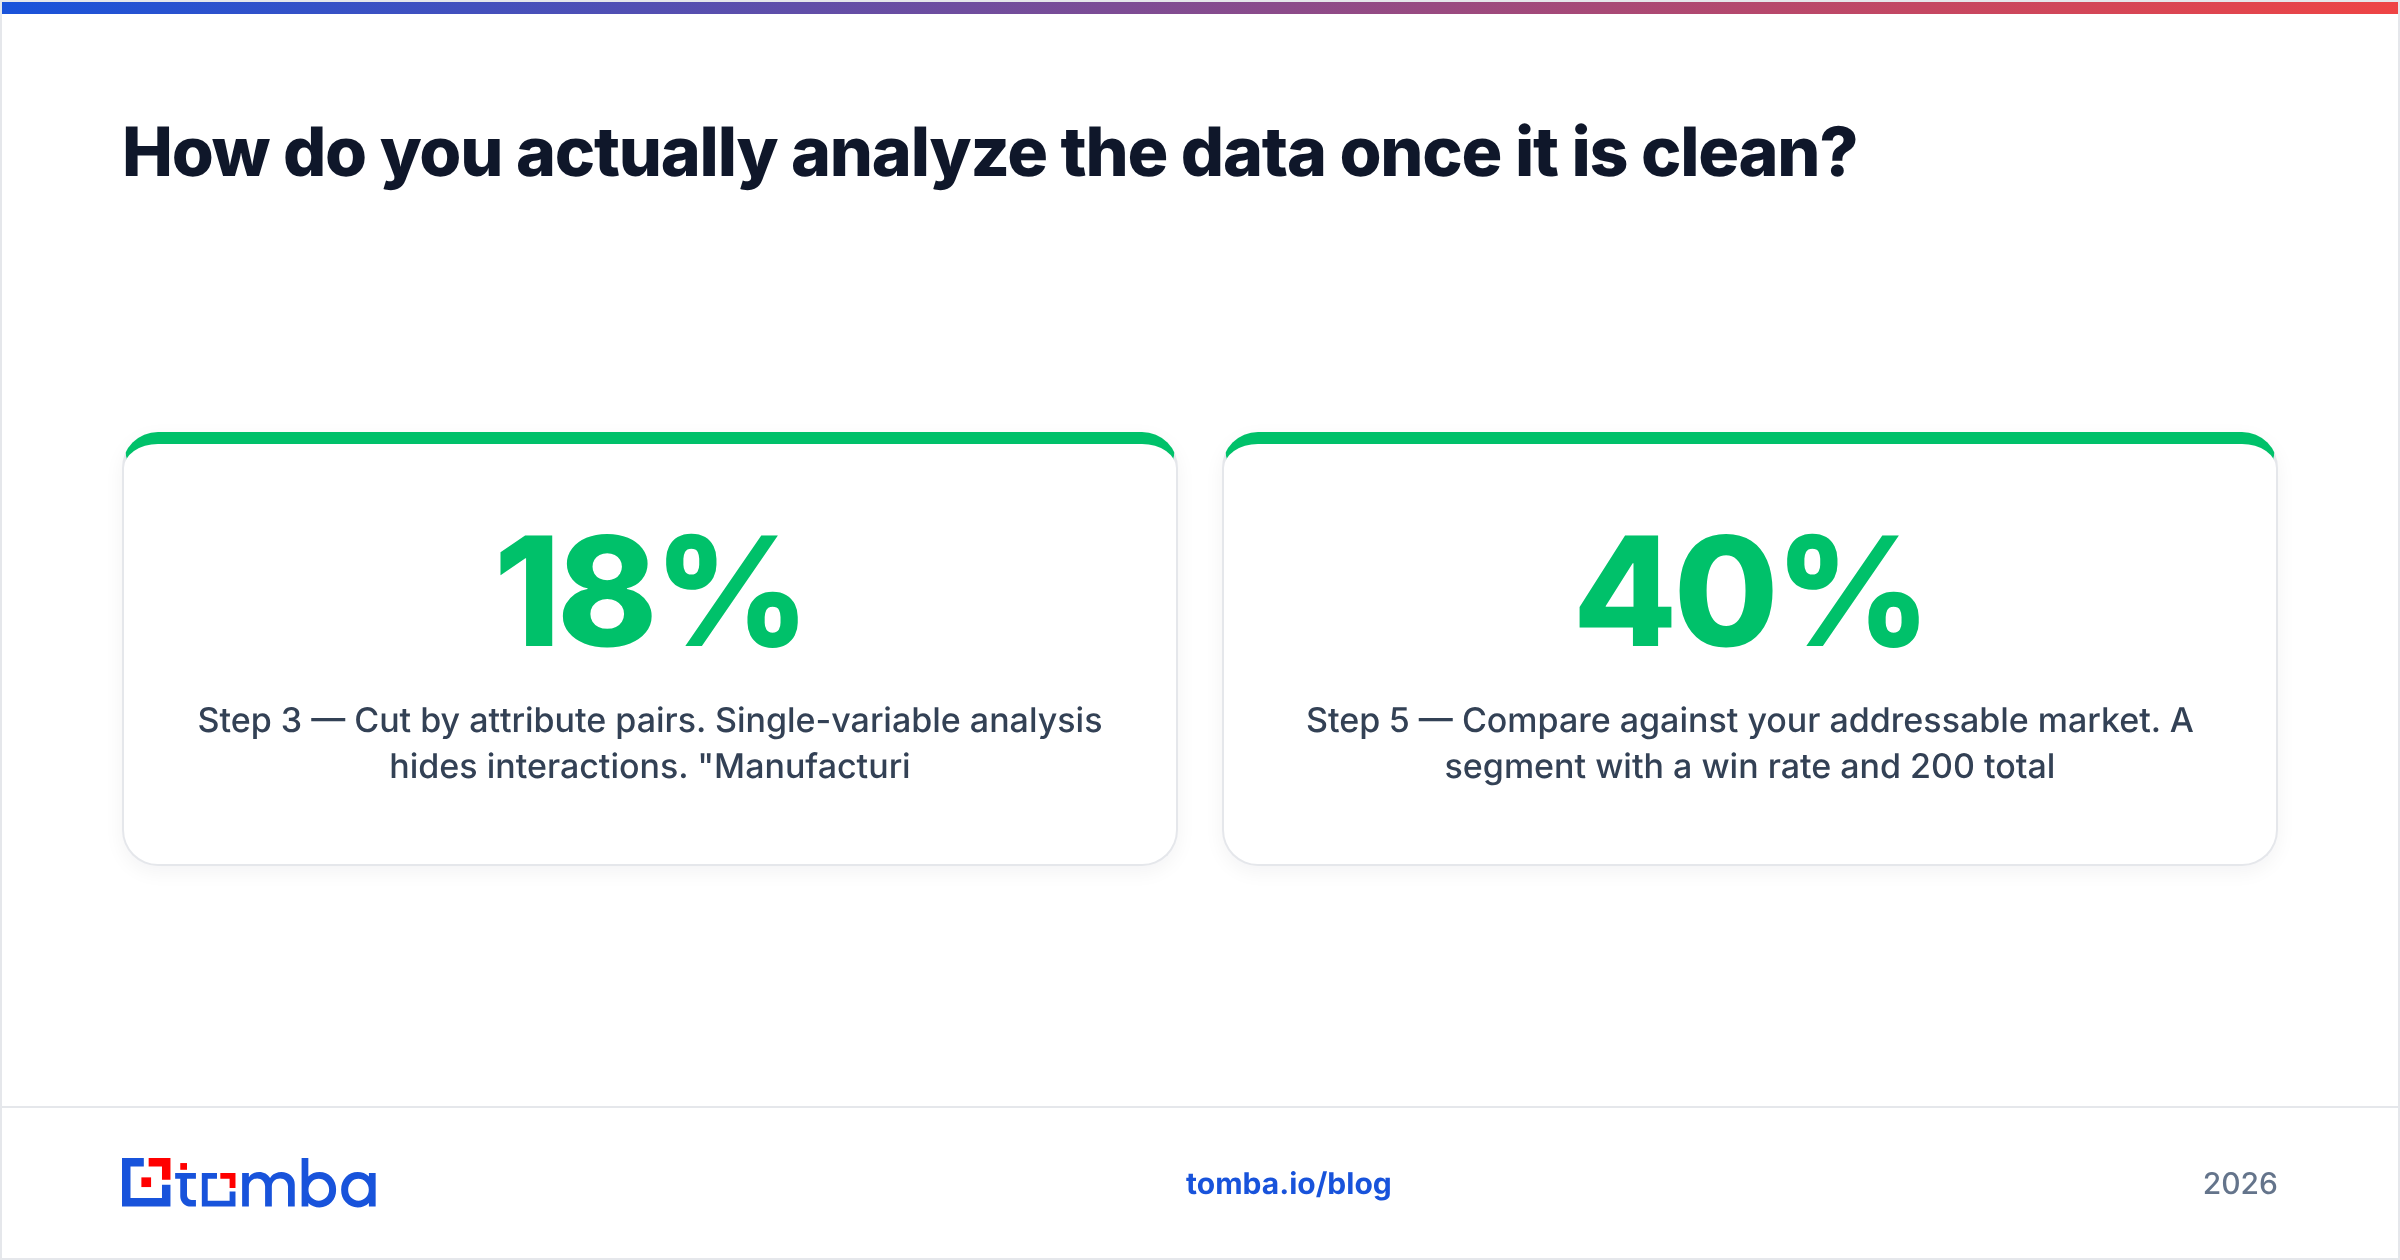
Step 3 — Cut by attribute pairs. Single-variable analysis hides interactions. "Manufacturing" may show a flat 18% win rate overall. But manufacturers with 200-1000 employees might sit at 34%, while shops under 50 employees sit at 6%. The pair is the insight. The single cut buried it.
Step 4 — Check the loss side. Run the same cuts on closed-lost deals and, above all, on churned accounts. Segments that close easily but churn in eight months are worse than segments you never sold. This is where most ICP work fails. It tunes the top of the funnel and ignores the exit.
Step 5 — Compare against your addressable market. A segment with a 40% win rate and 200 total companies worldwide is a nice anecdote, not a strategy. Multiply win rate by segment size by average deal value. That gives you expected segment revenue. Rank by it.
Step 6 — Build the score. Assign weights in proportion to the lift you observed, not to your gut. If headcount band explains most of the variance and geography explains almost none, weight them that way.
Step 7 — Operationalize. Push scores into the CRM as a field. Route the top tier to AEs, put the middle tier into nurture, and drop the bottom tier from paid acquisition.
Which firmographic attributes predict revenue best?#
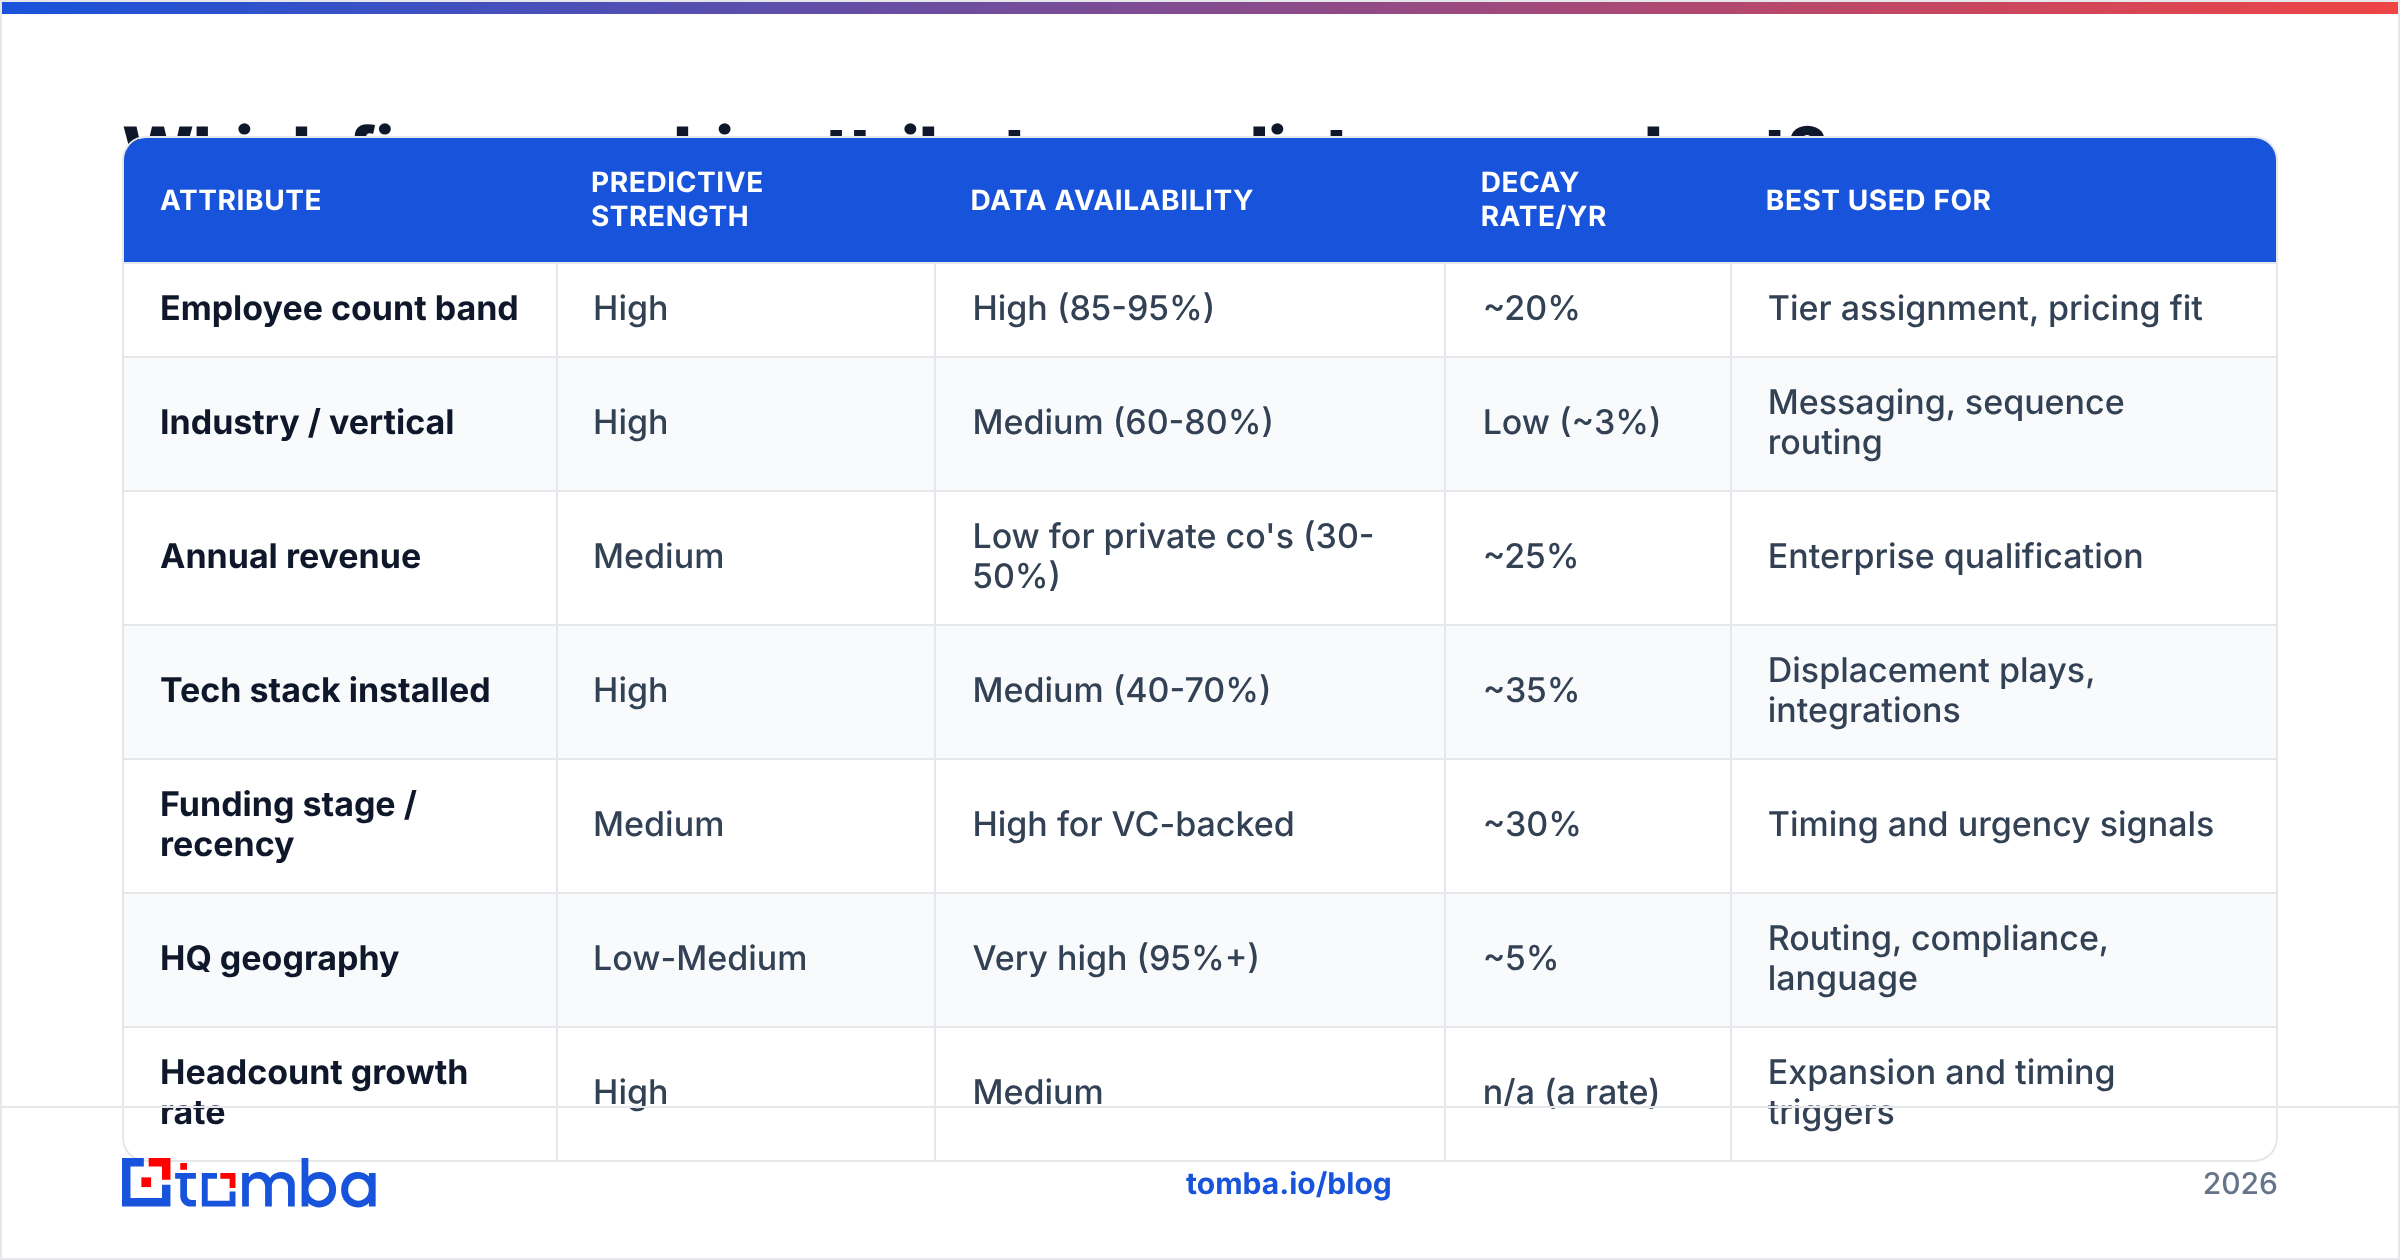
Here is how the common attributes tend to behave as predictors. Treat this as a starting hypothesis to test against your own data, not as a finding to copy.
| Attribute | Predictive strength | Data availability | Decay rate/yr | Best used for |
|---|---|---|---|---|
| Employee count band | High | High (85-95%) | ~20% | Tier assignment, pricing fit |
| Industry / vertical | High | Medium (60-80%) | Low (~3%) | Messaging, sequence routing |
| Annual revenue | Medium | Low for private co's (30-50%) | ~25% | Enterprise qualification |
| Tech stack installed | High | Medium (40-70%) | ~35% | Displacement plays, integrations |
| Funding stage / recency | Medium | High for VC-backed | ~30% | Timing and urgency signals |
| HQ geography | Low-Medium | Very high (95%+) | ~5% | Routing, compliance, language |
| Headcount growth rate | High | Medium | n/a (a rate) | Expansion and timing triggers |
Two patterns are worth noting. First, the fields that are easiest to get (geography) tend to be the weakest predictors. The strongest ones (tech stack, growth rate) are the hardest to source. That tension is the whole business model of the B2B data industry. Second, decay rate matters as much as accuracy on the day you buy. A revenue estimate that was right in January is often wrong by October.
What tools do you use for firmographic analysis?#
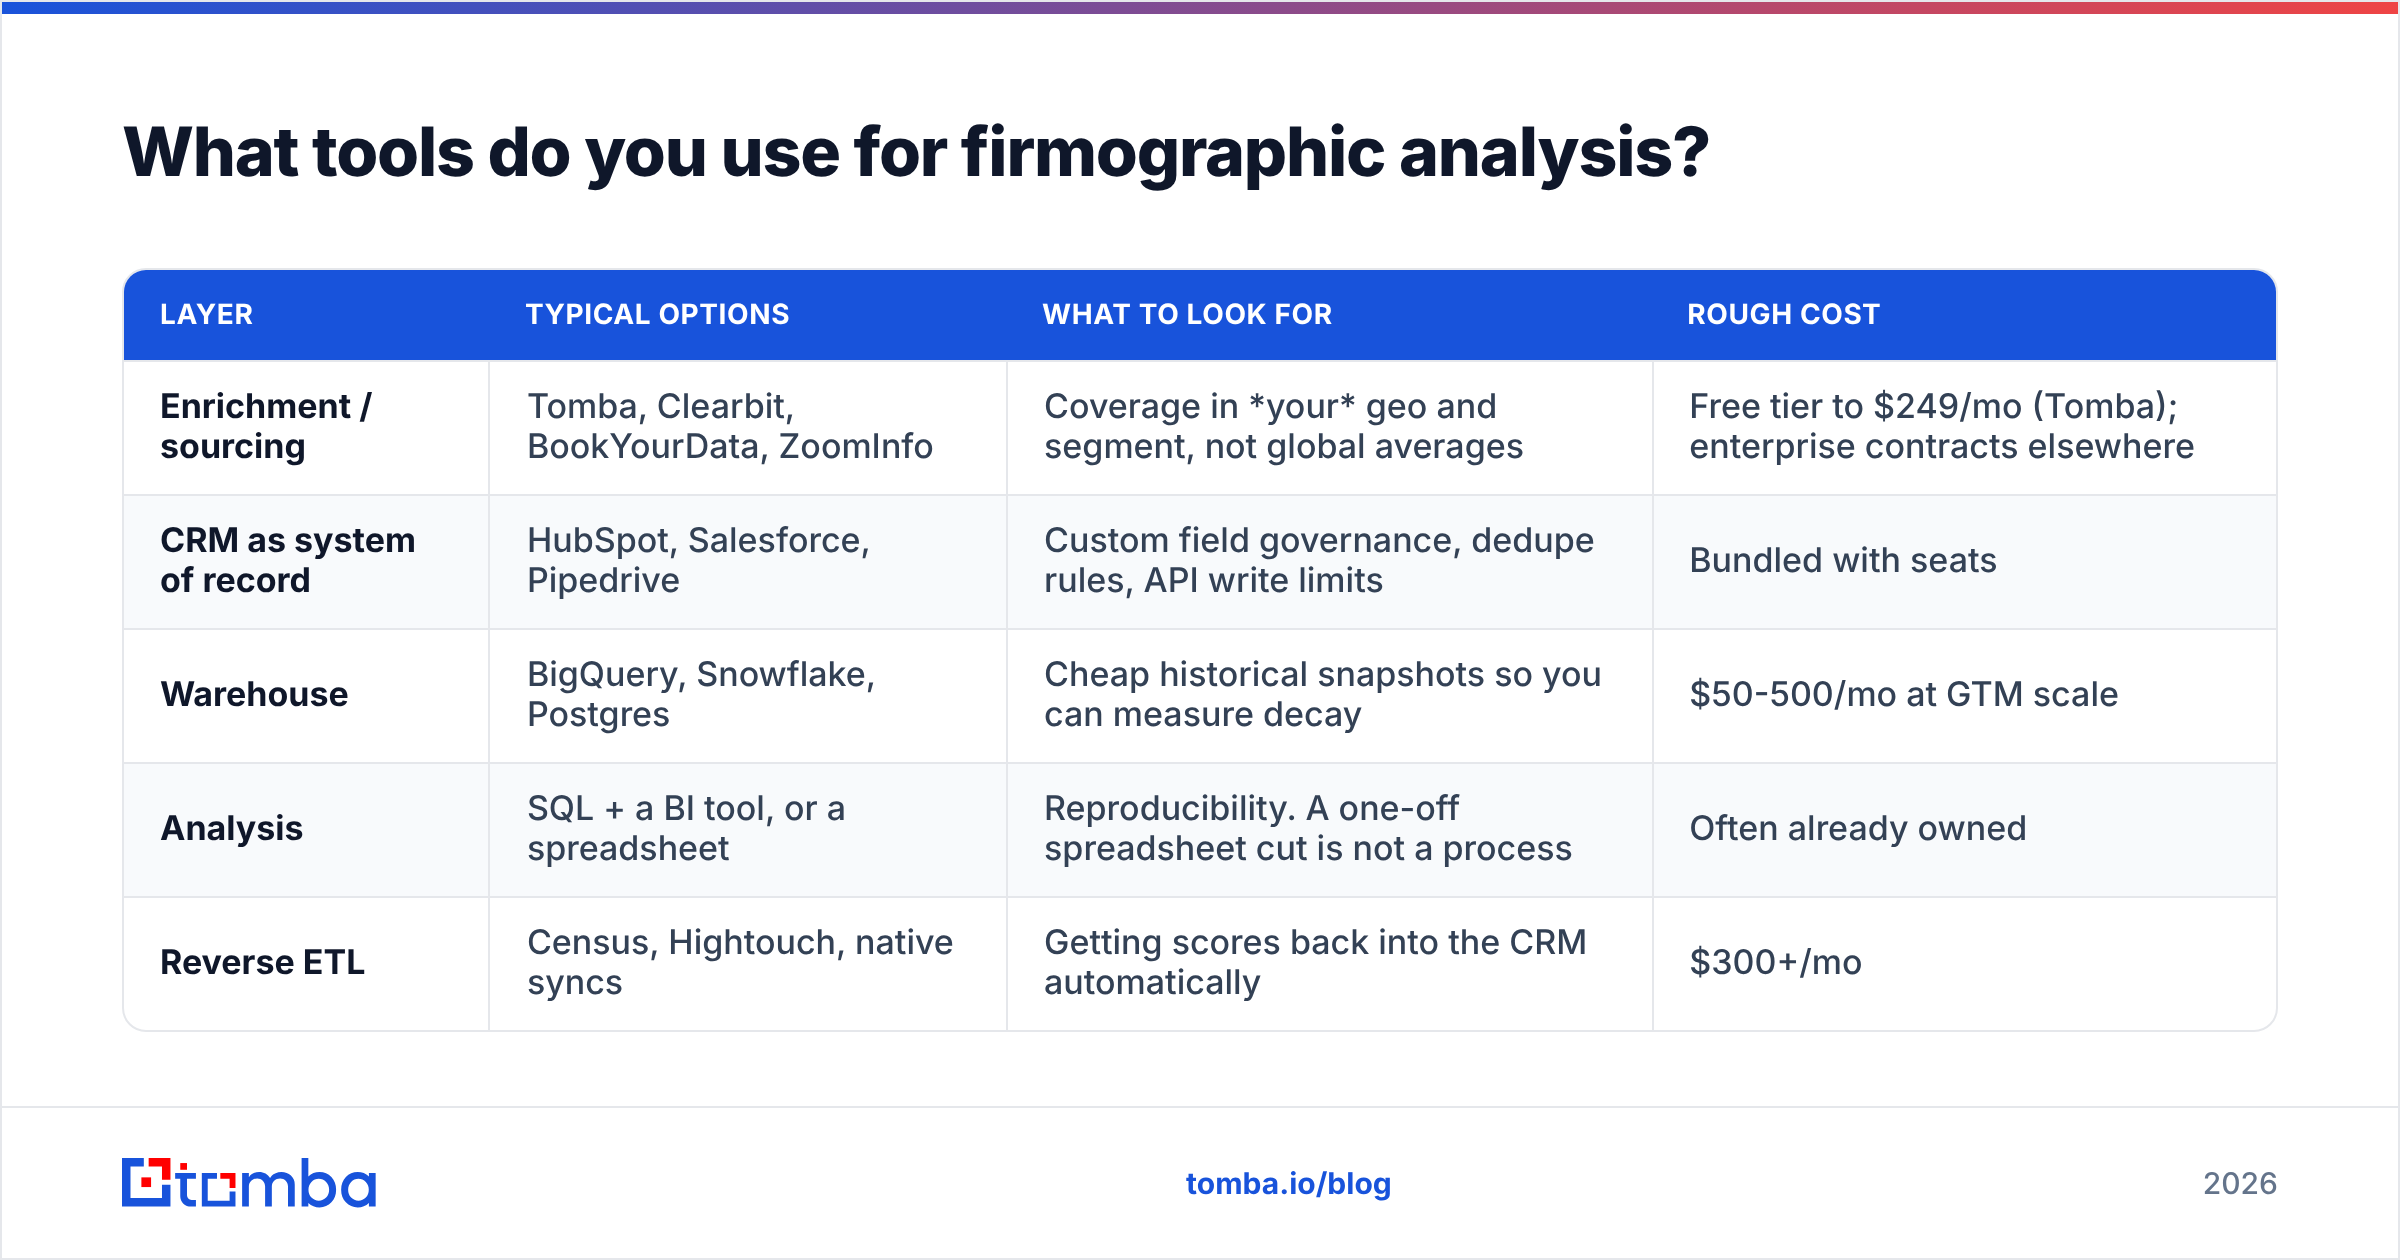
The stack splits into three jobs: sourcing the attributes, storing and cleaning them, and analyzing them. Most teams over-invest in the first job and under-invest in the second.
| Layer | Typical options | What to look for | Rough cost |
|---|---|---|---|
| Enrichment / sourcing | Tomba, Clearbit, BookYourData, ZoomInfo | Coverage in your geo and segment, not global averages | Free tier to $249/mo (Tomba); enterprise contracts elsewhere |
| CRM as system of record | HubSpot, Salesforce, Pipedrive | Custom field governance, dedupe rules, API write limits | Bundled with seats |
| Warehouse | BigQuery, Snowflake, Postgres | Cheap historical snapshots so you can measure decay | $50-500/mo at GTM scale |
| Analysis | SQL + a BI tool, or a spreadsheet | Reproducibility. A one-off spreadsheet cut is not a process | Often already owned |
| Reverse ETL | Census, Hightouch, native syncs | Getting scores back into the CRM automatically | $300+/mo |
You do not need all five to start. A CSV export, a pivot table, and a clean industry column get you 80% of the insight in an afternoon. Add the warehouse when you need to answer one question: what did this account look like six months ago? You cannot answer it if you only overwrite fields in place.
For sourcing, test coverage the honest way. Take 100 accounts you already know well. Run them through the vendor's trial. Then measure fill rate and accuracy against what you know. Published coverage stats are averages across a whole database. They tell you nothing about your vertical. G2's data enrichment category is a fine place to build a shortlist. But the 100-account test beats any review score.

How do you build a firmographic scoring model?#
Keep it simple enough that a rep can explain it. A four-attribute model beats a fourteen-attribute one in practice. The extra fields add noise, and nobody trusts a black box they cannot argue with.
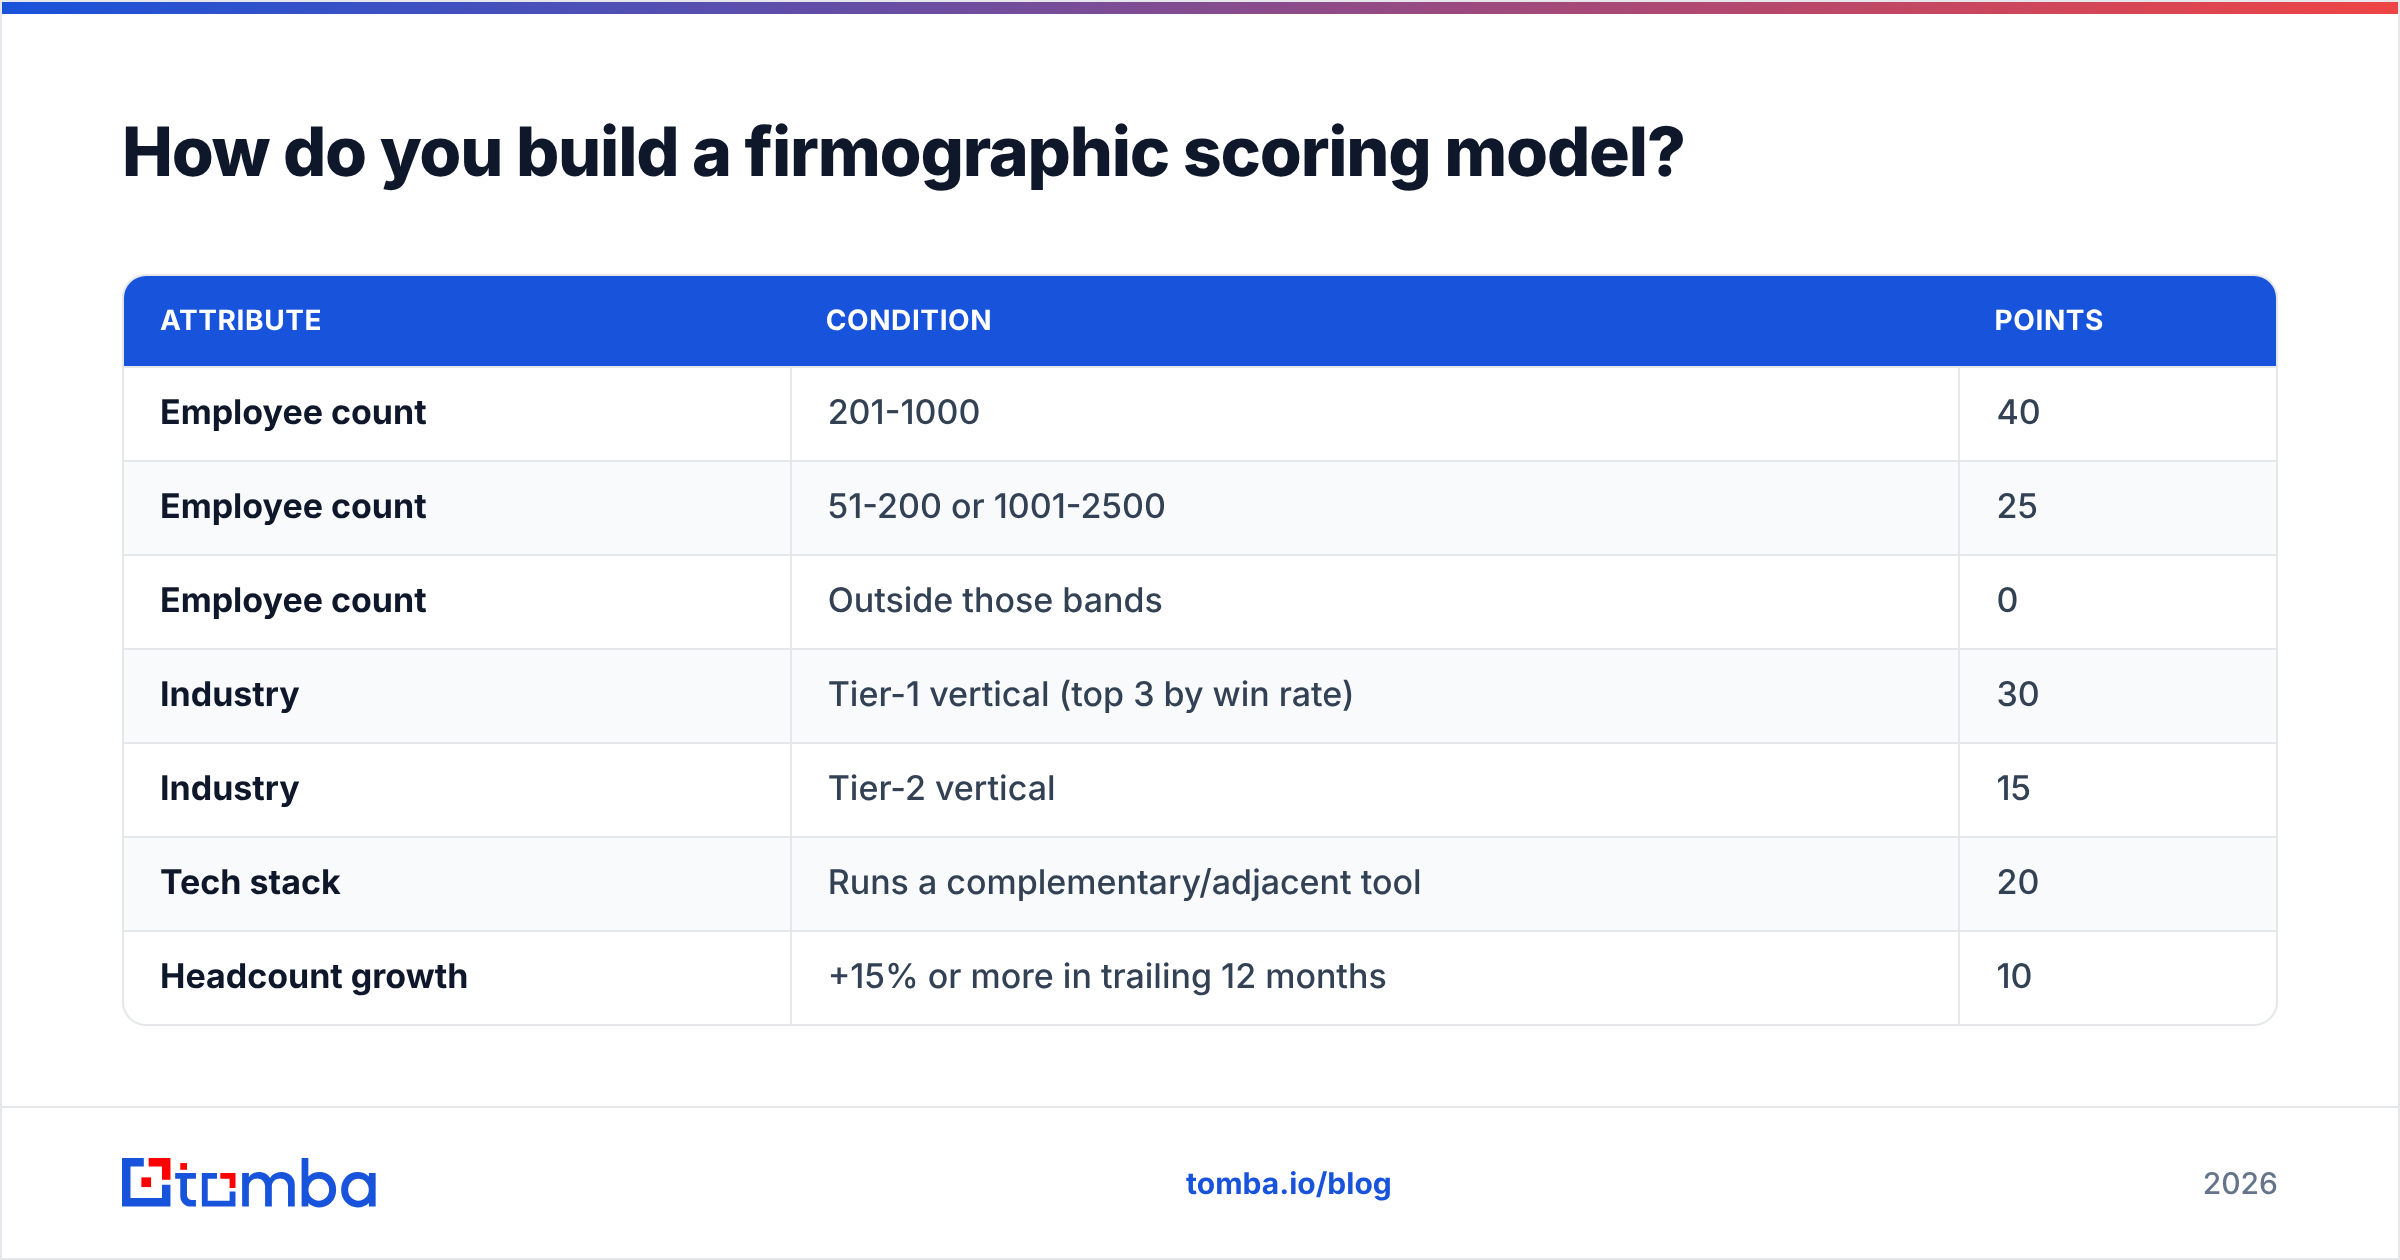
A working example for a mid-market SaaS product:
| Attribute | Condition | Points |
|---|---|---|
| Employee count | 201-1000 | 40 |
| Employee count | 51-200 or 1001-2500 | 25 |
| Employee count | Outside those bands | 0 |
| Industry | Tier-1 vertical (top 3 by win rate) | 30 |
| Industry | Tier-2 vertical | 15 |
| Tech stack | Runs a complementary/adjacent tool | 20 |
| Headcount growth | +15% or more in trailing 12 months | 10 |
A score of 70+ goes to outbound with a named AE. 40-69 goes to a lighter-touch sequence. Under 40 is dropped from paid and outbound. Not deleted, just not paid for.
Two rules keep the model honest. Cap the total at 100 so scores stay comparable across quarters. And keep a holdout. Work a small sample of low-score accounts each quarter. That is how you catch the model being wrong. If your low-tier holdout starts converting, your ICP has drifted. A model that only ever sees accounts it already approved will never tell you that.
Validate the model the way you would validate any prediction. Apply it backward to last year's closed opportunities. If the top tier does not beat the bottom tier on historical win rate, the weights are wrong.
How often should firmographic data be refreshed?#
Quarterly for active pipeline, twice a year for the wider database, and at once on trigger events.
The decay math is simple. Company records go stale through headcount changes, funding events, buyouts, rebrands, domain moves, and office moves. Across a typical B2B database, 25-30% of firmographic fields are plainly wrong after twelve months. On fast-moving segments, and venture-backed software firms above all, it is worse.
Practical refresh policy:
- Open opportunities — re-verify at deal creation, and again before any renewal or expansion talk.
- Active outbound targets — refresh the whole target list quarterly, before each campaign build.
- Dormant database — one bulk pass every six months. Bulk enrichment makes this a scheduled job rather than a project.
- Trigger-based — a funding announcement, a leadership change, or M&A news forces a re-score right away. The schedule does not matter.
Snapshot before you overwrite. Write the old values to a history table with a timestamp. Then you can measure your own decay rate instead of trusting an industry average. After two quarters you will know how fast your data rots. Then you can set the refresh cadence on evidence instead of vibes.
What are the most common firmographic analysis mistakes?#
Analyzing messy fields. Covered above, but it is the number one killer. If "Healthcare," "Health Care," and "Hospitals & Health Systems" are three buckets, every win-rate cut you produce is wrong.
Confusing correlation with cause. Enterprise accounts show higher ACV. That does not mean moving upmarket will raise your ACV. It may just mean your enterprise deals came through warm intros that do not scale. Check how the segment was sourced before you call the segment good.
Survivorship bias. Your CRM holds the companies you chose to chase. Say you have never prospected companies under 50 employees. Their absence from your win data is not proof they cannot buy. It is proof you never asked.
Ignoring the buying committee. Firmographics describe the company. They say nothing about whether you can reach the four people who sign. A perfect-fit account you cannot contact is worth zero. So pair the segment work with contact coverage checks. Run a sample of target accounts through an email finder before you commit budget to a vertical. Then confirm the addresses with an email verifier, so a "reachable" segment really is reachable.
Over-fitting on small samples. A vertical with eight deals and a 62% win rate is not your best segment. It is eight deals. HubSpot's research on ICP development makes the same point about sample size, and it holds whatever tooling you use.
Never revisiting. ICPs drift as products change, rivals enter, and pricing moves. A scoring model built in 2024 and left alone is misrouting leads today.
How do you turn the analysis into pipeline?#
The analysis is worthless until it changes what a rep does on Monday morning. Three concrete outputs:
- A suppression list. The bottom-tier segments come out of paid targeting and outbound sequences. This usually frees more budget than any tweak you make at the top end.
- A tiered target account list. Top-tier accounts get named ownership, custom messaging by vertical, and multi-threaded contact coverage. Build it as a living list, refreshed quarterly, not a one-time export.
- Segment-specific messaging. Say manufacturing at 200-1000 employees is your best segment. The sequence for that segment should name their real problems, not generic value props. Firmographic segmentation without message differentiation captures maybe a third of the lift on offer.
Then measure. Track win rate by tier for two full quarters. If tier-1 does not beat tier-3 by a wide margin, go back to step two. You found a correlation that does not hold going forward, which is exactly what the holdout sample exists to catch.
Ready to enrich the accounts your analysis says matter?#
Knowing how to analyze firmographic data only pays off when the underlying records are complete and current. Once you know which segments deserve investment, you need contact coverage inside those accounts. That means verified emails for the exact roles on the buying committee, not a generic info@ address.
Tomba's Email Finder takes a company domain and a name, then returns verified work addresses. Domain search, catch-all checks, and enrichment sit alongside it. The free tier includes 25 searches a month, so you can run the 100-account coverage test above before you spend anything. Paid plans start at $49/mo, with Growth at $99/mo and Pro at $249/mo. See full Tomba pricing for the breakdown. Or hit the Tomba API if you want this running as a scheduled job against your warehouse.
Related guides#
Ready to find emails that actually work?
Join 150,000+ professionals who stopped guessing and started sending. Free credits on signup — no credit card required.
Get the Tomba newsletter
Practical outbound tactics and product updates — once every two weeks.
About the author