How to Calculate Churn Rate: Formulas, Examples, Benchmarks
Four churn formulas, worked examples with real numbers, 2026 SaaS benchmarks, and the denominator mistakes that make your retention look better than it is.
TL;DR
- Customer (logo) churn = customers lost in a period ÷ customers at the start of that period. Everything else is a variation on that denominator.
- Revenue churn matters more than logo churn once your contract values stop being uniform — one enterprise cancellation can outweigh 40 self-serve ones.
- Gross revenue churn never goes below 0%. Net revenue churn can, because expansion offsets losses. Report both or you are hiding something.
- Monthly churn compounds. A "small" 4% monthly logo churn is 38.7% annual churn, not 48%.
- The number is only useful when it is segmented — by cohort, plan, acquisition channel, and ICP fit. A blended churn rate tells you almost nothing about what to fix.
What is churn, exactly?#
Churn is the rate at which customers or revenue leave your business over a defined period. That's it. The formula is trivial arithmetic; the hard part is deciding what counts as a customer, what counts as "lost," and what period you measure over.
Two teams at the same company can produce churn rates that differ by 3x without either of them lying. Finance counts a customer as churned on the contract end date. Customer Success counts them on the day they gave notice. Product counts them when usage hits zero. If you have not written those definitions down, you don't have a churn metric — you have three of them.
There are two families of churn, and you need both:
- Customer churn (logo churn) — how many accounts left, regardless of what they paid. Good for measuring product-market fit and onboarding quality.
- Revenue churn (dollar churn) — how much recurring revenue left. Good for forecasting, valuation, and board reporting.
- Gross vs net — gross counts only losses; net subtracts expansion revenue from existing customers. Gross tells you how leaky the bucket is; net tells you whether the bucket is filling anyway.
- Voluntary vs involuntary — a deliberate cancellation is a product problem. A failed credit card is a billing problem. Mixing them means you fix the wrong one.
The Wikipedia entry on churn rate is a decent neutral primer if you want the telecom-era origin of the term, which still shapes how most finance teams define it.
How do you calculate customer churn rate?#
The base formula:
Customer churn rate = (Customers lost during period ÷ Customers at start of period) × 100
Worked example. You start January with 1,000 active accounts. During January, 40 cancel and 120 new ones sign up.
- Customers lost: 40
- Customers at start: 1,000
- Churn rate: 40 ÷ 1,000 = 4.0% monthly
Note what you did not do: the 120 new customers never touch the denominator. Adding them is the single most common way teams accidentally make churn look better. If you had used the end-of-month count (1,080), you'd report 3.7% — a 7.5% understatement, every month, forever.
To annualize, do not multiply by 12. Churn compounds against a shrinking base:
Annual churn = 1 − (1 − monthly churn)^12
At 4% monthly: 1 − (0.96)^12 = 1 − 0.613 = 38.7% annual churn, not 48%. The difference is roughly a tenth of your customer base — enough to blow up a hiring plan.

How do you calculate revenue churn?#
Revenue churn replaces customer counts with MRR or ARR. You need three inputs: MRR at the start of the period, MRR lost to cancellations and downgrades, and MRR gained from existing customers via expansion.
Gross revenue churn = (Churned MRR + Downgrade MRR) ÷ Starting MRR × 100
Net revenue churn = (Churned MRR + Downgrade MRR − Expansion MRR) ÷ Starting MRR × 100
Net revenue retention (NRR) = (Starting MRR − Churned − Downgrades + Expansion) ÷ Starting MRR × 100
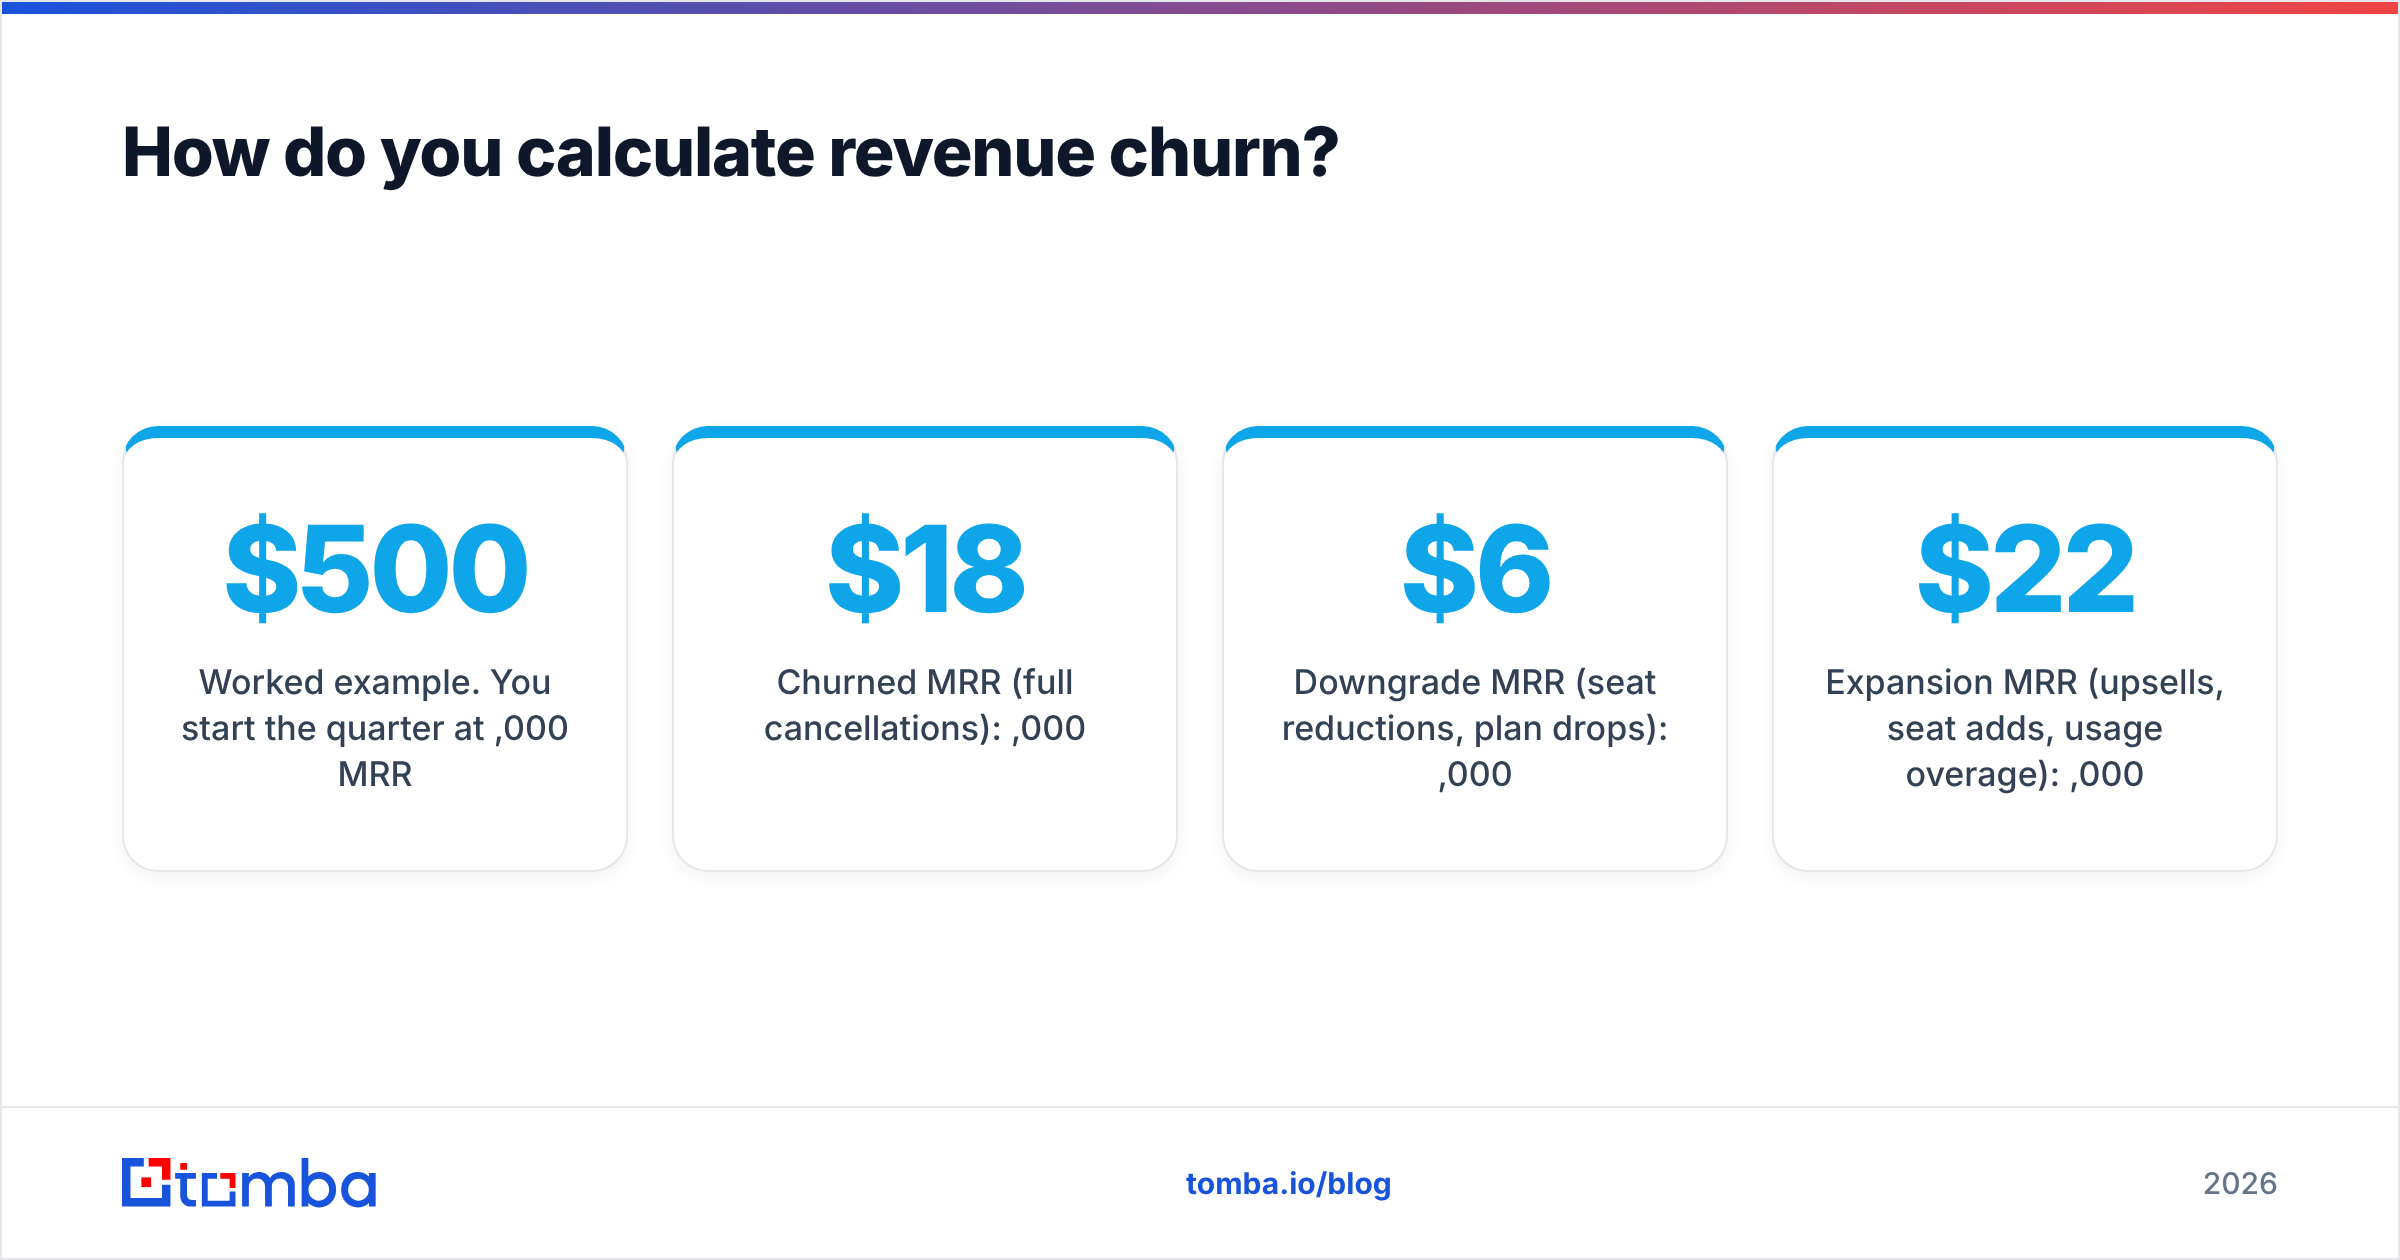
Worked example. You start the quarter at $500,000 MRR.
- Churned MRR (full cancellations): $18,000
- Downgrade MRR (seat reductions, plan drops): $6,000
- Expansion MRR (upsells, seat adds, usage overage): $22,000
Gross revenue churn = ($18,000 + $6,000) ÷ $500,000 = 4.8%
Net revenue churn = ($24,000 − $22,000) ÷ $500,000 = 0.4%
NRR = ($500,000 − $24,000 + $22,000) ÷ $500,000 = 99.6%
Notice how different the story is. Gross churn of 4.8% looks alarming. NRR of 99.6% looks stable. Both are true. Gross churn is your retention problem; NRR is your business-model answer to it. Reporting only NRR is how companies convince themselves for six quarters that a leaky product is fine — right up until expansion stalls.
Which churn formula should you use?#
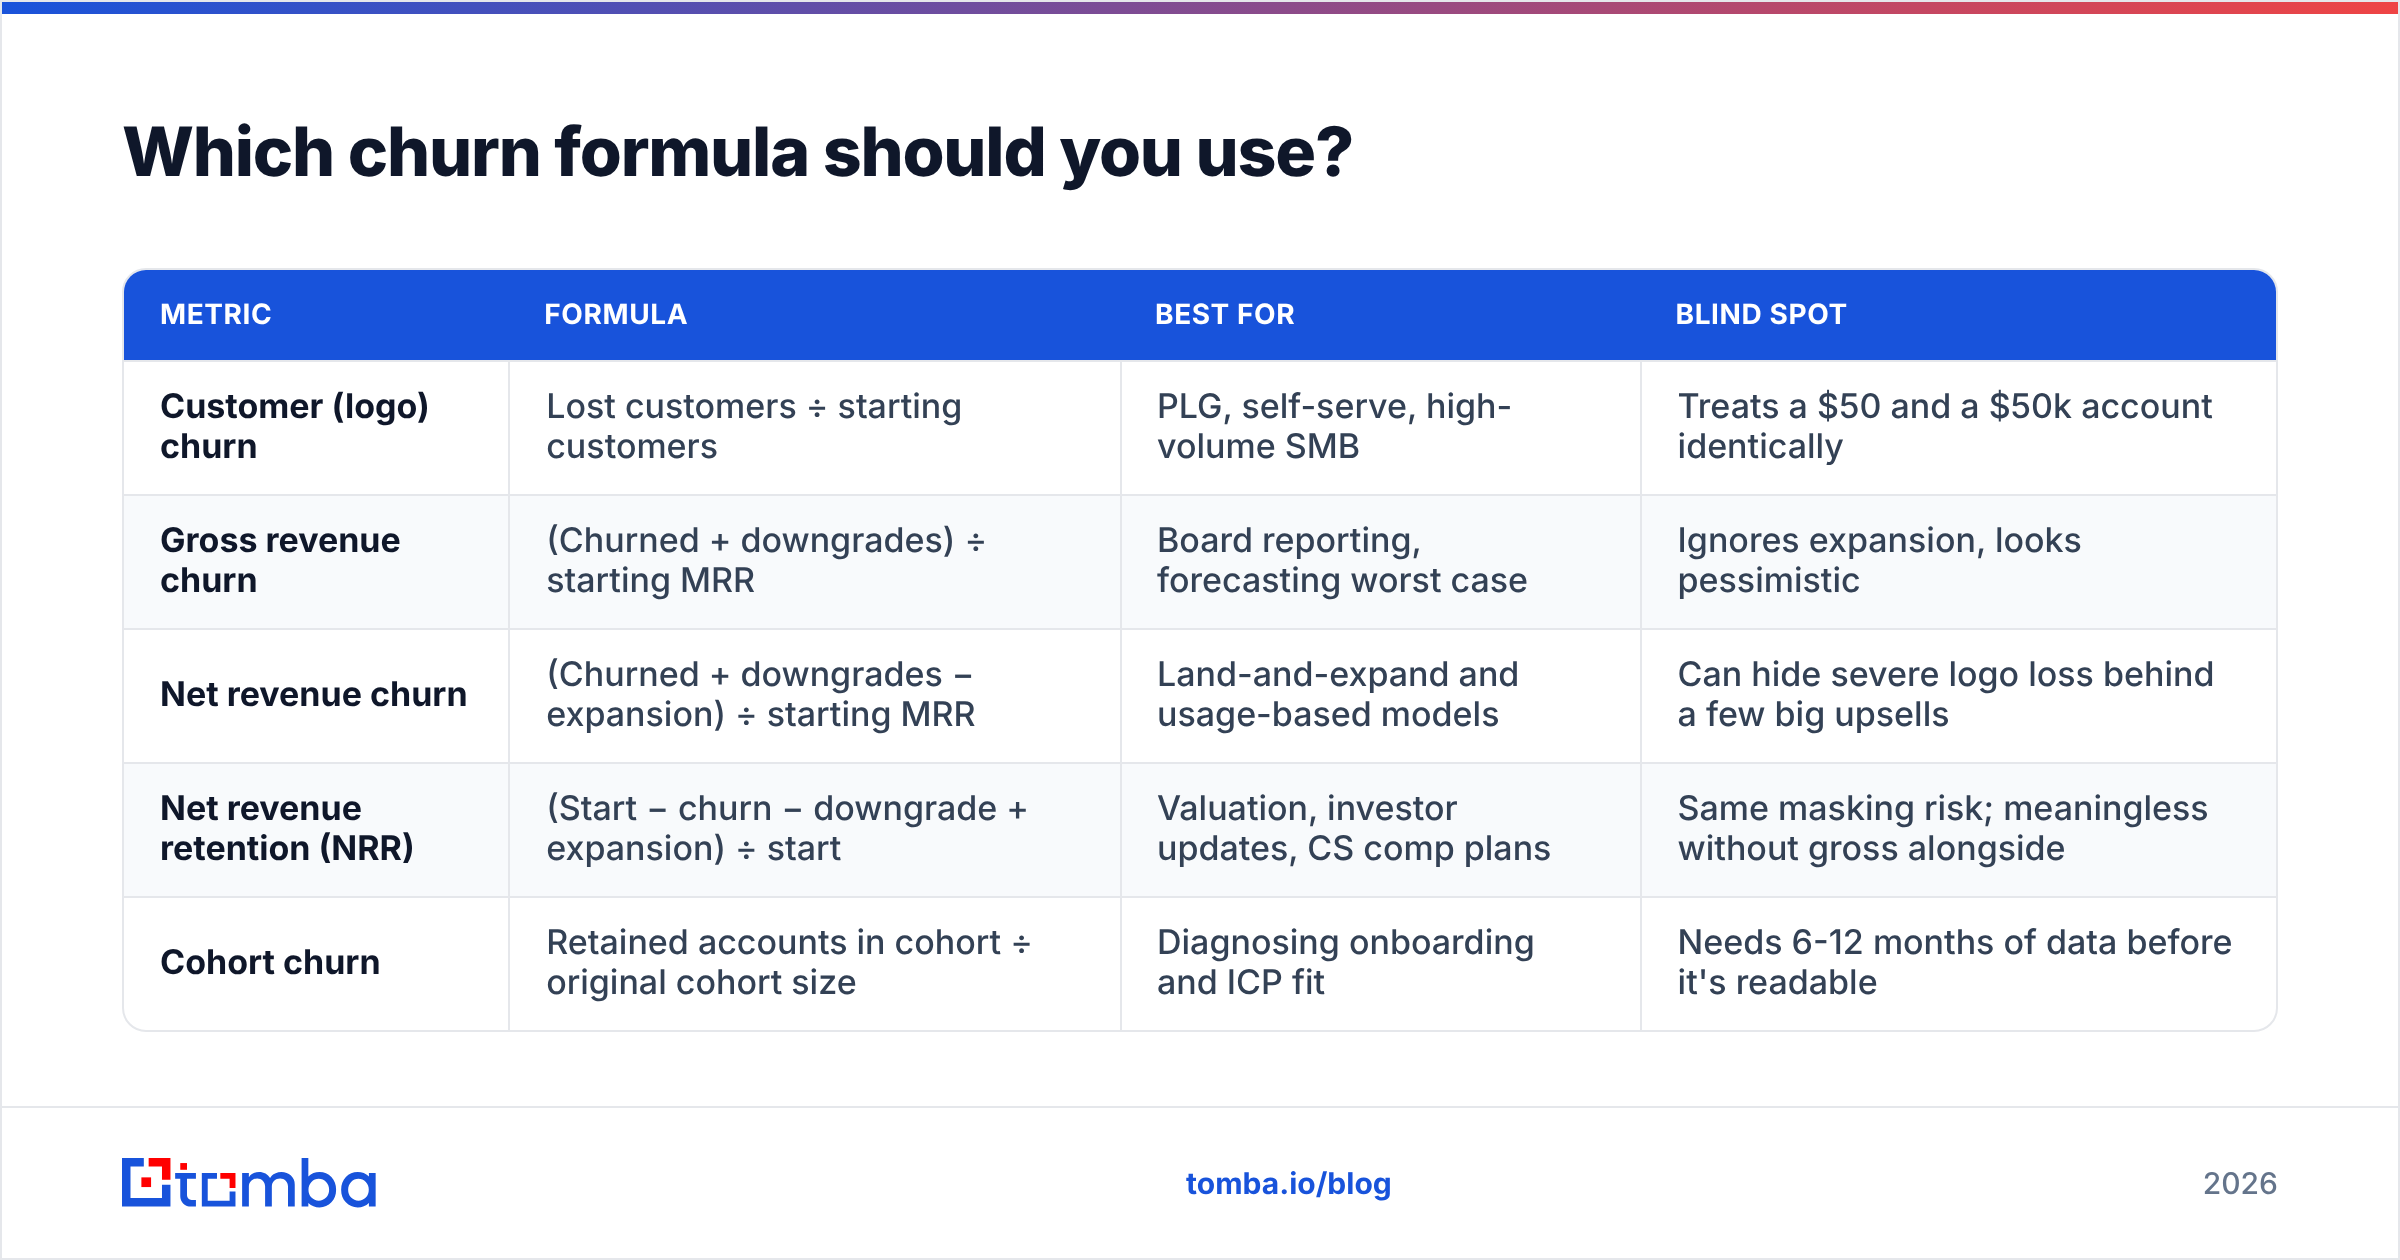
| Metric | Formula | Best for | Blind spot |
|---|---|---|---|
| Customer (logo) churn | Lost customers ÷ starting customers | PLG, self-serve, high-volume SMB | Treats a $50 and a $50k account identically |
| Gross revenue churn | (Churned + downgrades) ÷ starting MRR | Board reporting, forecasting worst case | Ignores expansion, looks pessimistic |
| Net revenue churn | (Churned + downgrades − expansion) ÷ starting MRR | Land-and-expand and usage-based models | Can hide severe logo loss behind a few big upsells |
| Net revenue retention (NRR) | (Start − churn − downgrade + expansion) ÷ start | Valuation, investor updates, CS comp plans | Same masking risk; meaningless without gross alongside |
| Cohort churn | Retained accounts in cohort ÷ original cohort size | Diagnosing onboarding and ICP fit | Needs 6-12 months of data before it's readable |
The practical rule: if your average contract value varies by more than about 5x across your customer base, logo churn is a vanity number and revenue churn is your real metric. If ACV is roughly uniform, logo churn is faster to compute and nearly as informative.
How do you handle the denominator problem?#
The denominator is where churn calculations quietly break. Three defensible approaches, in order of rigor:
- Start-of-period base (simple). Customers lost ÷ customers at period start. Ignores anyone who joined and left within the same period. Fine for monthly reporting on a stable base.
- Average base (adjusted). Customers lost ÷ ((start + end) ÷ 2). Smoother during fast growth, but it does understate churn by folding new logos into the denominator. Label it clearly if you use it.
- Cohort base (rigorous). Track each signup month as its own group and measure how many survive to month 3, 6, 12. Slower, immune to growth-rate distortion, and the only method that tells you whether churn is improving or you're just acquiring faster than you leak.
Shorten your measurement window and the noise increases; lengthen it and you lose the ability to react. Most B2B SaaS teams settle on monthly revenue churn for operations and quarterly cohort churn for strategy.
One more definitional trap: contraction is not churn, but it behaves like it. A customer who cuts from 50 seats to 5 is still a logo. Your logo churn is unaffected. Your revenue churn takes a 90% hit on that account. If your CS team is compensated on logo retention, you have just built an incentive to keep dying accounts on life support.
What counts as a good churn rate in 2026?#
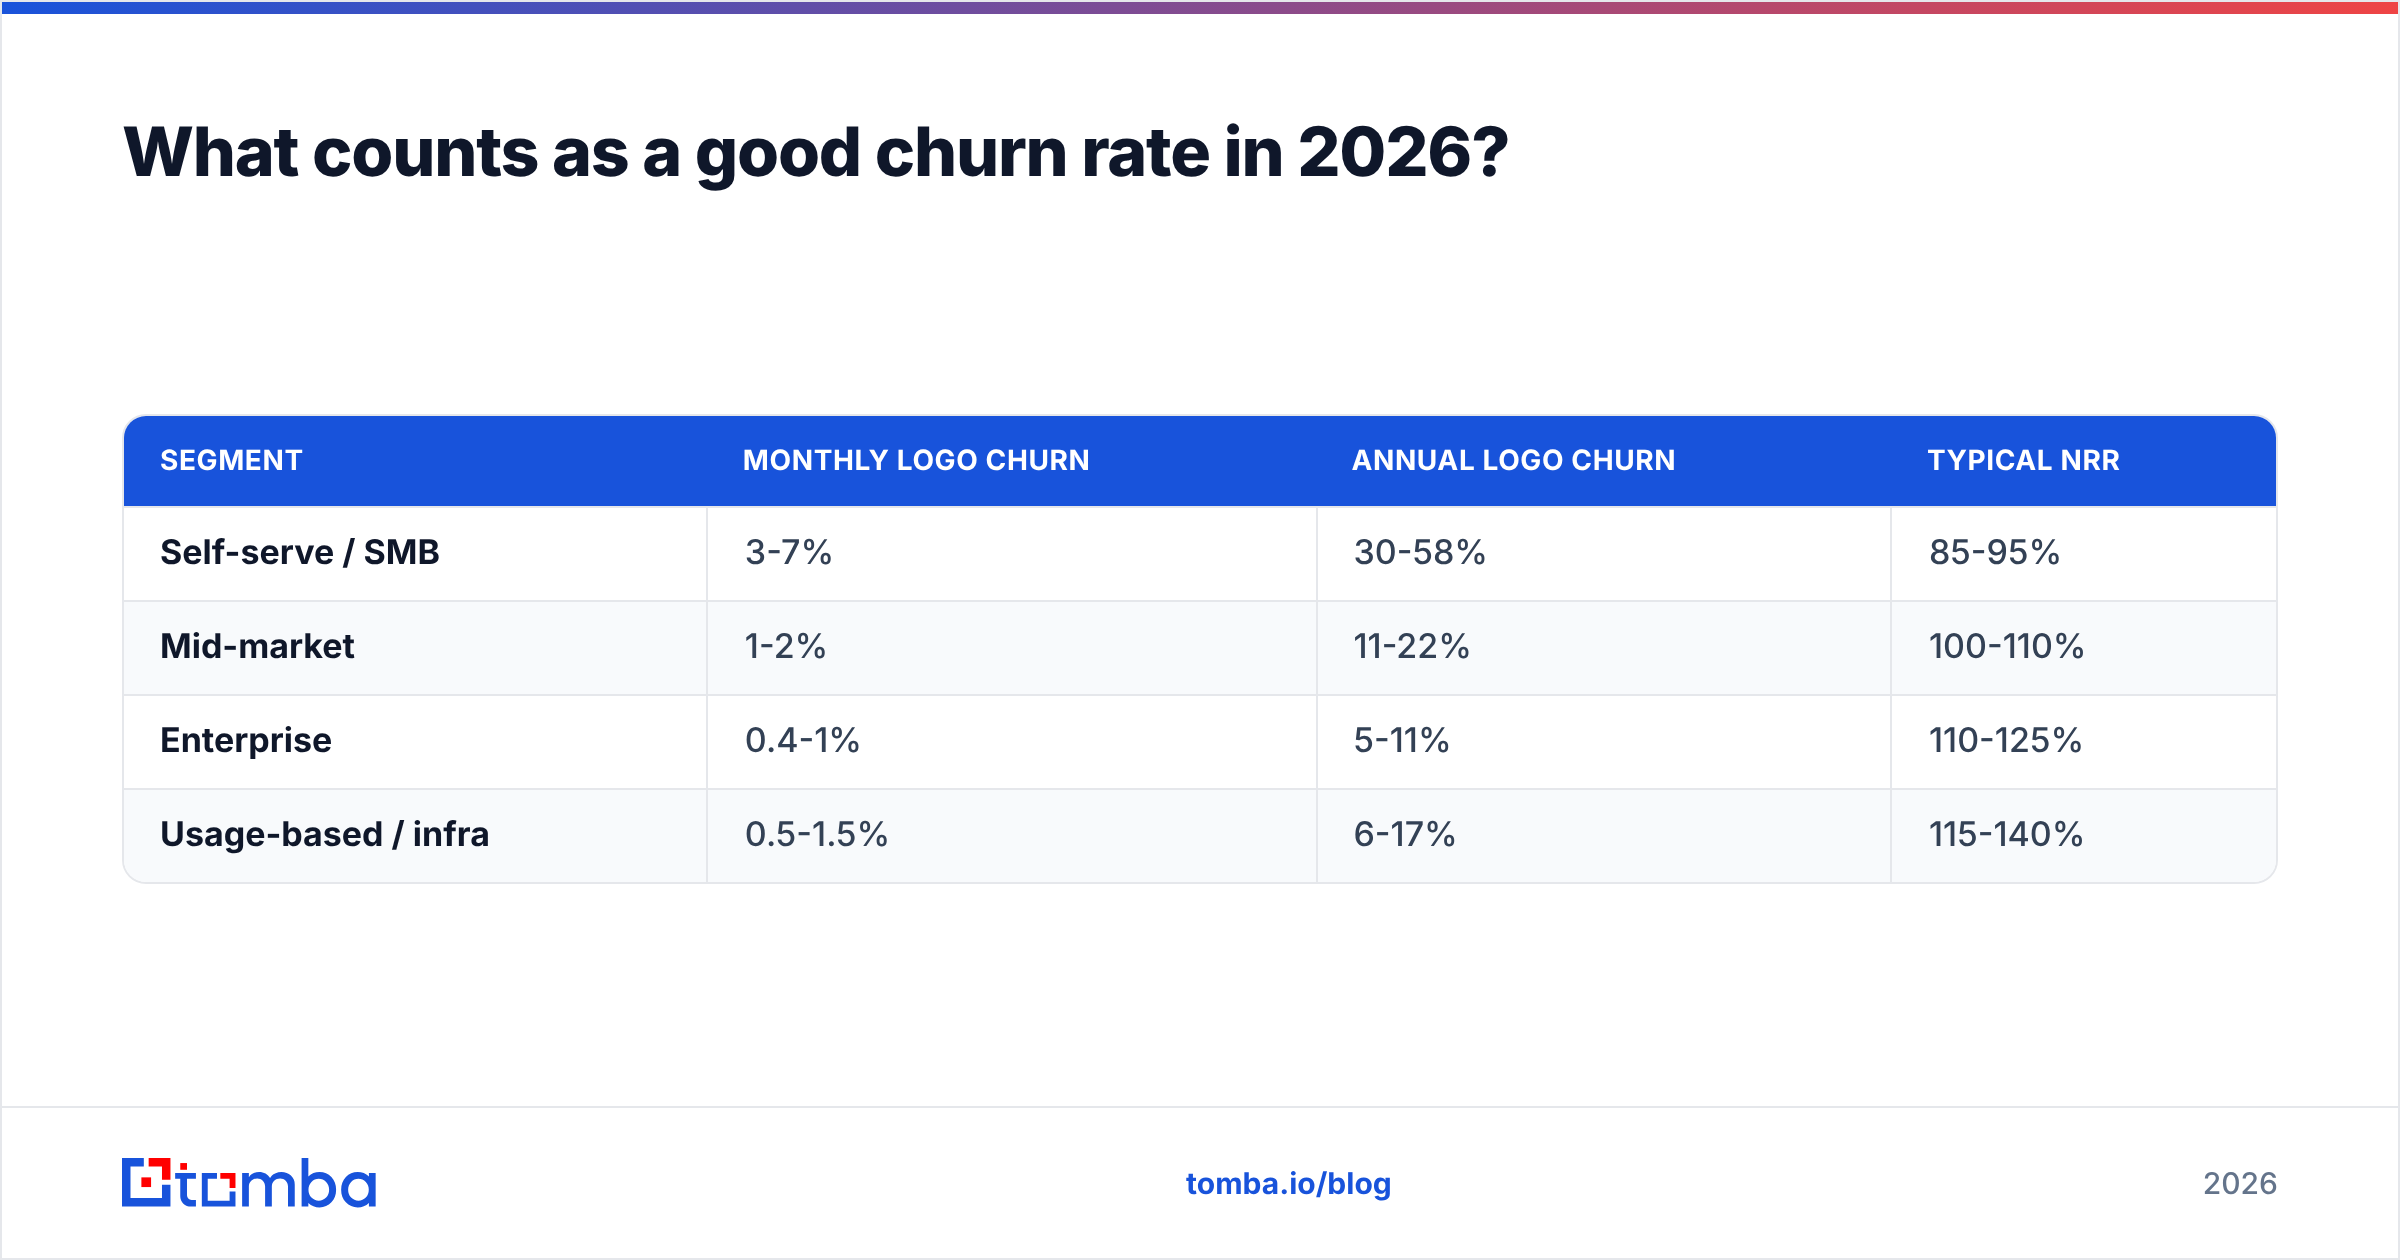
Benchmarks are directional, not verdicts. Ranges commonly cited across B2B SaaS reporting look roughly like this:
| Segment | Monthly logo churn | Annual logo churn | Typical NRR |
|---|---|---|---|
| Self-serve / SMB | 3-7% | 30-58% | 85-95% |
| Mid-market | 1-2% | 11-22% | 100-110% |
| Enterprise | 0.4-1% | 5-11% | 110-125% |
| Usage-based / infra | 0.5-1.5% | 6-17% | 115-140% |
Two honest caveats. First, published benchmarks skew toward companies that survived long enough to publish; the true SMB distribution is worse. Second, NRR above 120% is usually a pricing-model artifact (usage-based billing) rather than proof of superior retention. Analyst firms like Forrester and vendor benchmark reports from HubSpot publish updated ranges each year — use them to sanity-check your segment, not to grade yourself.

How do you calculate churn by cohort?#
Cohort analysis is the difference between knowing your churn and knowing why.
Build the table: rows are signup months, columns are months since signup, cells are the percentage of the original cohort still active. Then read it two ways.
- Read across a row to see the survival curve of one cohort. Most B2B products show a steep drop in months 1-3 (onboarding failure) that flattens by month 6.
- Read down a column to compare cohorts at the same age. If your March cohort retains 82% at month 3 and your June cohort retains 71%, something changed in acquisition, onboarding, or pricing between those months. That comparison is impossible with a blended monthly number.
Segment cohorts by acquisition source, not just date. Cold outbound, paid search, and referral cohorts almost always have different survival curves — often 15-25 points apart at month 12. If outbound-sourced accounts churn at twice the rate of referrals, the problem is usually targeting: you're closing companies that were never in the ideal customer profile. That's a revenue operations problem long before it's a customer success problem.
What mistakes inflate or hide your churn number?#
- Using the end-of-period customer count as the denominator. Understates churn by exactly your growth rate. The faster you grow, the better your retention looks — which is backwards.
- Multiplying monthly churn by 12. Overstates annual churn because it ignores compounding against a shrinking base. Use the exponential formula.
- Blending segments. A single company-wide churn rate averages a 6% self-serve tier with a 0.5% enterprise tier into a meaningless 3%. Nobody can act on that.
- Counting involuntary churn as voluntary. Failed payments typically account for 20-40% of gross churn in self-serve models. That's a dunning and card-updater fix, not a product fix — and it's the cheapest churn you'll ever recover.
- Excluding downgrades from revenue churn. Contraction is real lost revenue. Leaving it out is the most common way a churn dashboard becomes fiction.
- Reporting NRR without gross churn. One $200k expansion can mask twelve cancellations. Always show both numbers on the same slide.
How does churn connect to prospecting and pipeline?#
Here is the uncomfortable part: most churn is created at the top of the funnel, not at renewal.
When your outbound lists are built on stale or loosely-matched data, you book demos with companies that superficially resemble your ICP and structurally don't. Those deals close at a discount, onboard badly, and cancel in month 4 — and then land in a churn report that gets handed to a CS team who had no say in acquiring them.
Two concrete fixes on the acquisition side:
- Verify before you send. Bounces damage sender reputation, which suppresses reply rates, which pushes reps to widen targeting to hit quota — which is exactly how off-ICP accounts enter the funnel. Running lists through an email verifier before a sequence is the cheapest upstream churn control there is.
- Enrich before you qualify. Firmographic and technographic attributes on every record let you score fit at the lead stage instead of discovering the mismatch at renewal. Pulling headcount, tech stack, and funding signals via data enrichment or programmatically through the Tomba API makes "is this account likely to retain?" a question you answer before the first call, not after the first invoice.
Then close the loop: tag every closed-won account with its acquisition source and enrichment attributes, and re-run your cohort churn quarterly against those tags. Within two or three quarters you will know which segments to stop selling to. That single decision moves churn more than any save-play playbook.
What should you actually report?#
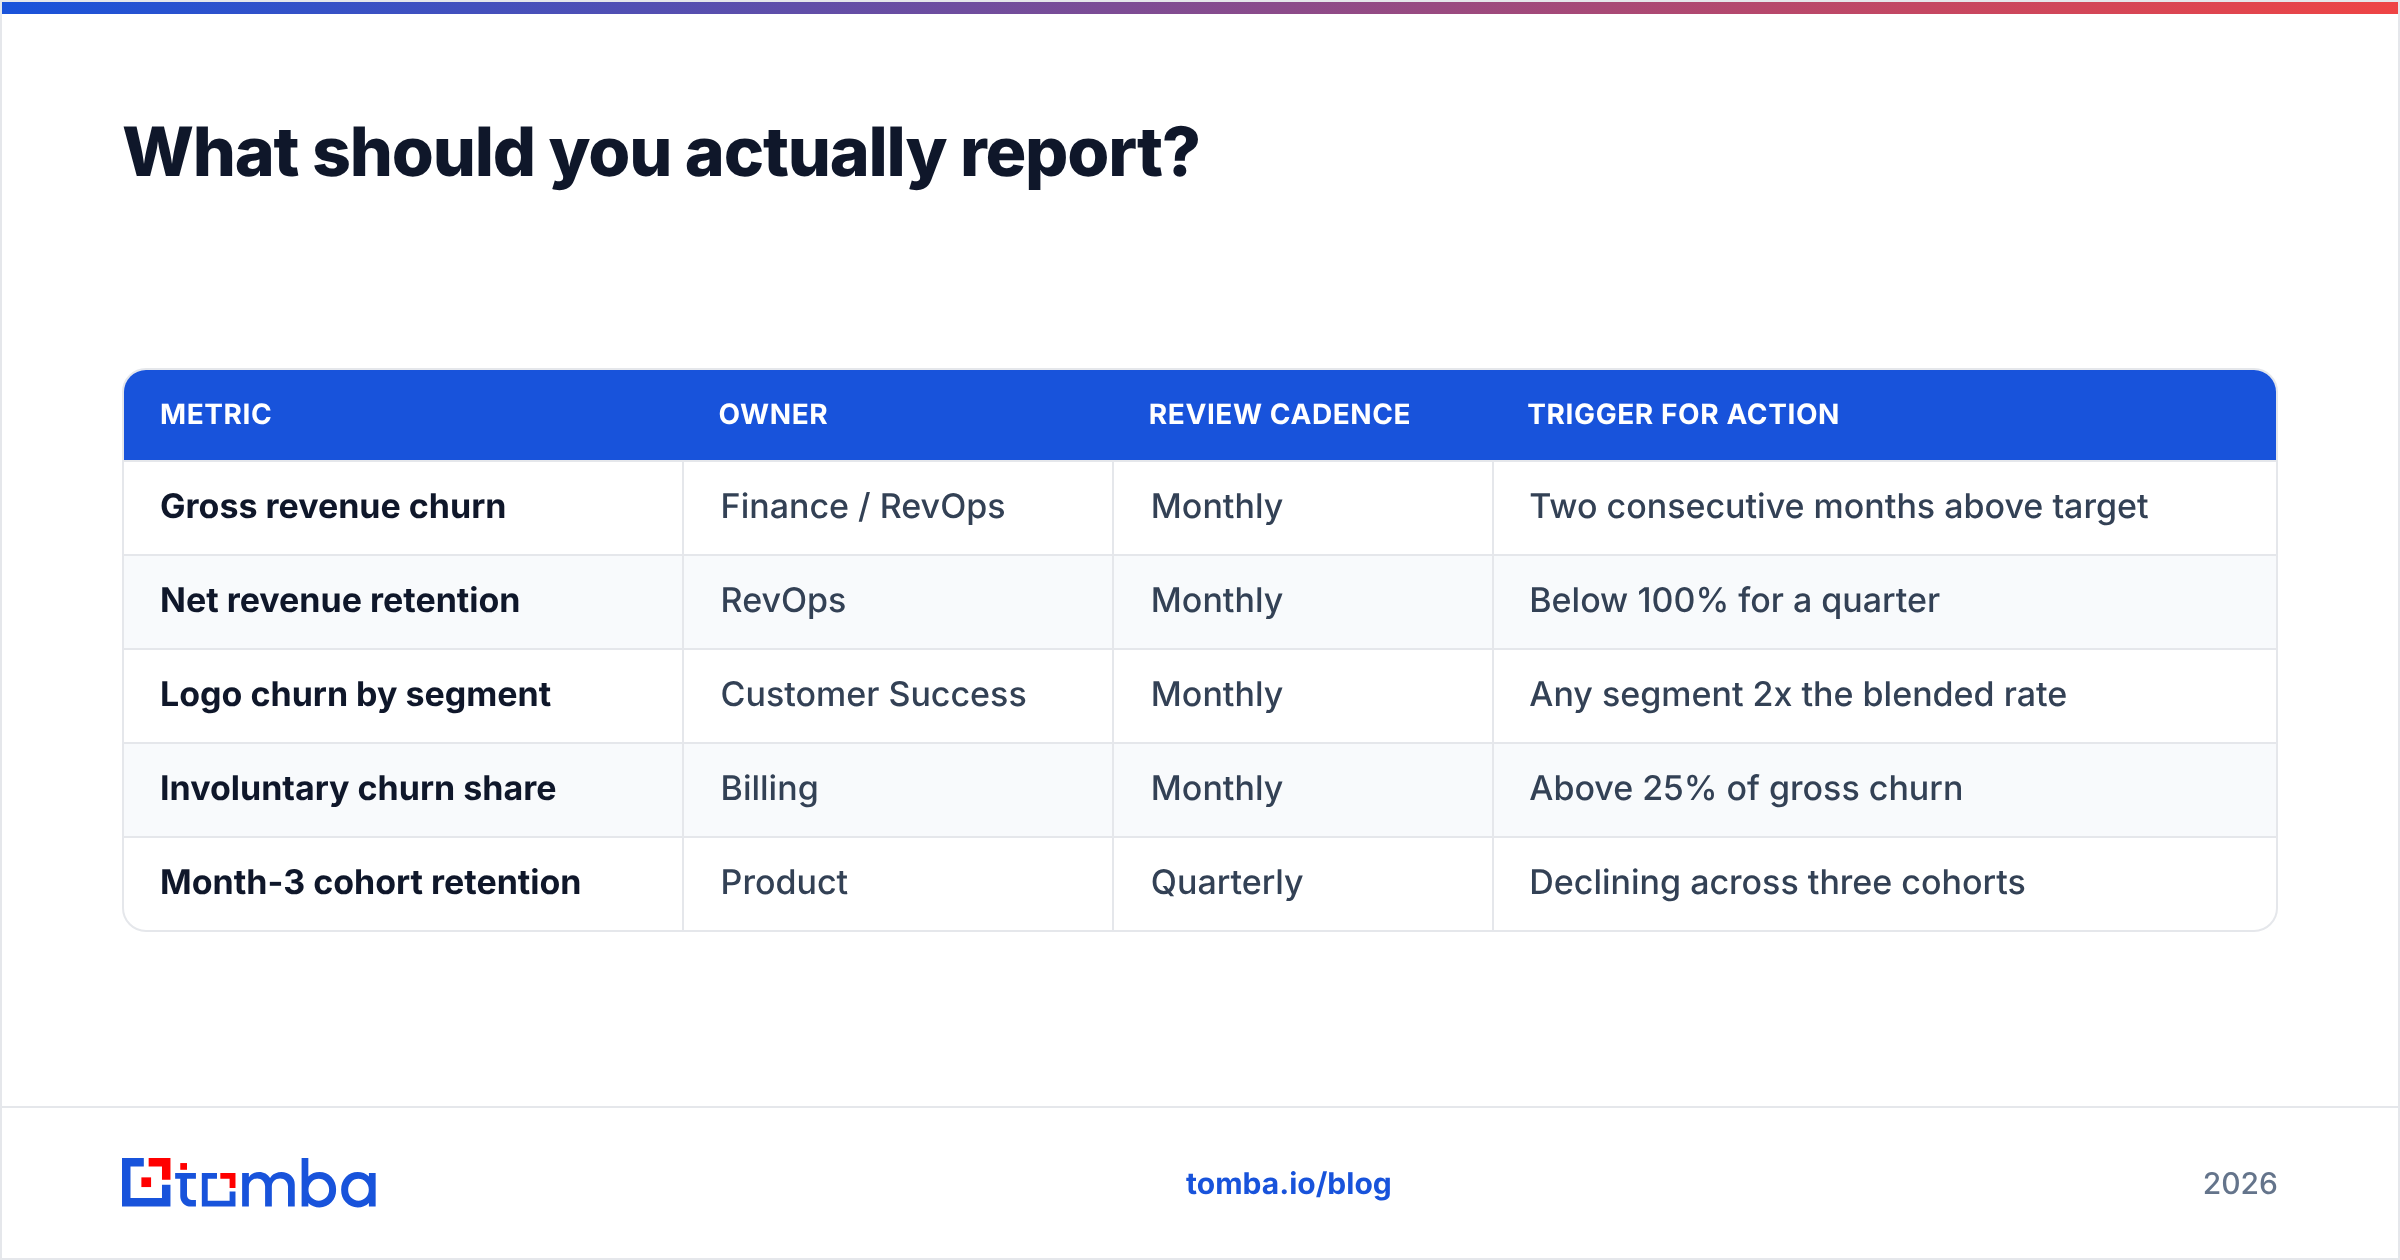
Keep the operating dashboard to five numbers, reviewed monthly:
| Metric | Owner | Review cadence | Trigger for action |
|---|---|---|---|
| Gross revenue churn | Finance / RevOps | Monthly | Two consecutive months above target |
| Net revenue retention | RevOps | Monthly | Below 100% for a quarter |
| Logo churn by segment | Customer Success | Monthly | Any segment 2x the blended rate |
| Involuntary churn share | Billing | Monthly | Above 25% of gross churn |
| Month-3 cohort retention | Product | Quarterly | Declining across three cohorts |
Anything beyond that is analysis, not reporting. And every one of those numbers needs a written definition sitting next to it — churn date rules, what counts as a downgrade, how trials and free tiers are treated. Write the definitions once, and your churn number stops being a debate.
Start upstream: build lists that don't churn#
Churn math is easy. Fixing churn is a targeting problem, and targeting starts with the quality of the contacts you reach out to in the first place. If your pipeline is full of accounts that were never a fit, no retention playbook will save the number.
Tomba Email Finder gives you verified, source-backed contact data for the companies that actually match your ICP — so your outbound lands with decision-makers at accounts likely to renew, not just accounts likely to reply. The free tier includes 25 searches a month, Starter is $49/mo, and Growth is $99/mo; full Tomba pricing is on the site. Fix the input, and the churn output takes care of a surprising amount of itself.
Related guides#
Ready to find emails that actually work?
Join 150,000+ professionals who stopped guessing and started sending. Free credits on signup — no credit card required.
Get the Tomba newsletter
Practical outbound tactics and product updates — once every two weeks.
About the author