How To Calculate Net Revenue Retention (NRR) in 5 Steps
The NRR formula is one line of math, but most SaaS teams still report a number that flatters them. Here is the exact calculation, a worked example, 2026 benchmarks, and the four mistakes that inflate the result.
TL;DR
- Net revenue retention (NRR) = (starting recurring revenue + expansion − contraction − churn) ÷ starting recurring revenue, measured on the same cohort of customers.
- New customers acquired during the period never belong in the numerator. That single rule is where most broken NRR dashboards go wrong.
- A healthy 2026 benchmark is roughly 100–110% for SMB-focused SaaS, 110–120% for mid-market, and 120%+ for enterprise or usage-based products.
- NRR above 100% means your existing base grows on its own. Below 100% means you are running an acquisition treadmill to stand still.
- Pair NRR with gross revenue retention (GRR) and logo retention — one number alone hides which lever is broken.
What is net revenue retention?#
Net revenue retention measures how much recurring revenue you keep and grow from customers you already had, ignoring every new logo you signed.
Think of it like a garden you planted last spring. NRR asks a narrow question: of the plants already in the ground twelve months ago, how much total growth do you have today — after some died, some were cut back, and some doubled in size? New seedlings you planted in July are irrelevant to that question. They get counted somewhere else.
Technically, NRR (sometimes called net dollar retention, or NDR) is a cohort-based ratio. You freeze a set of customers at a point in time, record their recurring revenue, then measure that same set's revenue after a defined period. Expansion — upsells, seat growth, usage overages, price increases — pushes the number above 100%. Downgrades and cancellations pull it below.
It is the single most quoted metric in SaaS board decks because it does something no other metric does: it tells you whether your business would still grow if you turned off sales entirely. That is why investors weight it so heavily when they value software companies, and why revenue operations teams own it rather than marketing.
How do you calculate net revenue retention?#
Here is the formula:
NRR = (Starting MRR + Expansion MRR − Contraction MRR − Churned MRR) ÷ Starting MRR × 100
Five steps to run it cleanly:
- Fix your cohort and your window. Pick a start date and lock the list of customer accounts active on that date. Most SaaS companies use a trailing 12-month window; usage-heavy products often run it monthly and then annualize. Whatever you pick, keep it consistent — switching windows between quarters makes the trend line meaningless.
- Record starting recurring revenue. Sum the normalized monthly (or annual) recurring revenue for that frozen cohort on day one. Normalize annual contracts to a monthly figure so a January-heavy renewal calendar does not distort the ratio.
- Add expansion revenue. Seat additions, tier upgrades, add-on modules, overage billing, and contractual price uplifts — but only from accounts inside the cohort.
- Subtract contraction and churn. Contraction is a downgrade or seat reduction from a surviving account. Churn is a full cancellation. Keep them in separate columns; you will want to know which one is doing the damage.
- Divide and express as a percentage. Ending cohort revenue ÷ starting cohort revenue. Multiply by 100.
The trap in step 3 is subtle and expensive: if a new customer you closed in month four upgrades in month nine, that upgrade is not expansion for this cohort. They were never in the cohort. Including them is the most common reason a dashboard reports 118% while the actual figure is 96%.
What does a worked NRR example look like?#
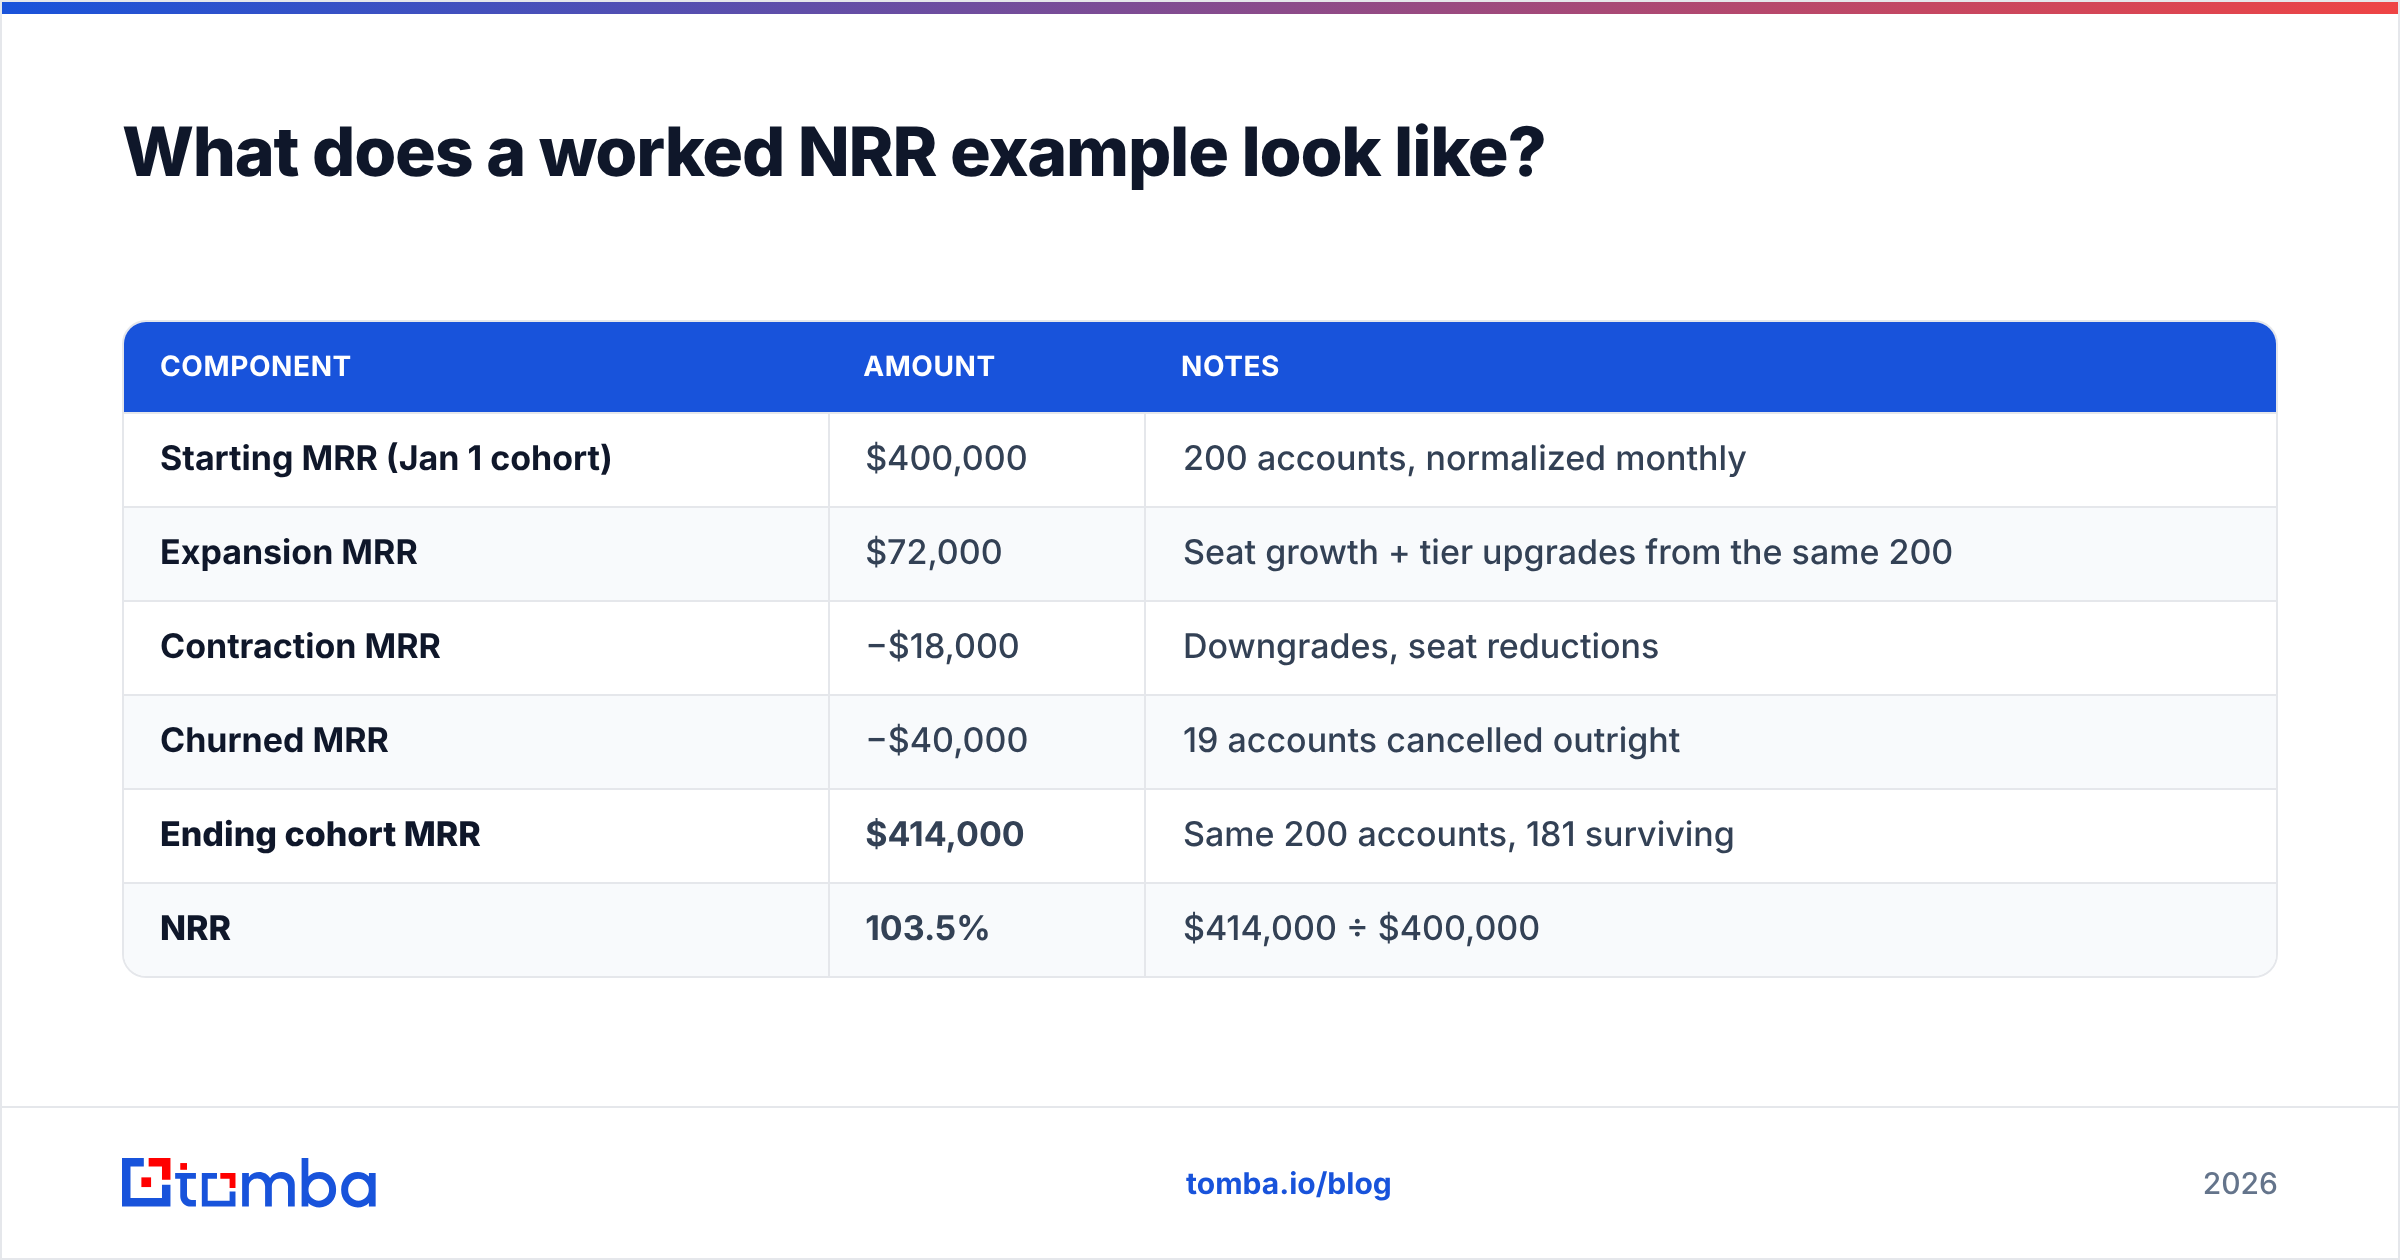
Numbers make this concrete. Assume you start the year with 200 customers producing $400,000 in MRR.
| Component | Amount | Notes |
|---|---|---|
| Starting MRR (Jan 1 cohort) | $400,000 | 200 accounts, normalized monthly |
| Expansion MRR | $72,000 | Seat growth + tier upgrades from the same 200 |
| Contraction MRR | −$18,000 | Downgrades, seat reductions |
| Churned MRR | −$40,000 | 19 accounts cancelled outright |
| Ending cohort MRR | $414,000 | Same 200 accounts, 181 surviving |
| NRR | 103.5% | $414,000 ÷ $400,000 |
New business closed during the year — say another $150,000 in MRR — does not appear anywhere in that table. It belongs in your growth rate, not your retention rate.
Notice what 103.5% actually tells you. The base grew, but barely. Expansion of $72,000 was almost entirely consumed by $58,000 of contraction and churn. This is a business with a working upsell motion and a leaking bucket underneath it — a very different diagnosis than a company at 103.5% with $20,000 expansion and $6,000 churn.
Is NRR different from gross revenue retention?#
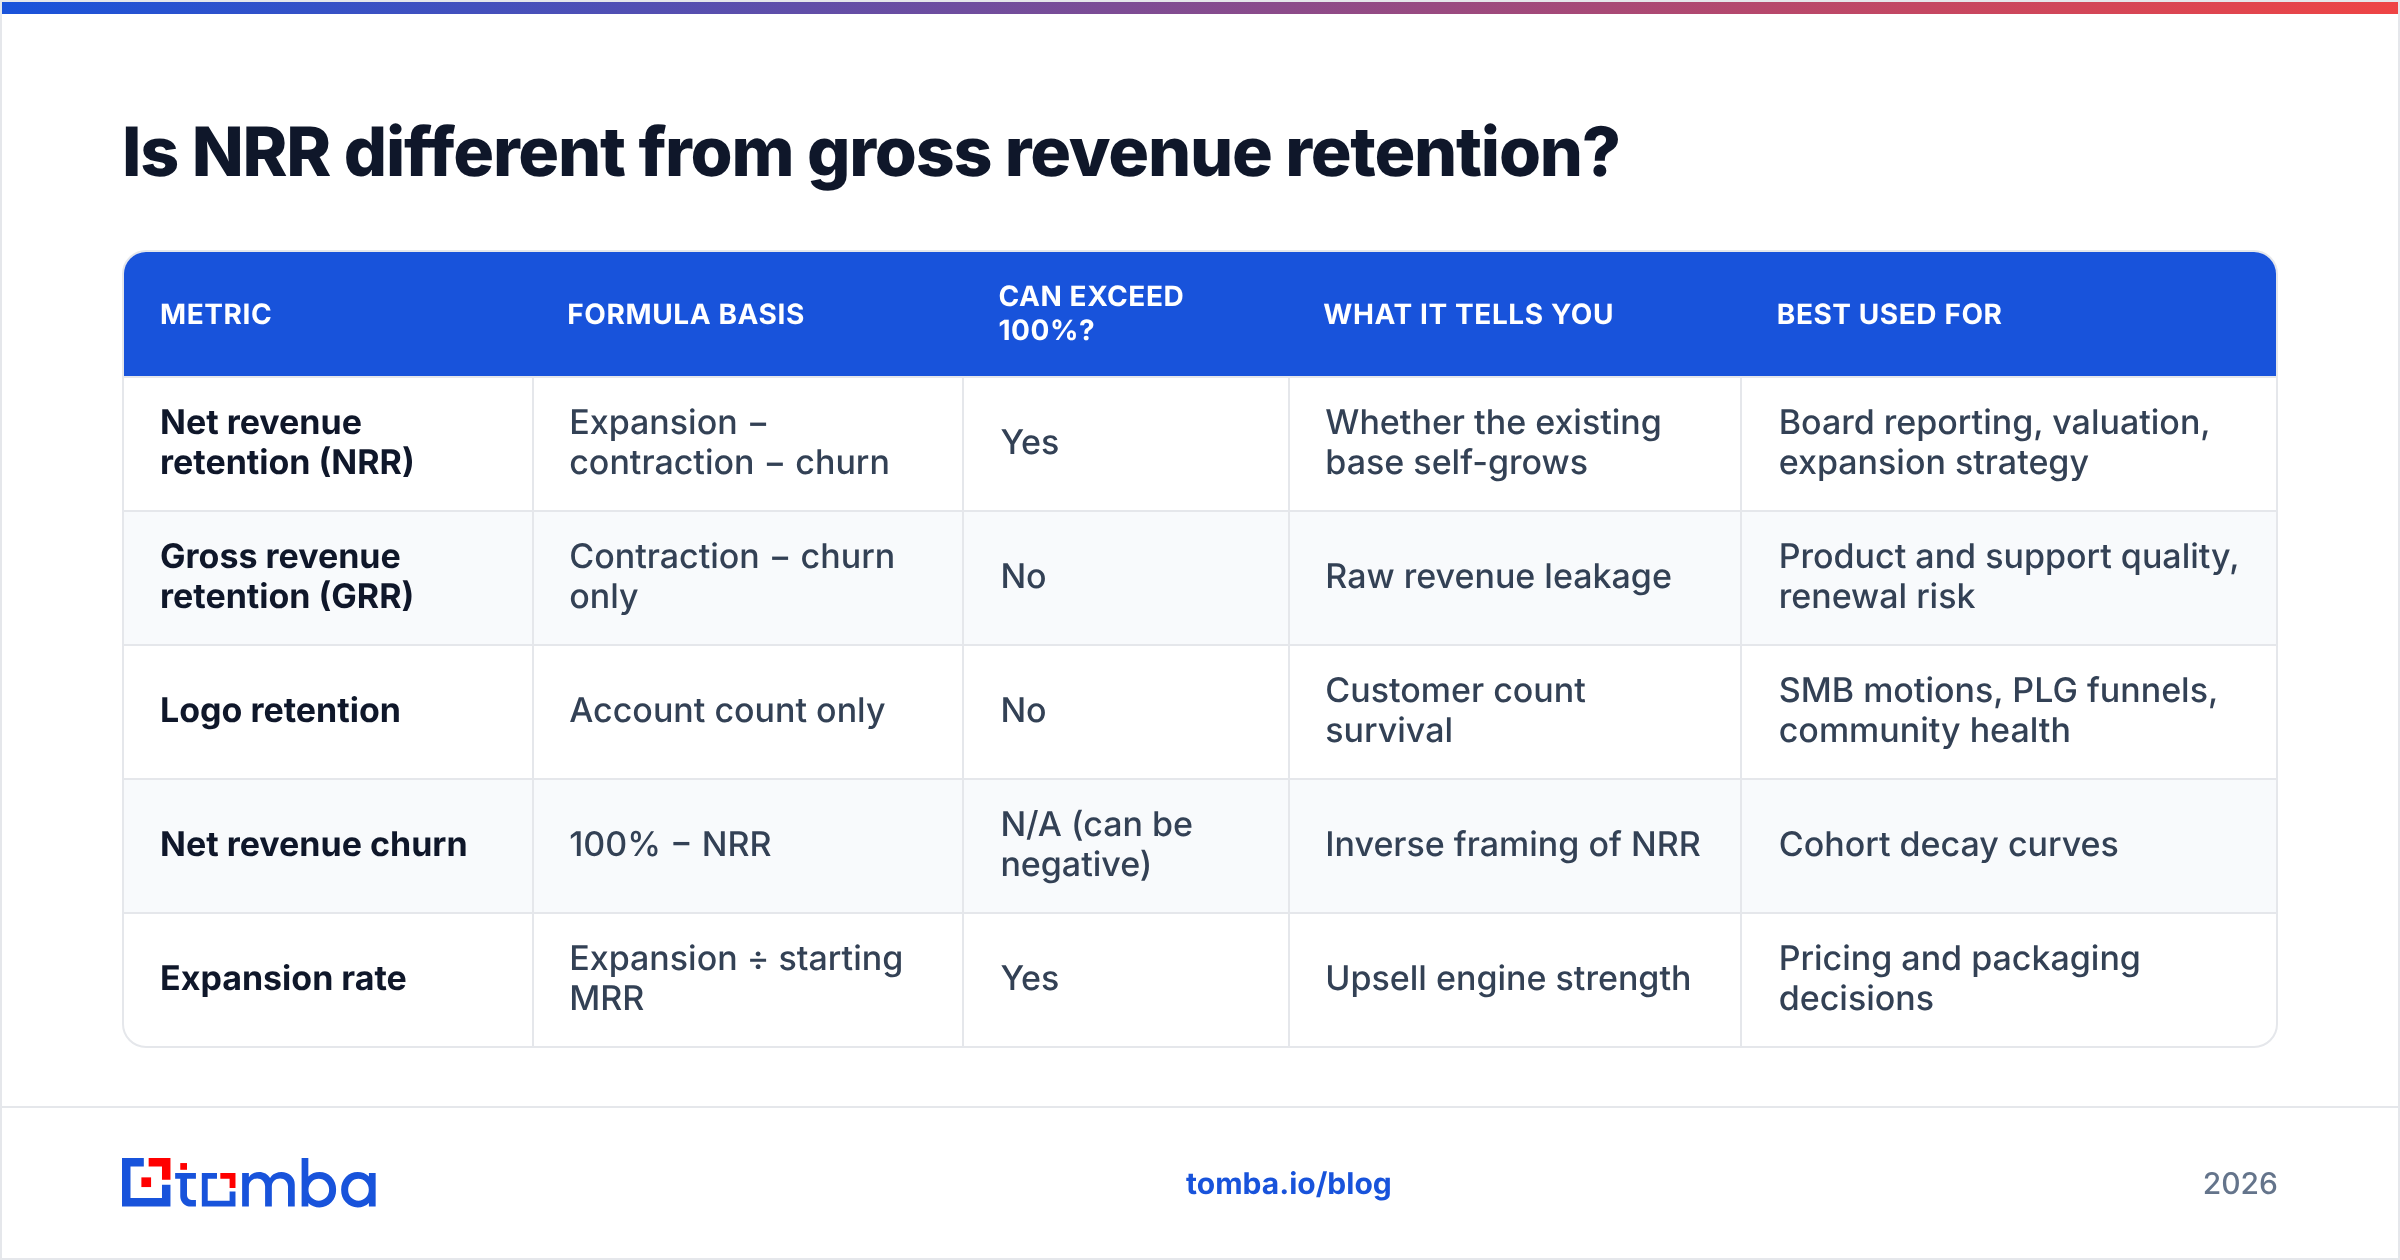
Yes, and reporting only one of them is how teams misread their own health. GRR strips out expansion entirely, so it can never exceed 100%. It measures pure leakage.
| Metric | Formula basis | Can exceed 100%? | What it tells you | Best used for |
|---|---|---|---|---|
| Net revenue retention (NRR) | Expansion − contraction − churn | Yes | Whether the existing base self-grows | Board reporting, valuation, expansion strategy |
| Gross revenue retention (GRR) | Contraction − churn only | No | Raw revenue leakage | Product and support quality, renewal risk |
| Logo retention | Account count only | No | Customer count survival | SMB motions, PLG funnels, community health |
| Net revenue churn | 100% − NRR | N/A (can be negative) | Inverse framing of NRR | Cohort decay curves |
| Expansion rate | Expansion ÷ starting MRR | Yes | Upsell engine strength | Pricing and packaging decisions |
The pairing matters. A company at 118% NRR and 82% GRR is masking severe churn with a handful of massive enterprise upsells — remove two whale accounts and the story collapses. A company at 104% NRR and 97% GRR is far more durable even though the headline number is lower. Always publish both. Gartner and most growth-stage investors will ask for the split anyway.
What is a good net revenue retention benchmark in 2026?#
Benchmarks only mean something inside a segment. A self-serve $29/month tool and a seven-figure enterprise platform live in different physics.
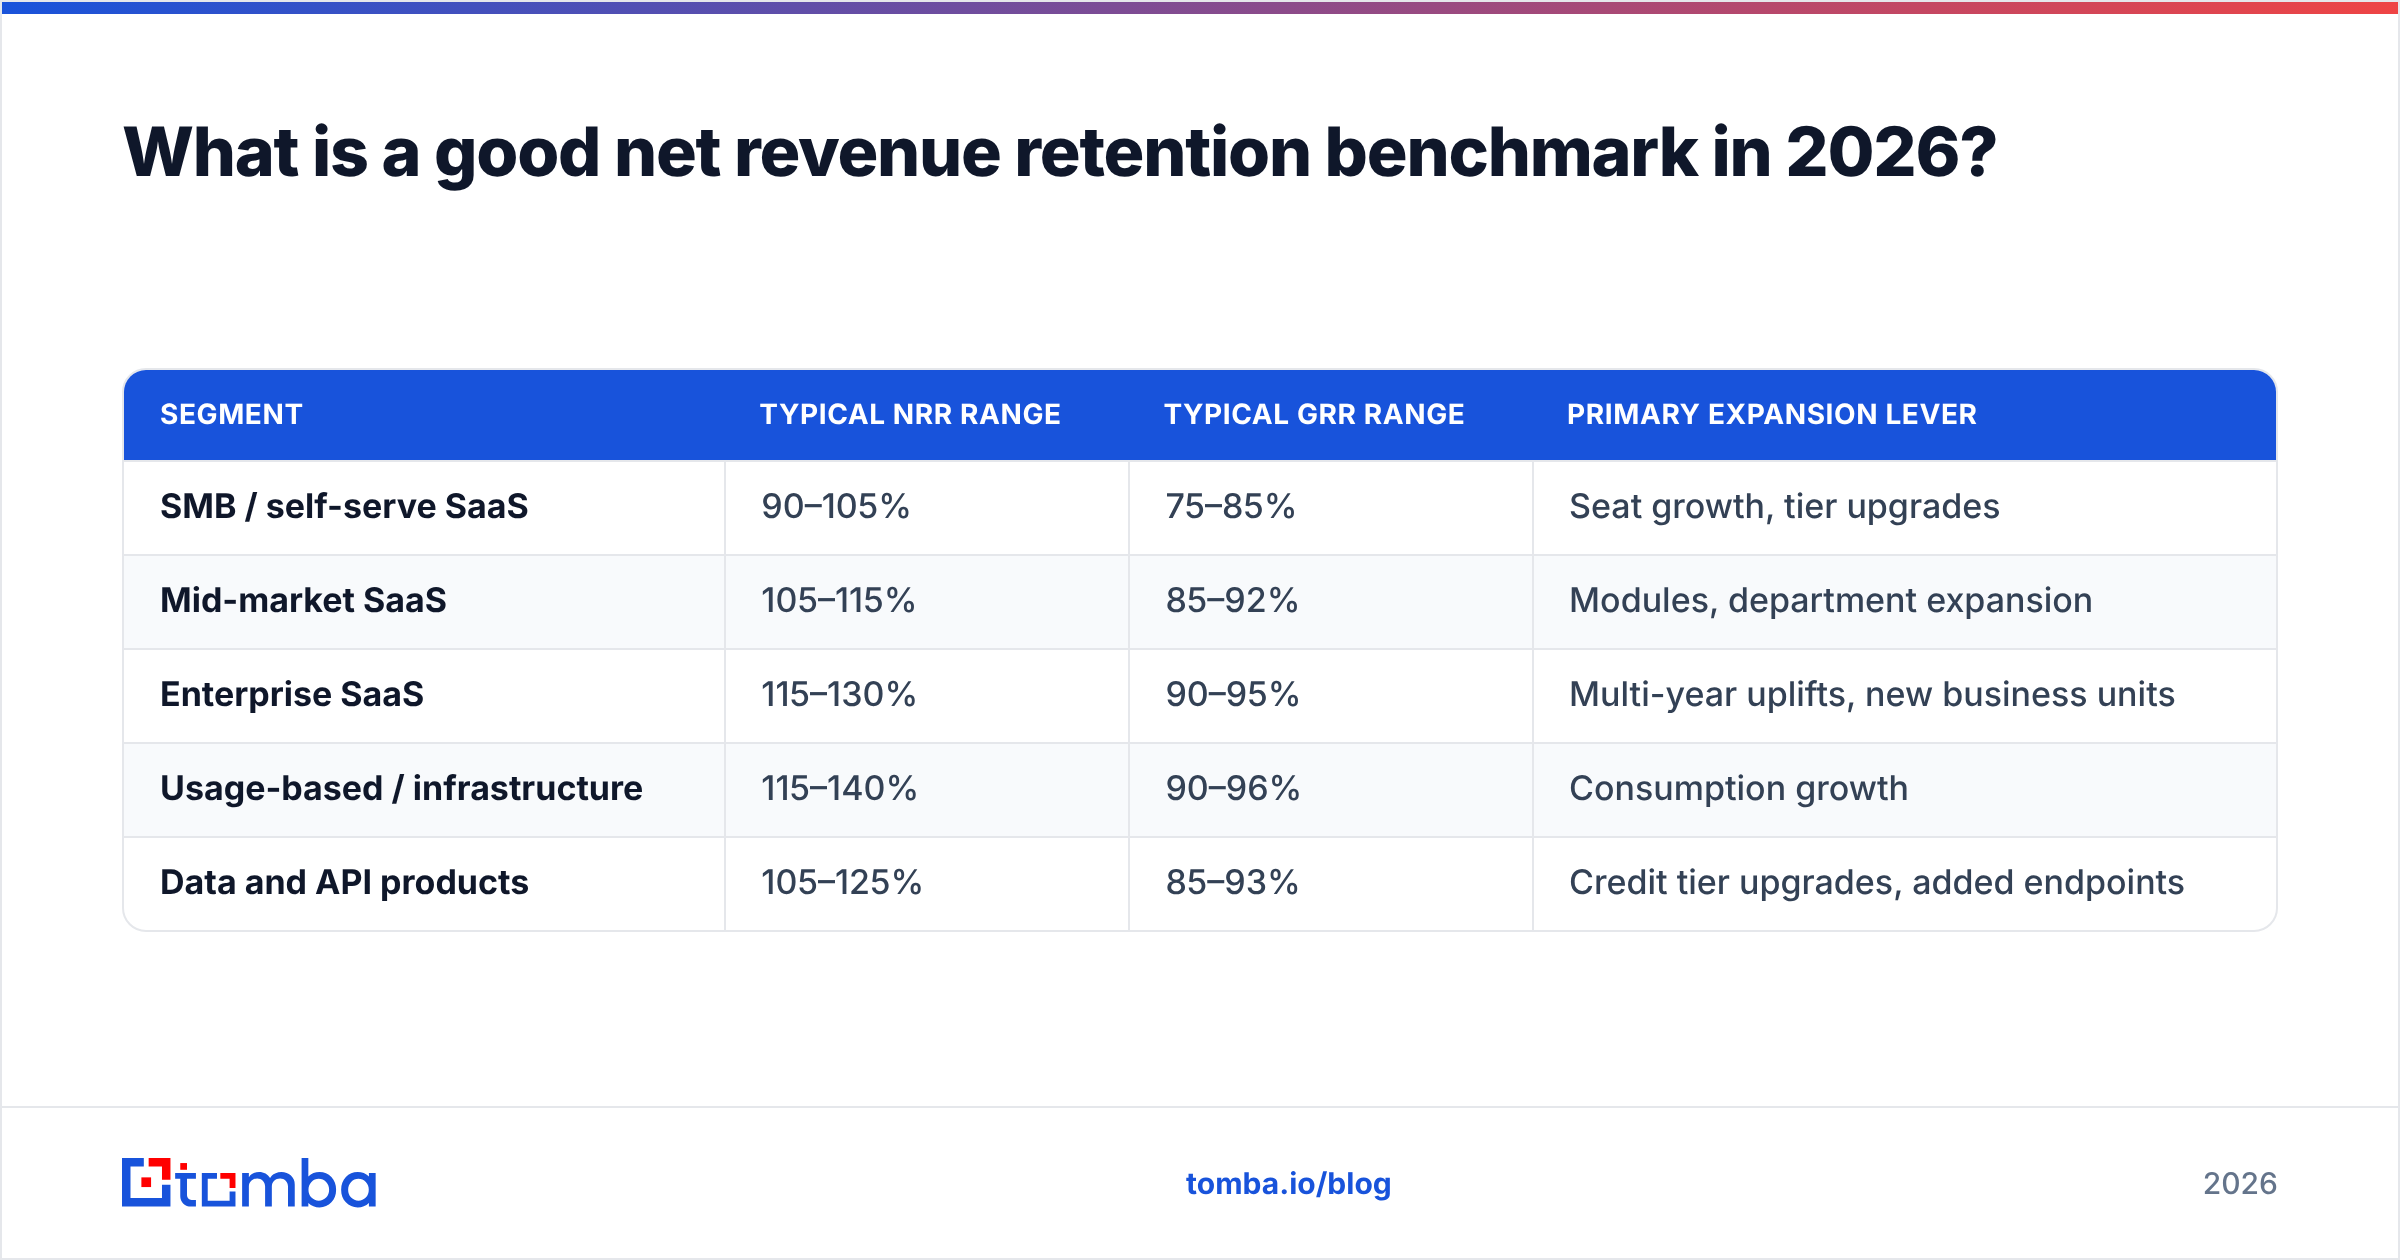
| Segment | Typical NRR range | Typical GRR range | Primary expansion lever |
|---|---|---|---|
| SMB / self-serve SaaS | 90–105% | 75–85% | Seat growth, tier upgrades |
| Mid-market SaaS | 105–115% | 85–92% | Modules, department expansion |
| Enterprise SaaS | 115–130% | 90–95% | Multi-year uplifts, new business units |
| Usage-based / infrastructure | 115–140% | 90–96% | Consumption growth |
| Data and API products | 105–125% | 85–93% | Credit tier upgrades, added endpoints |
Three read-outs from that table. First, SMB NRR below 100% is normal and not automatically a crisis — those businesses churn because their customers churn. Second, usage-based pricing structurally inflates NRR, which is why comparing a consumption product against a per-seat product is apples-to-oranges. Third, the gap between NRR and GRR is itself a metric: a spread wider than 30 points means your expansion motion is carrying a broken retention motion.
Where do teams get the NRR calculation wrong?#
Four mistakes account for most of the bad numbers we see in RevOps reviews.
- Including new logos in the numerator. Covered above, but it bears repeating because it is the most frequent error and always inflates the result. If your NRR magically rises during a strong sales quarter, your cohort logic is broken.
- Mixing currencies without normalization. A European customer whose contract is unchanged in euros can look like expansion or contraction purely from FX movement. Lock exchange rates at cohort start, or report NRR in constant currency and disclose it.
- Counting one-time revenue as recurring. Implementation fees, professional services, training days, and hardware are not recurring. Fold them in and your NRR swings wildly with services delivery timing rather than customer health.
- Treating a downgrade-then-cancel as double damage. If an account drops from $2,000 to $1,200 in March and cancels in September, the churn line should record $1,200, not $2,000. Otherwise you subtract the same $800 twice.
- Ignoring the reactivation question. Decide up front whether a customer who churns in month two and returns in month ten counts as recovered cohort revenue or as new business. Either policy is defensible; changing it mid-year is not.
Document your policy on each of these in a one-page metrics definition and get finance to sign it. A metric two departments calculate differently is not a metric, it is an argument.
How do you actually improve net revenue retention?#
Diagnose before you prescribe. Split your NRR into its three components and see which one is dominant.
If churn is the problem, the fix is almost always earlier in the funnel than customer success. Accounts that churn in months 2–6 usually should not have been sold in the first place — wrong company size, wrong use case, no internal champion. Tighten your ideal customer profile and your lead scoring rules before you hire another CSM.
If contraction dominates, look at packaging. Seat-based downgrades usually mean the product landed in one team and never spread. Usage downgrades often mean the customer over-bought on an optimistic first-year forecast, which is a sales incentive problem more than a product one.
If expansion is simply absent, you have a coverage problem. Most expansion revenue comes from selling into adjacent teams inside an account you already own — and most companies never systematically map those teams. This is where contact data quality becomes a retention issue rather than an acquisition one, which surprises people.

How does contact data quality affect NRR?#
More than most RevOps leaders expect, in two specific places.
Champion turnover. The average B2B software buyer changes jobs every 24–30 months. When your champion leaves and nobody notices for a quarter, renewal risk spikes and no one is watching. A monthly email verifier sweep across your CRM contact list surfaces those departures mechanically — hard bounces on a previously valid work address are a leading indicator of champion churn, often weeks before the account manager hears about it.
Expansion coverage. To sell a second department inside an existing account, you need names and reachable addresses for people your CSM has never met. Running a domain search against a customer's domain returns the broader org chart of reachable contacts, which turns "we should expand into their marketing team" from an aspiration into a named list. Layering data enrichment on top adds titles and seniority so you can route the right play to the right person.
Neither of these replaces a customer success motion. They remove the excuse that expansion targets are unknown. Companies like HubSpot and Salesforce built entire multi-product attach strategies on exactly this pattern: own one team, map the rest of the building, expand deliberately.
A practical cadence that works:
- Monthly — verify every contact on accounts renewing in the next two quarters. Flag bounces as champion-risk.
- Quarterly — run domain search on your top 50 accounts by ARR, diff against last quarter, and hand new decision-maker names to the account team.
- At renewal −90 days — enrich the full contact map so the renewal conversation includes at least two stakeholders, not one.
How often should you report NRR?#
Monthly for internal diagnosis, trailing-twelve-months for anything external.
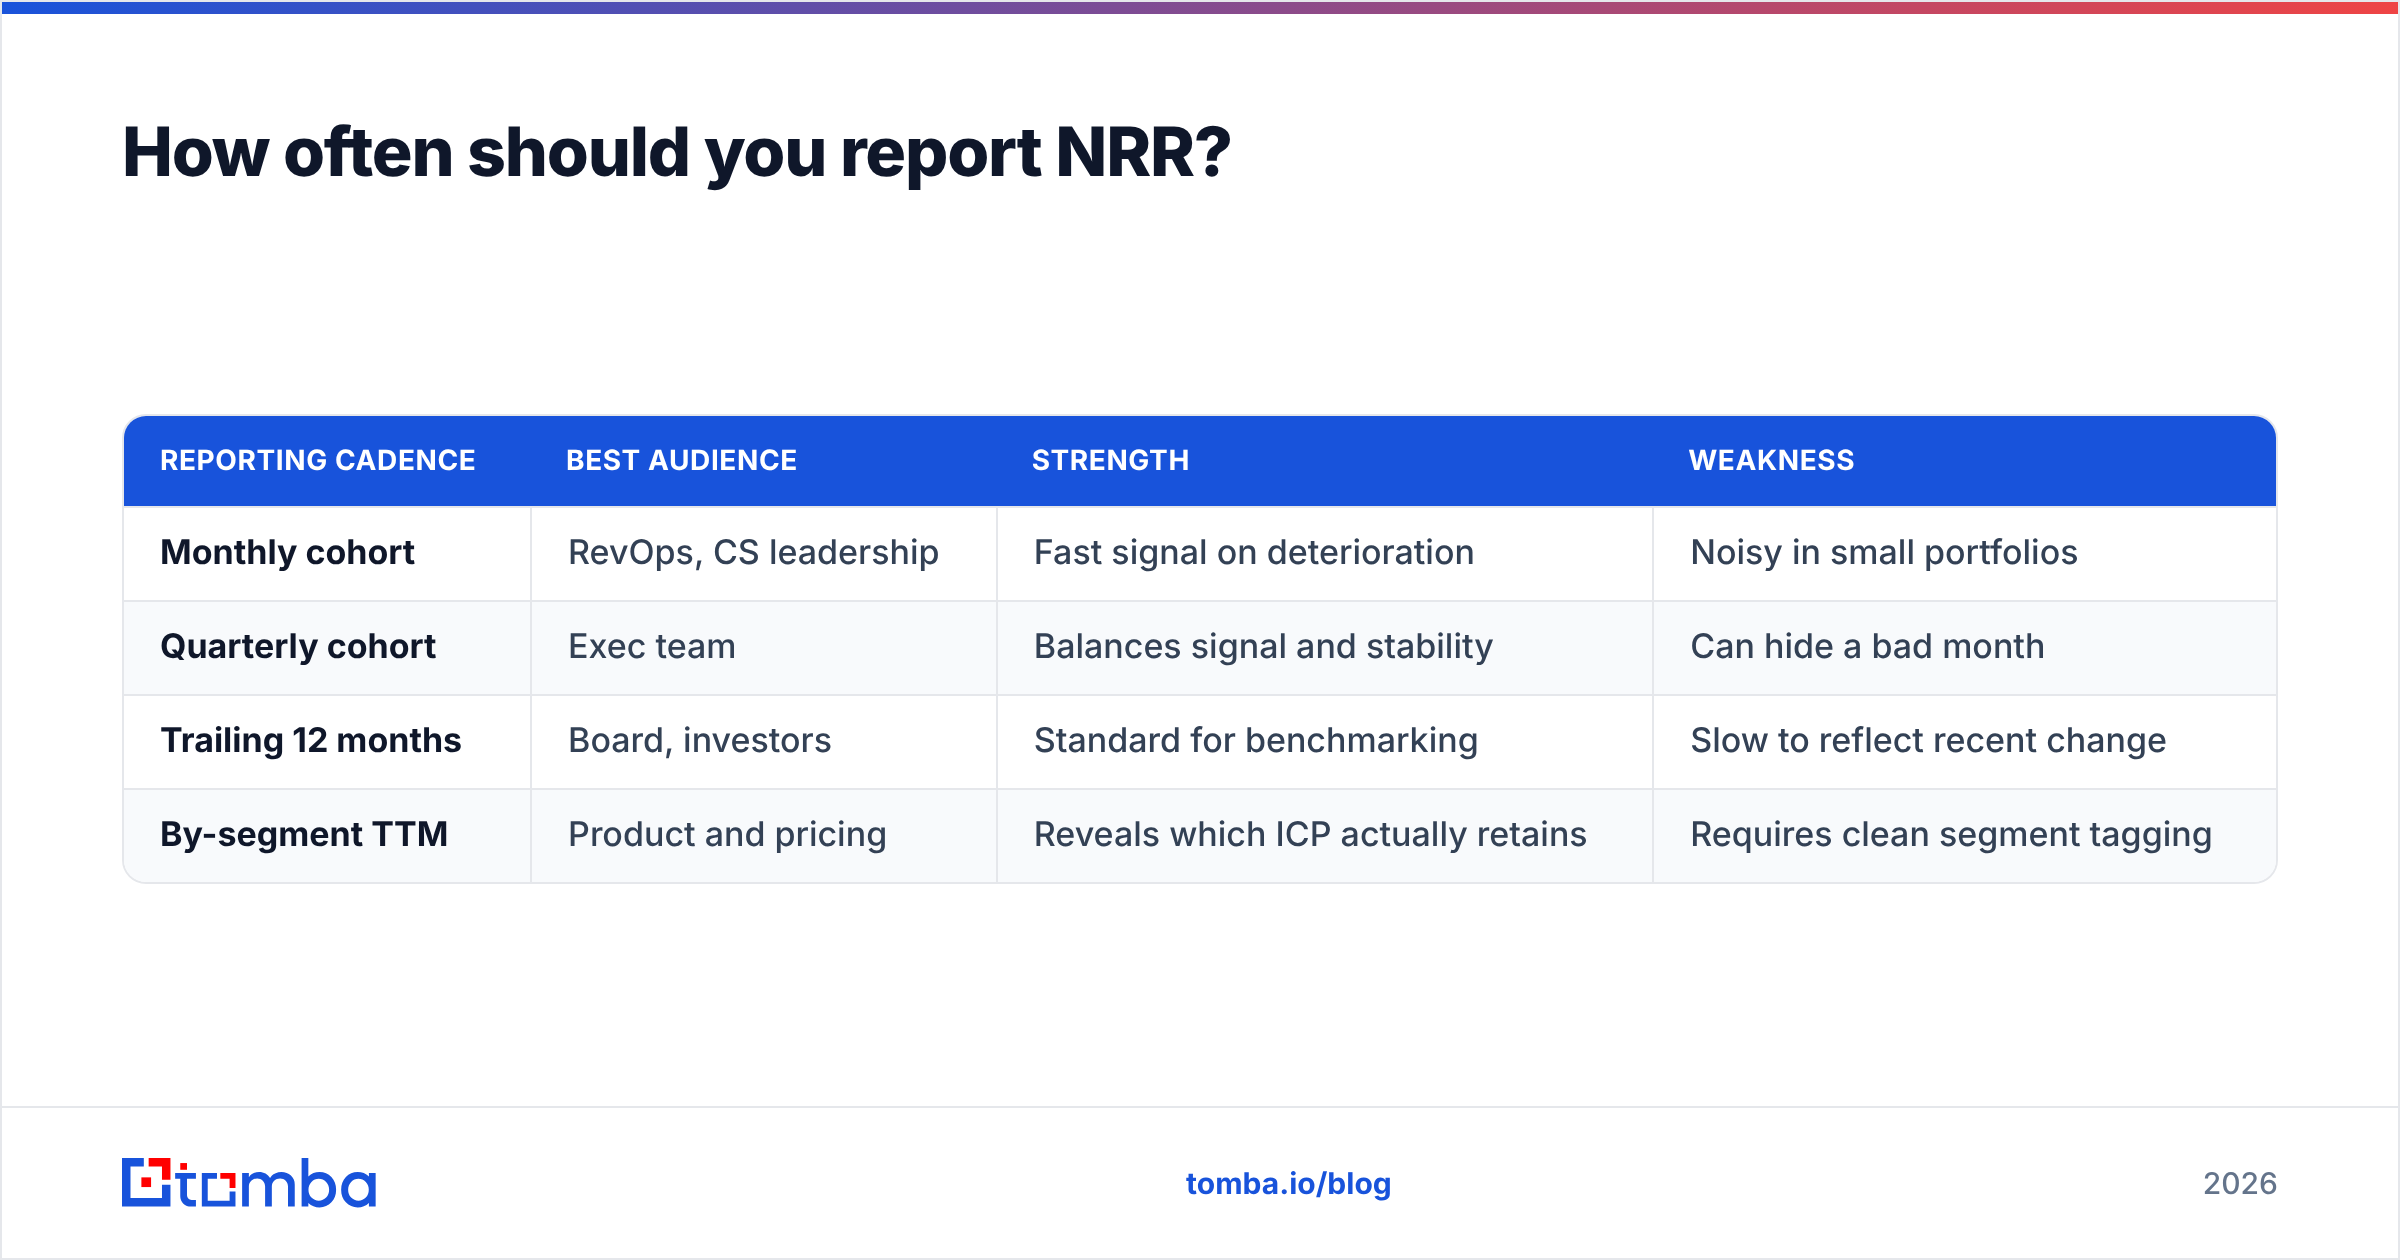
Monthly NRR is noisy — a single enterprise renewal can swing it ten points in a small portfolio — but it catches deterioration early. TTM NRR smooths that noise and is the figure investors and acquirers expect. Report both on the same slide, with the monthly series as a sparkline underneath the TTM headline, and annotate any month where a single account moved the number more than two points.
| Reporting cadence | Best audience | Strength | Weakness |
|---|---|---|---|
| Monthly cohort | RevOps, CS leadership | Fast signal on deterioration | Noisy in small portfolios |
| Quarterly cohort | Exec team | Balances signal and stability | Can hide a bad month |
| Trailing 12 months | Board, investors | Standard for benchmarking | Slow to reflect recent change |
| By-segment TTM | Product and pricing | Reveals which ICP actually retains | Requires clean segment tagging |
The by-segment view is the one most teams skip and the one that changes decisions fastest. Blended NRR of 107% can easily be enterprise at 128% and SMB at 84% — two different companies wearing one number. Split it, and your roadmap and pricing debates get shorter.
Where should you start this week?#
Rebuild one cohort by hand in a spreadsheet before you trust any dashboard. Take the accounts active twelve months ago, pull their recurring revenue then and now, exclude every logo signed since, and compute the ratio. If it disagrees with your BI tool by more than a point or two, your BI tool is wrong — and it has probably been wrong in your favor.
Then fix the input side. NRR is a downstream number; it reflects who you sold to eighteen months ago and how well you have mapped the accounts you already own. If your expansion pipeline is thin because nobody knows who else to contact inside your existing customers, start there.
Map your customer base before your next QBR. Run Tomba Email Finder against your top accounts to surface reachable decision-makers your CSMs have never contacted, verify the ones already in your CRM, and hand your account team a named expansion list instead of a wish. The free tier covers 25 searches a month so you can test it on a handful of accounts first; paid plans start at $49/month, with full Tomba pricing published upfront. Better contact coverage will not fix a weak product — but it will stop you from losing renewals to a champion who left in March and nobody noticed until September.
Related guides#
Ready to find emails that actually work?
Join 150,000+ professionals who stopped guessing and started sending. Free credits on signup — no credit card required.
Get the Tomba newsletter
Practical outbound tactics and product updates — once every two weeks.
About the author