How to Calculate Sales: Formulas, Metrics, and Worked Examples
Gross sales, net sales, growth rate, run rate, sales velocity, and forecast accuracy — every formula you need, with real numbers plugged in and the data-quality traps that quietly break each one.
TL;DR
- "Sales" is not one number. Gross sales, net sales, bookings, and recognized revenue can differ by 15–25% on the same quarter — pick the definition before you pick the formula.
- Net sales = gross sales − returns − discounts − allowances. That's the number your board and your CFO actually care about.
- Sales growth rate = (current period − prior period) ÷ prior period × 100. Run rate = one period × the number of periods in a year — and it lies whenever your business has any seasonality.
- Sales velocity ties four inputs together: (opportunities × average deal value × win rate) ÷ sales cycle length. It's the fastest diagnostic for why the number moved.
- Every formula here inherits the quality of your contact data. A 20% bounce rate silently inflates your conversion denominators and wrecks forecast accuracy long before the math does.
What does "calculate sales" actually mean?#
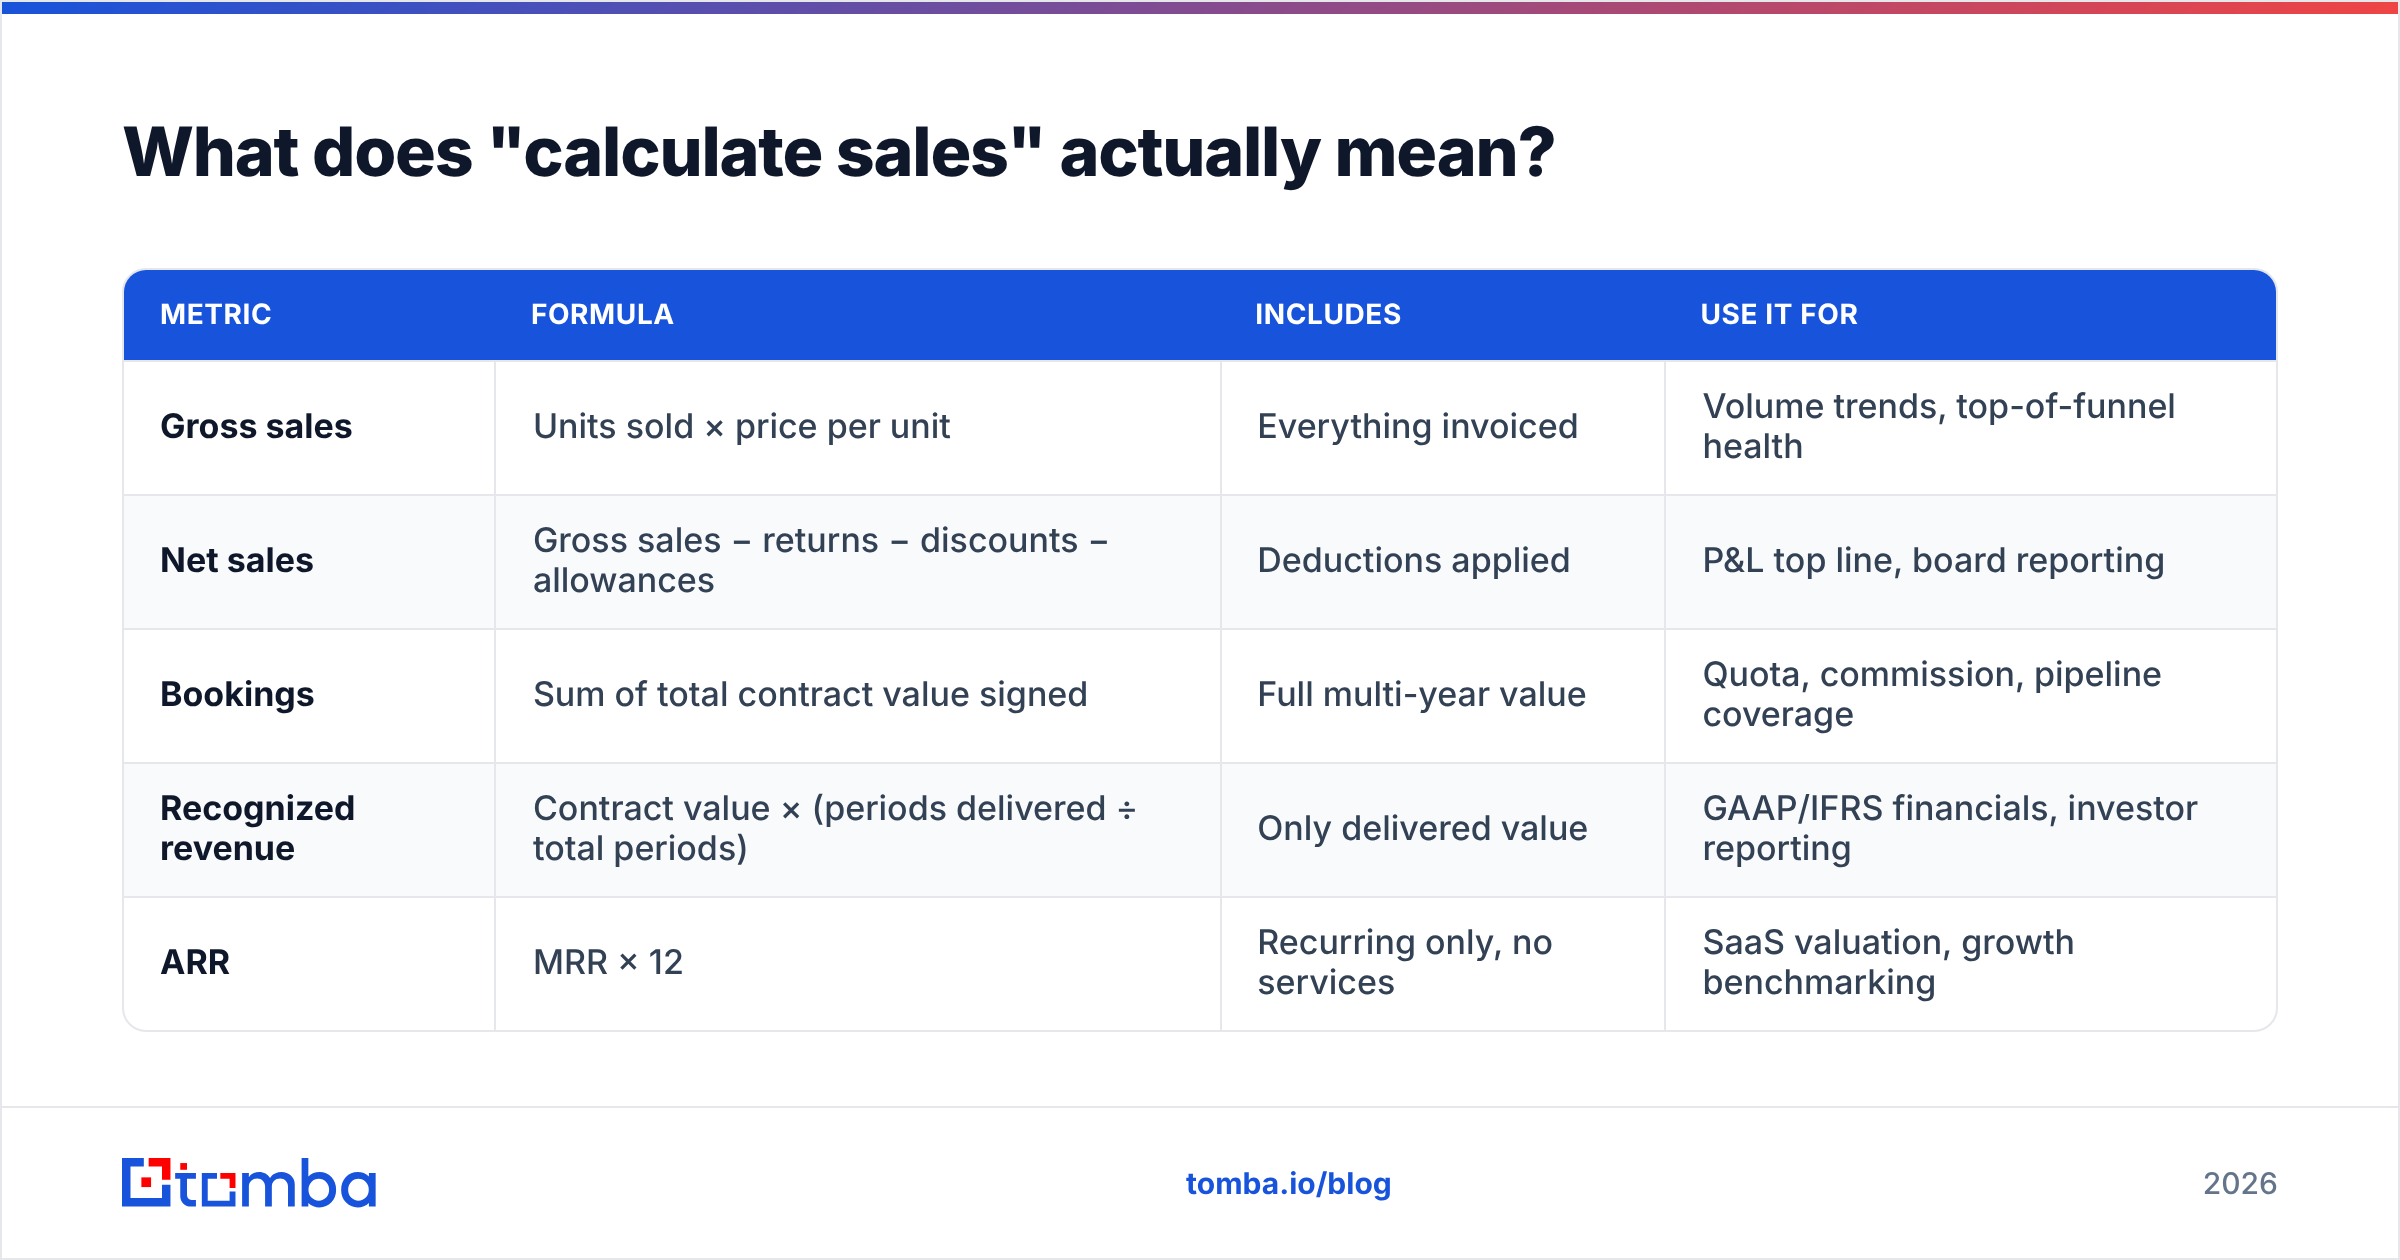
Before you learn how to calculate sales, settle which "sales" you mean. Four teams in the same company will hand you four different numbers for the same quarter and all four will be defensible.
- Gross sales — the raw total of everything invoiced, before any deductions. Marketing loves this number.
- Net sales — gross sales minus returns, discounts, and allowances. This is the top line on your income statement.
- Bookings — the total contract value signed in the period, regardless of when the cash or the service arrives. Sales leadership pays commission on this.
- Recognized revenue — the portion of a contract you're allowed to count now under accounting rules. A 24-month deal signed in March does not become 24 months of revenue in March. The revenue recognition principle governs this, and finance will not negotiate it with you.
- ARR / MRR — annualized or monthly recurring revenue, subscription businesses only, excluding one-time services.
Mixing these is the single most common reporting error in B2B. A rep who signs $600,000 of three-year contracts has $600,000 in bookings, $200,000 in ARR, and maybe $16,667 in recognized revenue for the month. All three statements are true.
| Metric | Formula | Includes | Use it for |
|---|---|---|---|
| Gross sales | Units sold × price per unit | Everything invoiced | Volume trends, top-of-funnel health |
| Net sales | Gross sales − returns − discounts − allowances | Deductions applied | P&L top line, board reporting |
| Bookings | Sum of total contract value signed | Full multi-year value | Quota, commission, pipeline coverage |
| Recognized revenue | Contract value × (periods delivered ÷ total periods) | Only delivered value | GAAP/IFRS financials, investor reporting |
| ARR | MRR × 12 | Recurring only, no services | SaaS valuation, growth benchmarking |
How do you calculate gross sales and net sales?#
Start with gross sales, then subtract your way down. Here is Q1 2026 for a mid-market SaaS team:
Gross sales = units × price = 64 deals × $7,531 average = $482,000
Now the deductions:
- Returns and refunds: $18,000
- Volume and promotional discounts: $11,500
- Allowances (credits issued for service issues): $4,500
Net sales = $482,000 − $18,000 − $11,500 − $4,500 = $448,000
That's a 7.1% gap between gross and net. If your forecast model is built on gross and your CFO's model is built on net, you will disagree by exactly that much every single quarter and nobody will know why.
Two rules that save you later:
- Deduct in the period the deduction occurs, not the period of the original sale — unless you're restating, which is finance's call, not yours.
- Never net out cost of goods sold here. Net sales is a top-line number. Subtracting COGS gives you gross profit, which is a different line entirely.

What are the core sales formulas you need?#
Six formulas cover roughly 90% of what a revenue team is ever asked to compute. Memorize these and you can rebuild any dashboard from scratch.
- Sales growth rate = (current period sales − prior period sales) ÷ prior period sales × 100. Q1 2026 net sales of $448,000 against Q1 2025 net sales of $392,000 gives ($448,000 − $392,000) ÷ $392,000 = 14.3% growth. Always compare like periods — Q1 to Q1, never Q1 to Q4.
- Average deal size = total net sales ÷ number of closed-won deals. $448,000 ÷ 64 = $7,000. Watch the median too; one $90,000 enterprise deal will drag the mean somewhere your reps can't reach.
- Win rate = closed-won ÷ (closed-won + closed-lost) × 100. 64 wins against 227 total closed opportunities = 28.2%. Excluding stalled deals from the denominator inflates this — decide your stale-deal rule and hold it. If you need the formal definition, Tomba's glossary entry on win rate spells out the edge cases.
- Sales run rate = period sales × periods per year. March net sales of $172,000 × 12 = $2,064,000 annualized.
- Sales velocity = (number of opportunities × average deal value × win rate) ÷ sales cycle length in days. With 120 open opportunities, $7,000 average value, a 22% win rate, and a 45-day cycle: (120 × $7,000 × 0.22) ÷ 45 = $4,107 per day. Every one of those four inputs is a lever.
- Quota attainment = actual sales ÷ quota × 100. A rep closing $186,000 against a $200,000 quota lands at 93%. Track the distribution across the team, not just the average — an average of 100% built from two heroes and six reps at 55% is a hiring problem, not a good quarter.
How do you calculate sales growth rate over multiple periods?#
Single-period growth is easy. Multi-period growth is where people quietly cheat by averaging percentages, which is wrong.
Use compound annual growth rate (CAGR) instead:
CAGR = ((ending value ÷ beginning value)^(1 ÷ number of years)) − 1
Sales went from $1.42M in 2023 to $2.31M in 2026 — three years of growth. ($2.31M ÷ $1.42M) = 1.627. Raise that to the power of 1/3 = 1.176. Subtract 1 = 17.6% CAGR.
Compare that to the naive method: growth of 22%, 9%, and 22% averaged as (22 + 9 + 22) ÷ 3 = 17.7%. Close here, but the gap widens fast with volatile years. A sequence of +100% then −50% averages to +25% while the actual compound result is 0%. Always compound.
For month-over-month reporting, add a trailing-twelve-month (TTM) view alongside raw monthly numbers. TTM smooths seasonality without hiding a real decline the way a rolling three-month average does.
Is sales run rate reliable enough to forecast with?#
Run rate is the fastest calculation on this list and the easiest to misuse. It is reliable in exactly one scenario: a steady-state business with no seasonality, no deal lumpiness, and no expansion motion.
Run rate breaks when:
- You annualize your best month. December closed at $172,000 because five deals slipped from November into it. The $2.06M annualized figure is fiction.
- Your business is seasonal. Annualizing Q4 in retail-adjacent B2B, or annualizing August in European markets, produces a number nobody should plan headcount against.
- You have a long sales cycle. With a 90-day cycle, a single month reflects pipeline generated a quarter ago, not current demand.
- A large contract landed. One $150,000 booking in a $170,000 month means you're annualizing an event, not a rate.
The repair is simple: run rate off a trailing quarter or a trailing twelve months instead of a single month, and state the assumption on the slide. $448,000 in Q1 × 4 = $1.79M annualized is far more defensible than the single-month version, and the difference between the two ($270,000) is itself a useful signal about how lumpy your revenue is.
How do you calculate a sales forecast that survives contact with the quarter?#
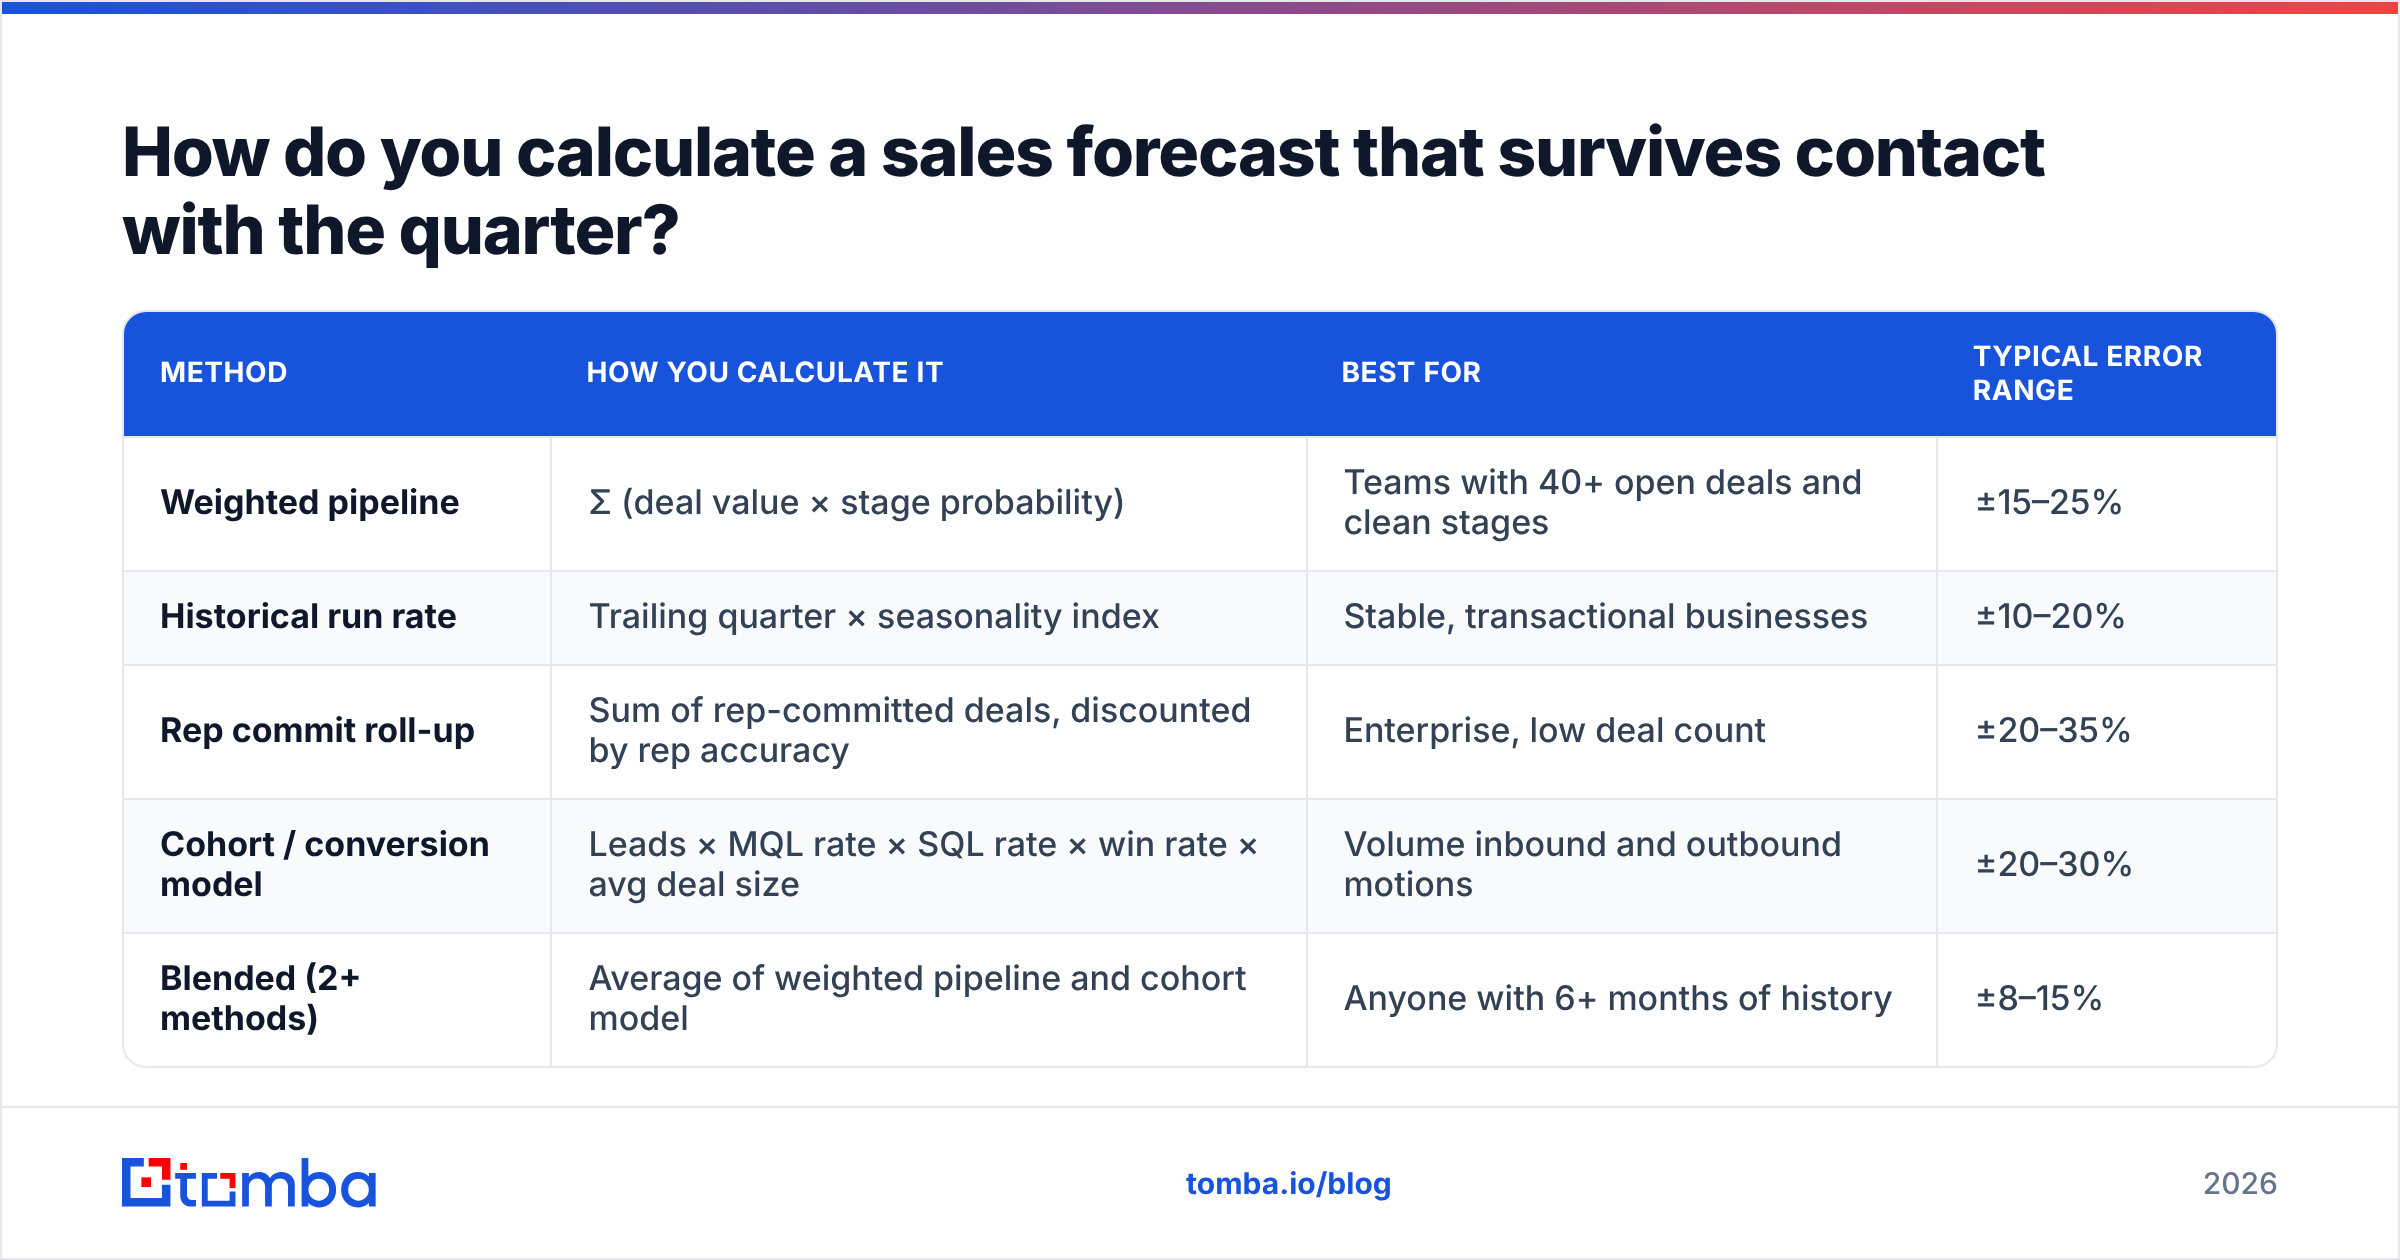
Four methods, ordered by how much data they demand. Most teams should run two in parallel and treat the spread between them as their confidence interval.
| Method | How you calculate it | Best for | Typical error range |
|---|---|---|---|
| Weighted pipeline | Σ (deal value × stage probability) | Teams with 40+ open deals and clean stages | ±15–25% |
| Historical run rate | Trailing quarter × seasonality index | Stable, transactional businesses | ±10–20% |
| Rep commit roll-up | Sum of rep-committed deals, discounted by rep accuracy | Enterprise, low deal count | ±20–35% |
| Cohort / conversion model | Leads × MQL rate × SQL rate × win rate × avg deal size | Volume inbound and outbound motions | ±20–30% |
| Blended (2+ methods) | Average of weighted pipeline and cohort model | Anyone with 6+ months of history | ±8–15% |
A worked weighted-pipeline example. Your open pipeline:
- Discovery: $640,000 at 10% = $64,000
- Demo completed: $410,000 at 30% = $123,000
- Proposal sent: $285,000 at 55% = $156,750
- Contract out: $190,000 at 85% = $161,500
Weighted forecast = $505,250 against $1,525,000 of raw pipeline. Your pipeline coverage ratio is $1,525,000 ÷ $448,000 target = 3.4x, which sits inside the 3–4x range most B2B teams target. Gartner's sales research and practitioner benchmarks from HubSpot's sales blog both land in that neighborhood, though your own historical win rate beats any published benchmark — calculate coverage as 1 ÷ your win rate and use that.
Critical caveat: stage probabilities must be derived from your own closed-won history, not copied from a CRM template. If deals at "proposal sent" historically close 41% of the time, using the default 60% overstates your forecast by nearly a third at that stage alone.
What data quality problems break your sales math?#
Every formula above assumes your inputs are real. In outbound-led teams, they frequently aren't — and the corruption enters at the top of the funnel where nobody audits it.
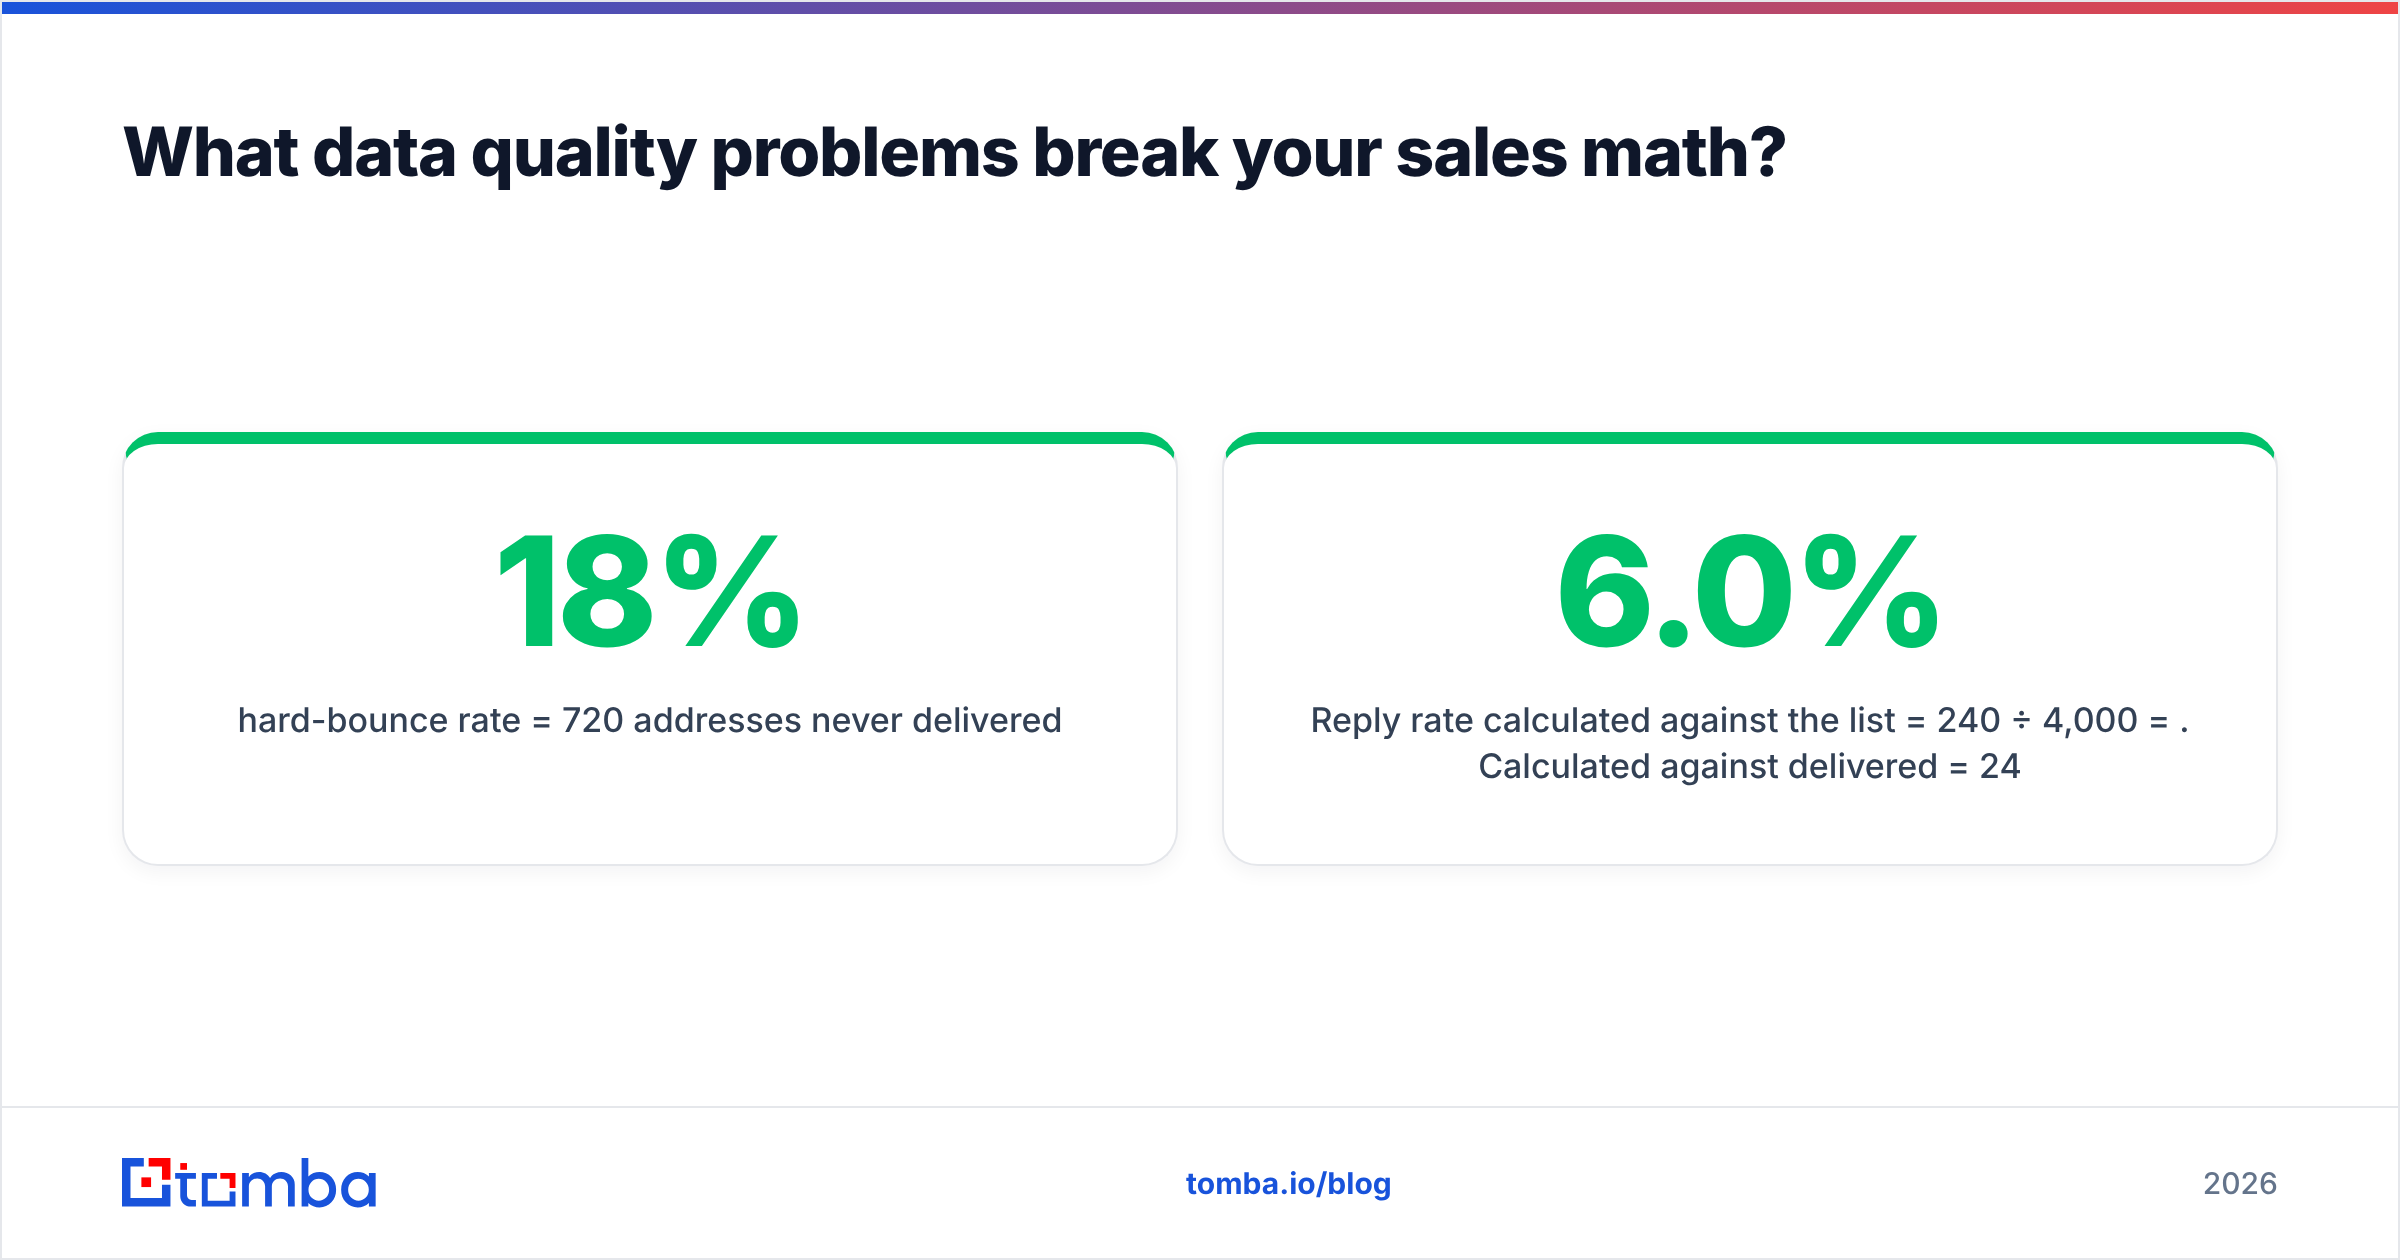
Consider a campaign to 4,000 contacts:
- 18% hard-bounce rate = 720 addresses never delivered
- 3,280 delivered, 240 replies
Reply rate calculated against the list = 240 ÷ 4,000 = 6.0%. Calculated against delivered = 240 ÷ 3,280 = 7.3%. The second number is the real one. Report the first and you'll under-invest in a channel that's actually working, then miscalculate the lead volume needed to hit next quarter's target by roughly 20%.
It gets worse downstream. Bad contact data inflates opportunity counts with records that were never reachable, which depresses your calculated win rate, which flows into your weighted pipeline probabilities, which corrupts the forecast. One dirty input, four broken metrics.
Three fixes that cost less than the reporting cleanup:
- Verify before you send. Running lists through an email verifier pulls bounce rates into the low single digits, which keeps your denominators honest and protects sender reputation at the same time.
- Enrich before you segment. Contact enrichment fills in company size, role, and industry so your average-deal-size and win-rate calculations can be sliced by segment instead of reported as one meaningless blended number.
- Deduplicate before you count. Duplicate records double-count opportunities and quietly halve your calculated conversion rates. A bulk email finder workflow with dedupe built in stops the problem at import rather than at reporting.

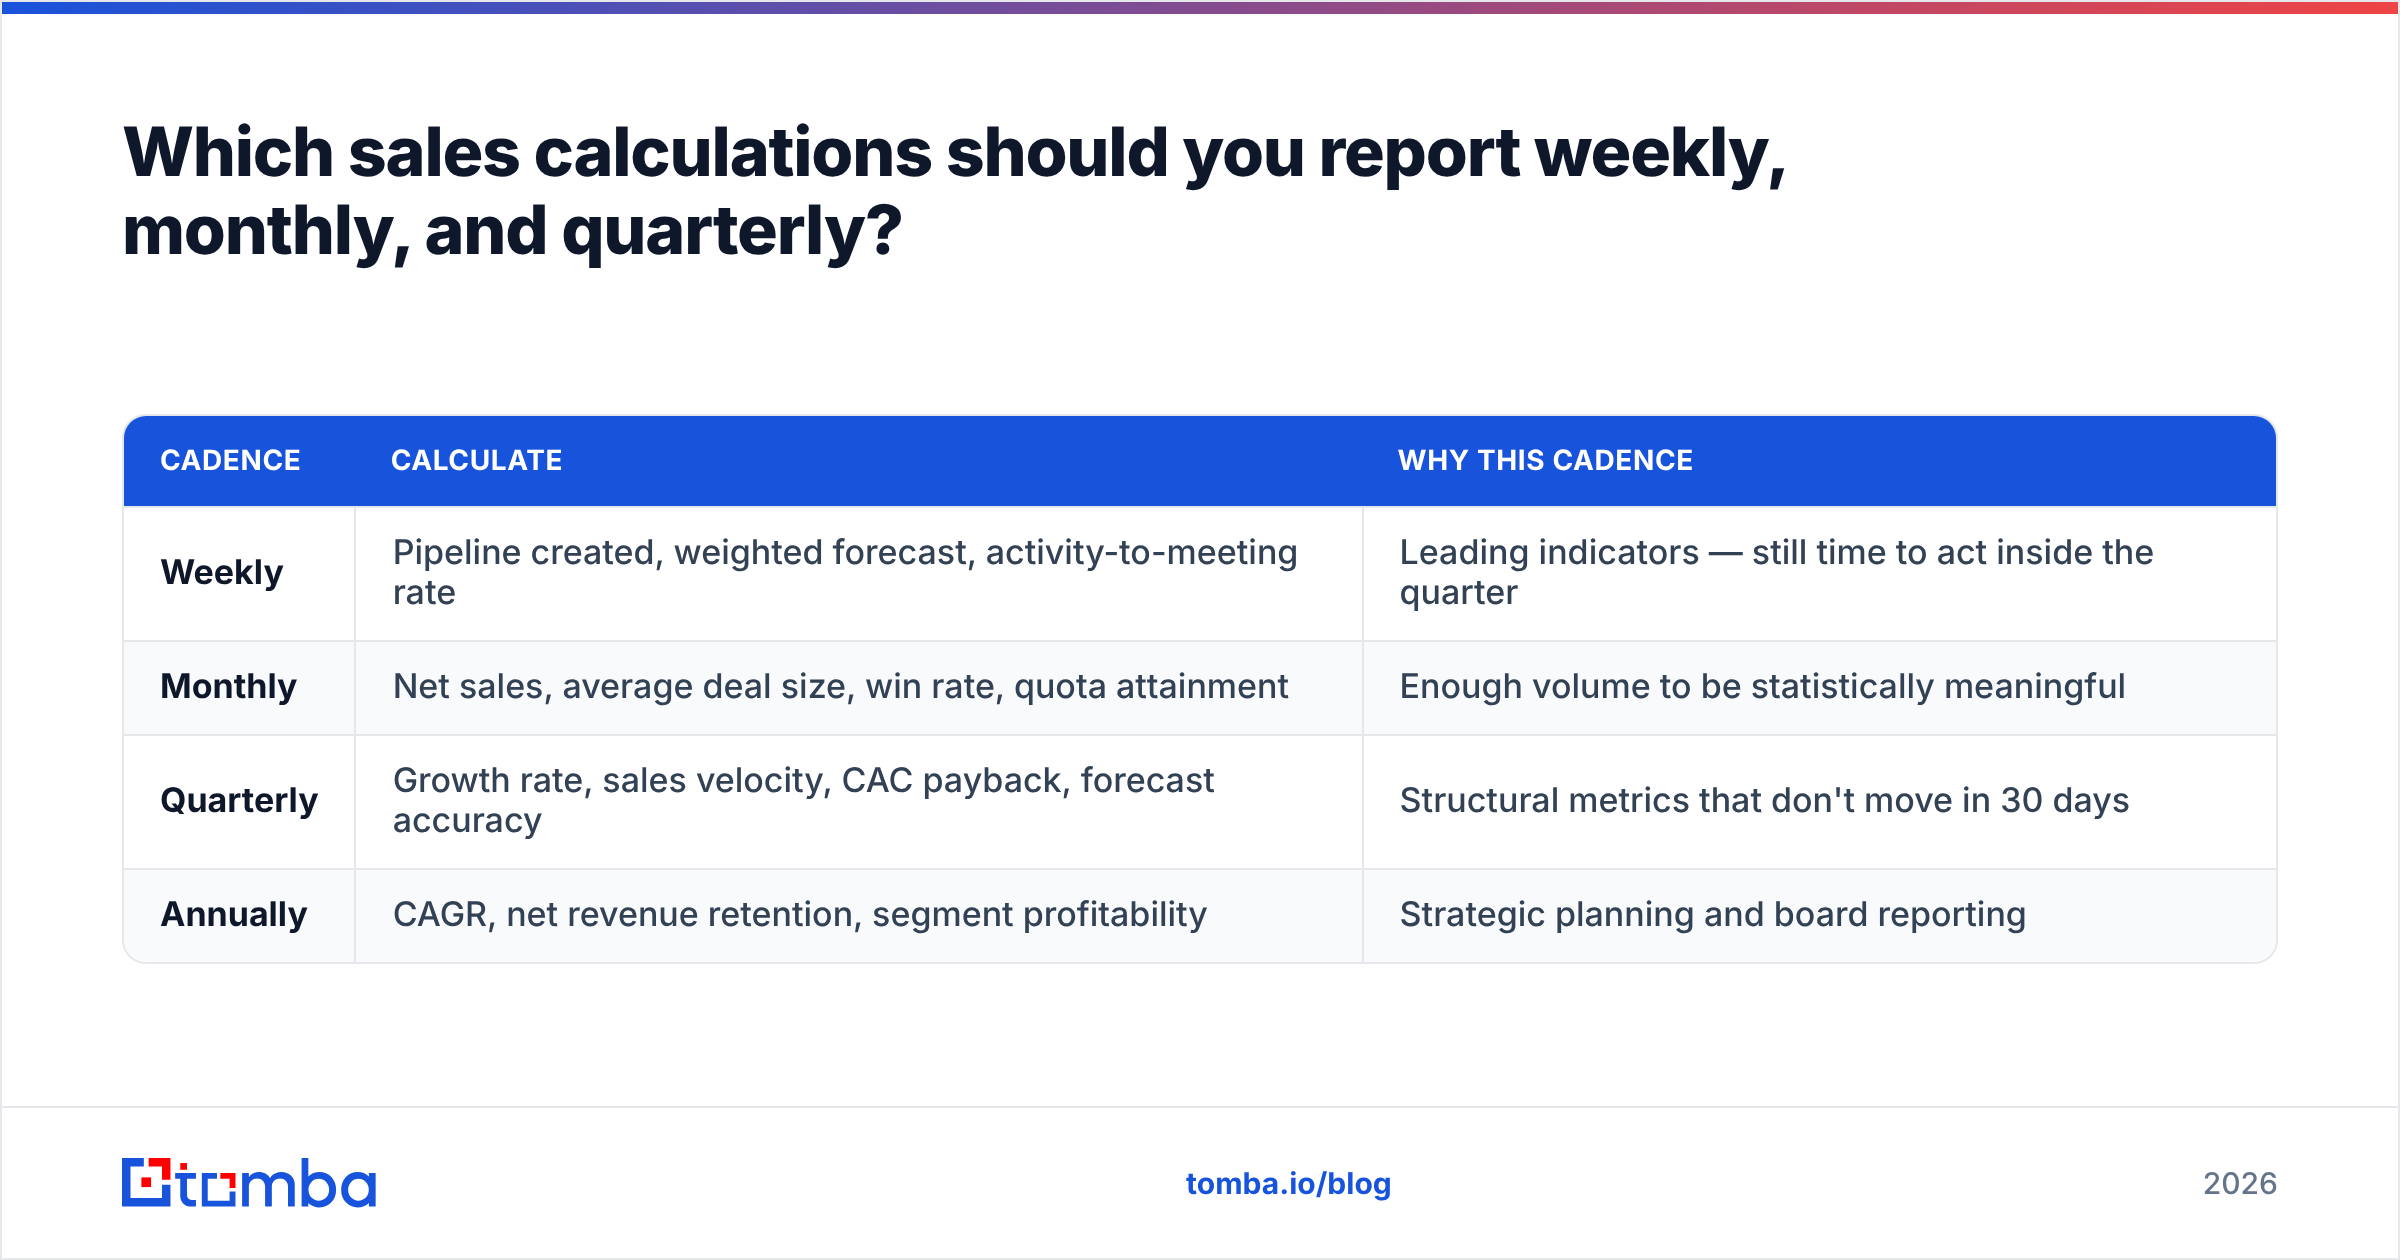
Which sales calculations should you report weekly, monthly, and quarterly?#
Reporting cadence matters more than most teams admit. Calculate a metric too often and you're reading noise; too rarely and you find out about the miss when it's unfixable.
| Cadence | Calculate | Why this cadence |
|---|---|---|
| Weekly | Pipeline created, weighted forecast, activity-to-meeting rate | Leading indicators — still time to act inside the quarter |
| Monthly | Net sales, average deal size, win rate, quota attainment | Enough volume to be statistically meaningful |
| Quarterly | Growth rate, sales velocity, CAC payback, forecast accuracy | Structural metrics that don't move in 30 days |
| Annually | CAGR, net revenue retention, segment profitability | Strategic planning and board reporting |
One metric deserves special mention: forecast accuracy = 1 − (|forecast − actual| ÷ actual). Forecasting $505,000 against an actual $448,000 gives 1 − (57,000 ÷ 448,000) = 87.3% accurate. Track this every quarter for every forecasting method you run. Within a year you'll know empirically which method to trust, and your stage probabilities will be calibrated to reality instead of to whatever your CRM shipped with. Platforms like Salesforce will happily compute the roll-up for you, but they cannot fix the probabilities you feed them.
What's the fastest way to start calculating sales correctly?#
Do these five things in order:
- Write down your definition of "sales" — gross, net, bookings, or recognized — and put it in the footer of every report.
- Pull 12 months of closed-won and closed-lost data and derive your real stage probabilities and win rate.
- Rebuild your forecast on weighted pipeline plus one second method, and track the spread.
- Audit your contact data for bounces and duplicates before you trust any conversion percentage.
- Start logging forecast accuracy every period. It is the only metric that tells you whether the other calculations are working.
Steps 1 through 3 are analysis. Step 4 is infrastructure — and it's the one most teams skip, then spend a quarter wondering why the model keeps missing.
If your outbound numbers are the ones feeding the model, start there. Tomba's Email Finder returns verified professional addresses by domain, name, or company, with confidence scoring and sources on every result, so the contacts entering your pipeline are real before they ever reach a formula. The free tier covers 25 searches a month to test your existing list quality; paid plans start at $49/mo, with Growth at $99/mo and Pro at $249/mo — see Tomba pricing for full credit allocations. Clean inputs first, then the math takes care of itself.
Related guides#
Ready to find emails that actually work?
Join 150,000+ professionals who stopped guessing and started sending. Free credits on signup — no credit card required.
Get the Tomba newsletter
Practical outbound tactics and product updates — once every two weeks.
About the author