How To Calculate Sales Efficiency: Formulas, Benchmarks, Fixes
Sales efficiency tells you how many dollars of revenue each dollar of sales and marketing spend actually buys. Here are the four formulas that matter, the benchmarks to judge them against, and the levers that move the number.
TL;DR
- Sales efficiency = new revenue generated ÷ sales and marketing spend that generated it. The simplest version: divide new ARR by last period's S&M cost.
- Four formulas cover 95% of what boards actually ask for: the Magic Number, LTV:CAC, CAC payback period, and revenue per rep.
- A Magic Number above 0.75 usually means "spend more." Below 0.5 means "fix the funnel before you spend another dollar."
- Most efficiency problems are data problems. Reps burning hours on bounced emails and wrong-number dials show up as a bad ratio months later.
- Efficiency is a ratio, not a score. You improve it by raising the numerator (win rate, deal size) or lowering the denominator (wasted spend, wasted rep hours) — pick one deliberately.
What is sales efficiency, exactly?#
Sales efficiency measures how much revenue you get back for every dollar you put into sales and marketing. That's it. If you spend $1,000,000 on a quarter of sales and marketing and it produces $800,000 in new annual recurring revenue, your sales efficiency is 0.8.
Think of it like fuel economy in a car. Horsepower tells you how fast you can go; miles per gallon tells you how far you can go on what's in the tank. Revenue growth is horsepower. Sales efficiency is your MPG. A company growing 80% year over year while burning $3 for every $1 of new revenue is a fast car with a hole in the fuel line.
The technical framing: efficiency ratios normalize growth against the cost of acquiring it, which lets you compare a 12-person startup to a 400-person org, or this quarter to last, without the raw numbers lying to you.
Two things people constantly confuse:
- Sales efficiency ≠ sales productivity. Productivity is output per rep (calls, meetings, closed deals). Efficiency is output per dollar. A rep can be highly productive and still be an efficiency disaster if their fully loaded cost is $220,000 and they close $180,000.
- Sales efficiency ≠ sales effectiveness. Effectiveness is about win rates and deal quality. Efficiency is about cost. You can improve one while wrecking the other.
How do you calculate sales efficiency? The four core formulas#
There isn't one formula — there are four, and each answers a different question. Run all four; disagreements between them are where the insight lives.
The Magic Number (SaaS Magic Number) — Is it safe to spend more? Take the increase in quarterly recurring revenue, multiply by 4 to annualize it, and divide by the prior quarter's sales and marketing spend. Formula:
(Current Qtr Revenue − Prior Qtr Revenue) × 4 ÷ Prior Qtr S&M Spend. Above 0.75 means the growth engine returns capital fast enough to justify pouring more in.LTV:CAC ratio — Is each customer worth what we paid for them? Divide customer lifetime value by customer acquisition cost. LTV = average revenue per account × gross margin ÷ churn rate. The commonly cited healthy target is 3:1. Below 1:1 you are paying to lose money; above 5:1 you are almost certainly underinvesting in growth.
CAC payback period — How long until we get our money back? Divide CAC by (monthly recurring revenue per new customer × gross margin). The answer is in months. Under 12 months is strong for SMB motions; 18-24 months is normal for enterprise; past 30 months you have a cash-flow problem disguised as a growth story.
Revenue per rep (and per fully loaded rep dollar) — Is the team itself efficient? Divide new bookings by the number of quota-carrying reps, then again by their fully loaded cost (salary + commission + tools + management overhead, typically 1.4-1.8× base salary).
Sales efficiency ratio (the blunt one) — One number for the board. New revenue in a period ÷ total S&M spend in the same period. Less rigorous than the Magic Number because it doesn't account for the lag between spend and revenue, but it's the one everyone understands in a slide.

What do the numbers actually mean? A benchmark table#
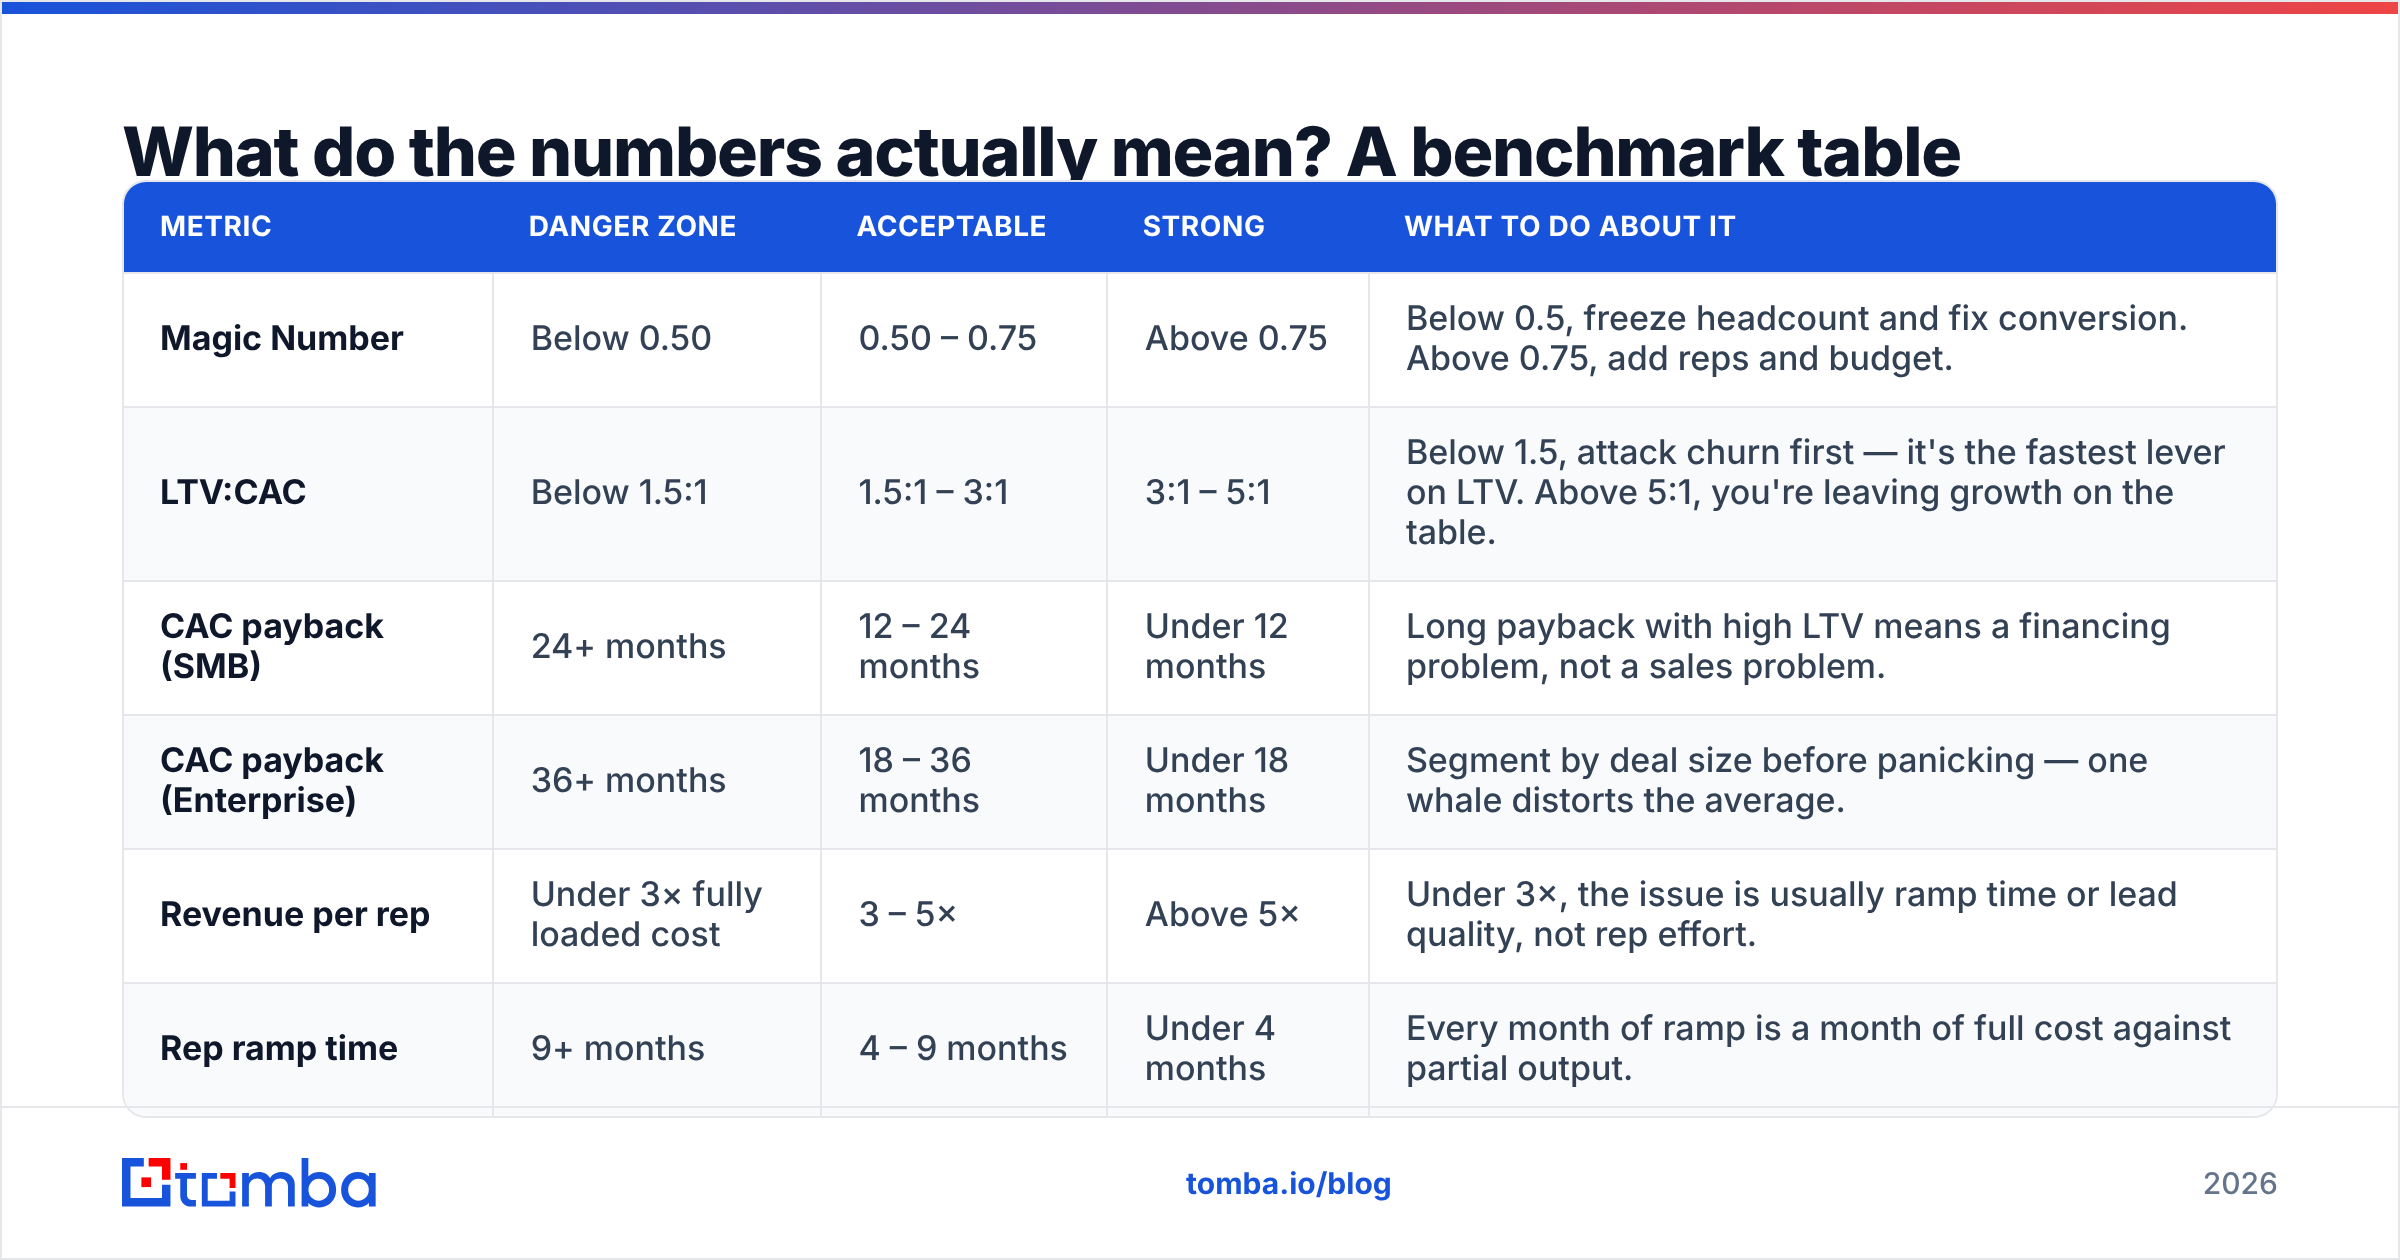
Raw ratios are meaningless without a band to judge them against. Here's how the four metrics map to action.
| Metric | Danger zone | Acceptable | Strong | What to do about it |
|---|---|---|---|---|
| Magic Number | Below 0.50 | 0.50 – 0.75 | Above 0.75 | Below 0.5, freeze headcount and fix conversion. Above 0.75, add reps and budget. |
| LTV:CAC | Below 1.5:1 | 1.5:1 – 3:1 | 3:1 – 5:1 | Below 1.5, attack churn first — it's the fastest lever on LTV. Above 5:1, you're leaving growth on the table. |
| CAC payback (SMB) | 24+ months | 12 – 24 months | Under 12 months | Long payback with high LTV means a financing problem, not a sales problem. |
| CAC payback (Enterprise) | 36+ months | 18 – 36 months | Under 18 months | Segment by deal size before panicking — one whale distorts the average. |
| Revenue per rep | Under 3× fully loaded cost | 3 – 5× | Above 5× | Under 3×, the issue is usually ramp time or lead quality, not rep effort. |
| Rep ramp time | 9+ months | 4 – 9 months | Under 4 months | Every month of ramp is a month of full cost against partial output. |
Sources worth checking your own numbers against: Gartner's sales research publishes recurring benchmark studies on cost-of-sale, and vendor-neutral review data on G2 gives you a rough sense of what tooling spend peers are carrying per seat.
Why do most sales efficiency calculations give you the wrong answer?#
Because of four accounting mistakes that quietly inflate or deflate the ratio.
You're using the wrong time period. Sales and marketing spend in Q1 produces revenue in Q2 or Q3, especially in enterprise. If you divide Q1 revenue by Q1 spend, you're comparing this quarter's harvest to this quarter's planting. Lag the denominator by at least one quarter — this is exactly why the Magic Number uses prior-quarter spend.
You're mixing new and expansion revenue. Expansion revenue from existing accounts costs far less to acquire than net-new logos. Blending them makes your acquisition engine look better than it is. Calculate new-logo efficiency and expansion efficiency separately. A company with a 0.9 blended Magic Number and 0.3 on new logos is a retention business pretending to be a growth business.
Your S&M denominator is incomplete. Fully loaded means base + commission + benefits + tooling + SDR costs + marketing programs + the sales ops and enablement headcount that exists to support the team. Most teams undercount by 25-40% by leaving out ops, tools, and management.
You're averaging across segments that behave nothing alike. A self-serve motion and a field-sales motion in the same average produce a number that describes neither. Segment by motion, then by deal size band, before you compare anything.
How does data quality change your sales efficiency number?#
More than almost any other input, and it shows up in the denominator where nobody looks for it.
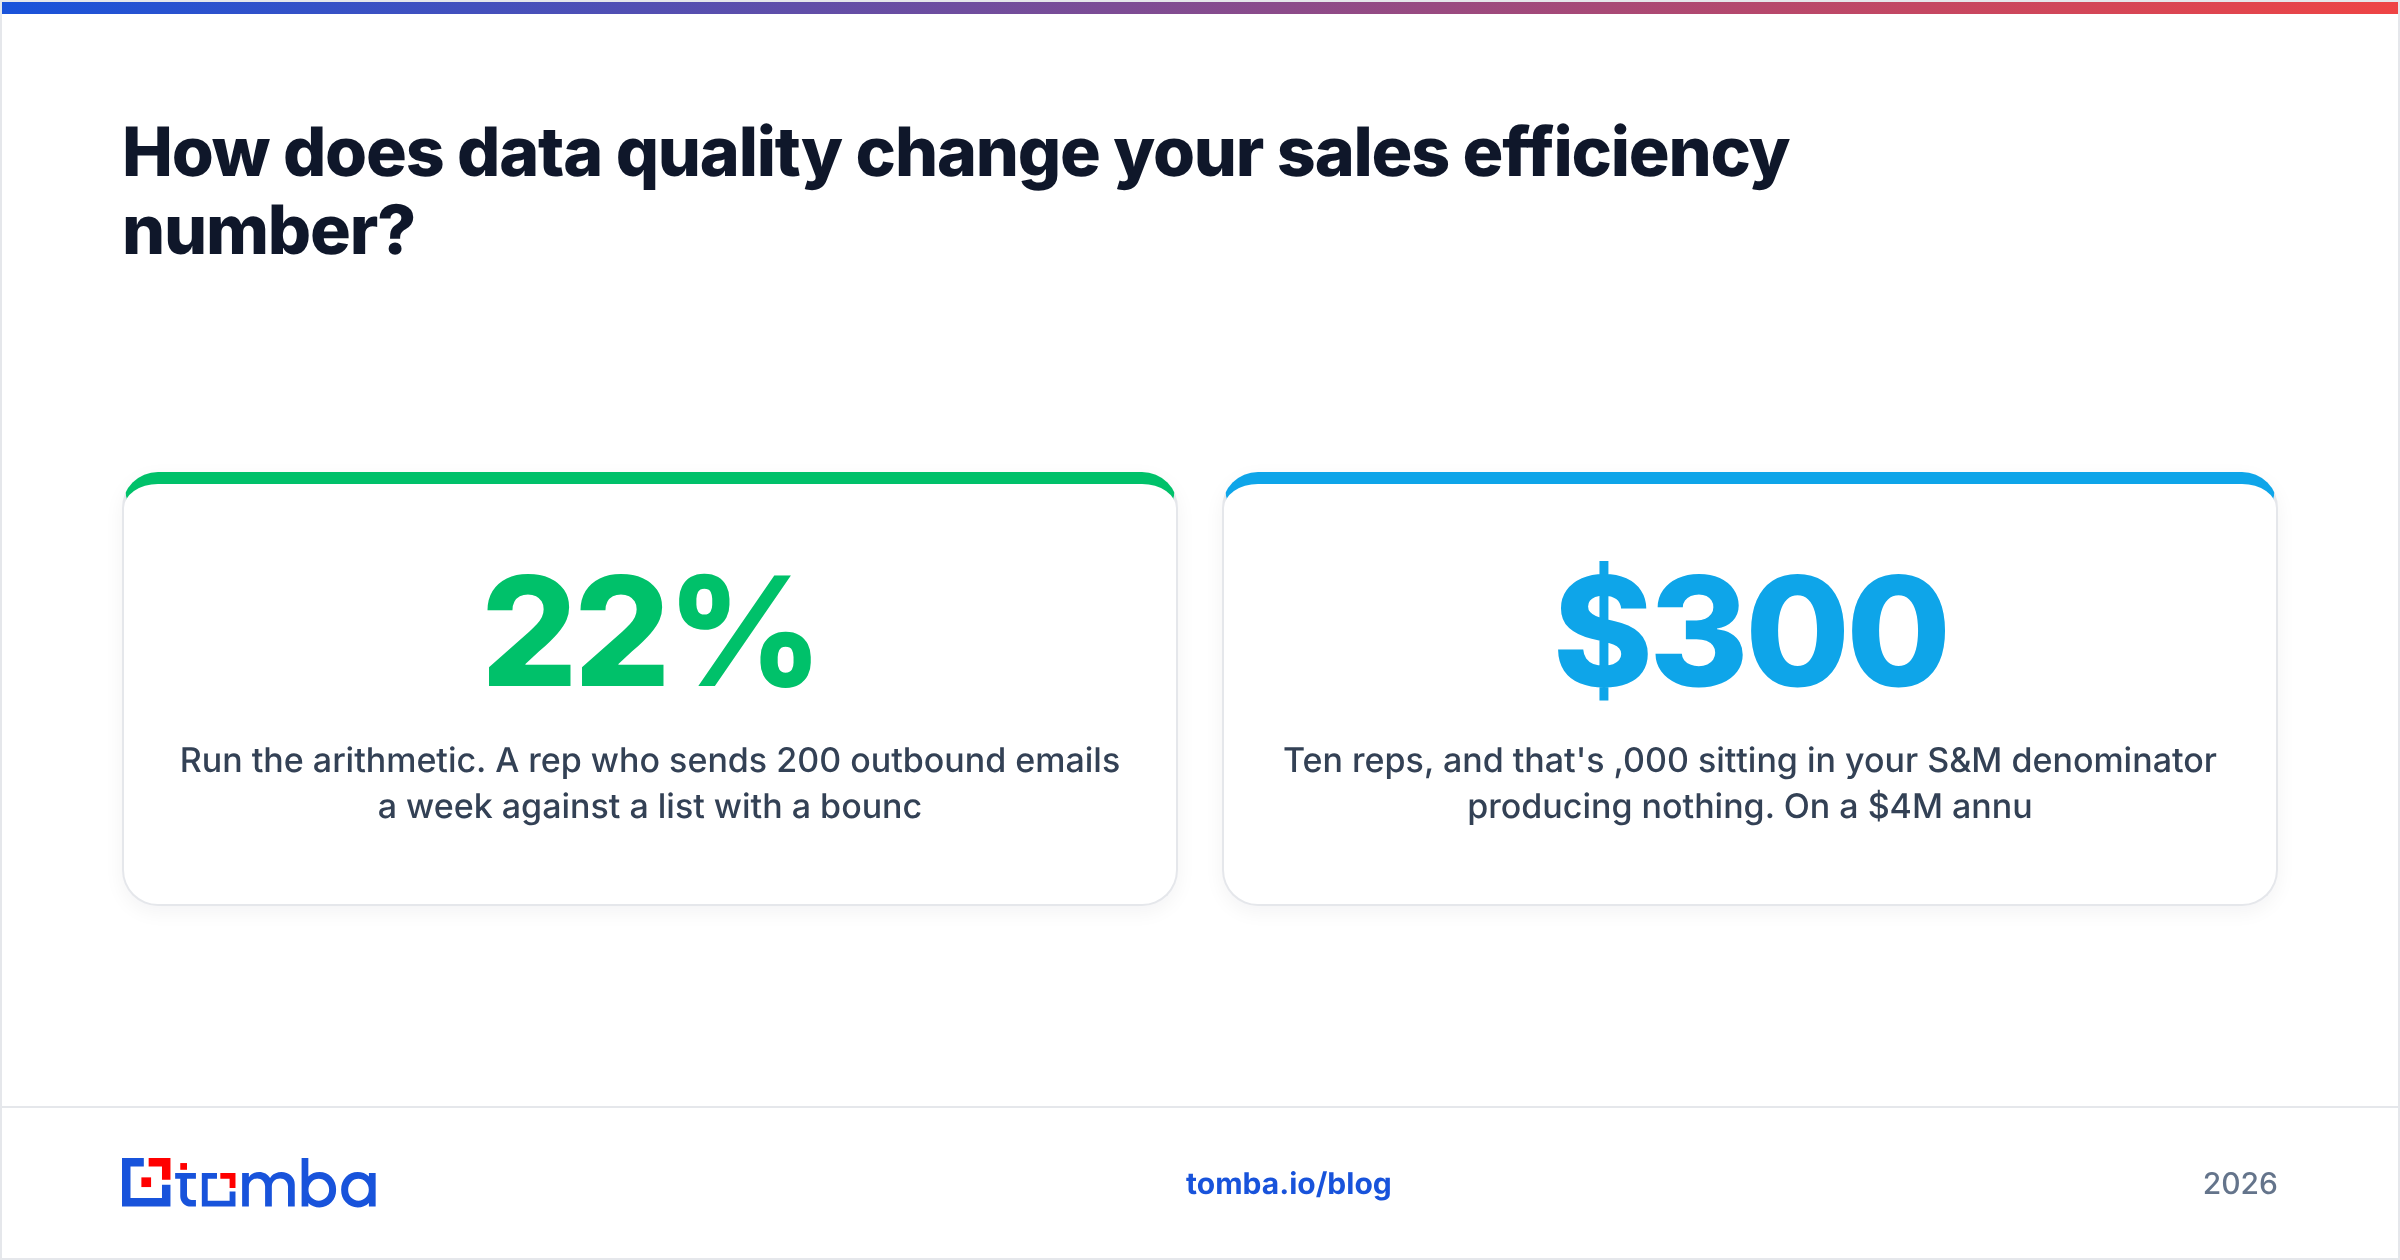
Run the arithmetic. A rep who sends 200 outbound emails a week against a list with a 22% bounce rate is generating 44 dead sends weekly. Add the research time to build those contacts, the deliverability damage that suppresses the other 156, and the follow-up cycles chasing people who never received anything. At a fully loaded cost of $180,000 per rep, and with roughly 15-20% of prospecting time going into contact research and cleanup, you're spending $27,000-$36,000 per rep per year on list hygiene work that produces zero pipeline.
Ten reps, and that's $300,000 sitting in your S&M denominator producing nothing. On a $4M annual S&M budget generating $3.2M in new ARR, cleaning that up moves your efficiency ratio from 0.80 to 0.86 without adding a single meeting.
The chain is mechanical:
- Bad email data → bounces → sender reputation damage → lower deliverability on your good contacts → fewer replies per hour of rep effort.
- Missing direct dials → gatekeeper time → fewer conversations per calling block.
- Stale titles and job changes → wrong-persona pitches → longer cycles and lower win rates, which hits the numerator.
- Duplicate records → the same prospect getting hit by two reps → brand damage and wasted spend on both sides.
Running contacts through an email verifier before a sequence goes out, and using data enrichment to keep titles and companies current, is unglamorous denominator work. It's also the fastest efficiency lever available to most teams because it requires no new headcount and no new process — just cleaner inputs into the process you already run.
How do you improve sales efficiency? Numerator vs denominator#
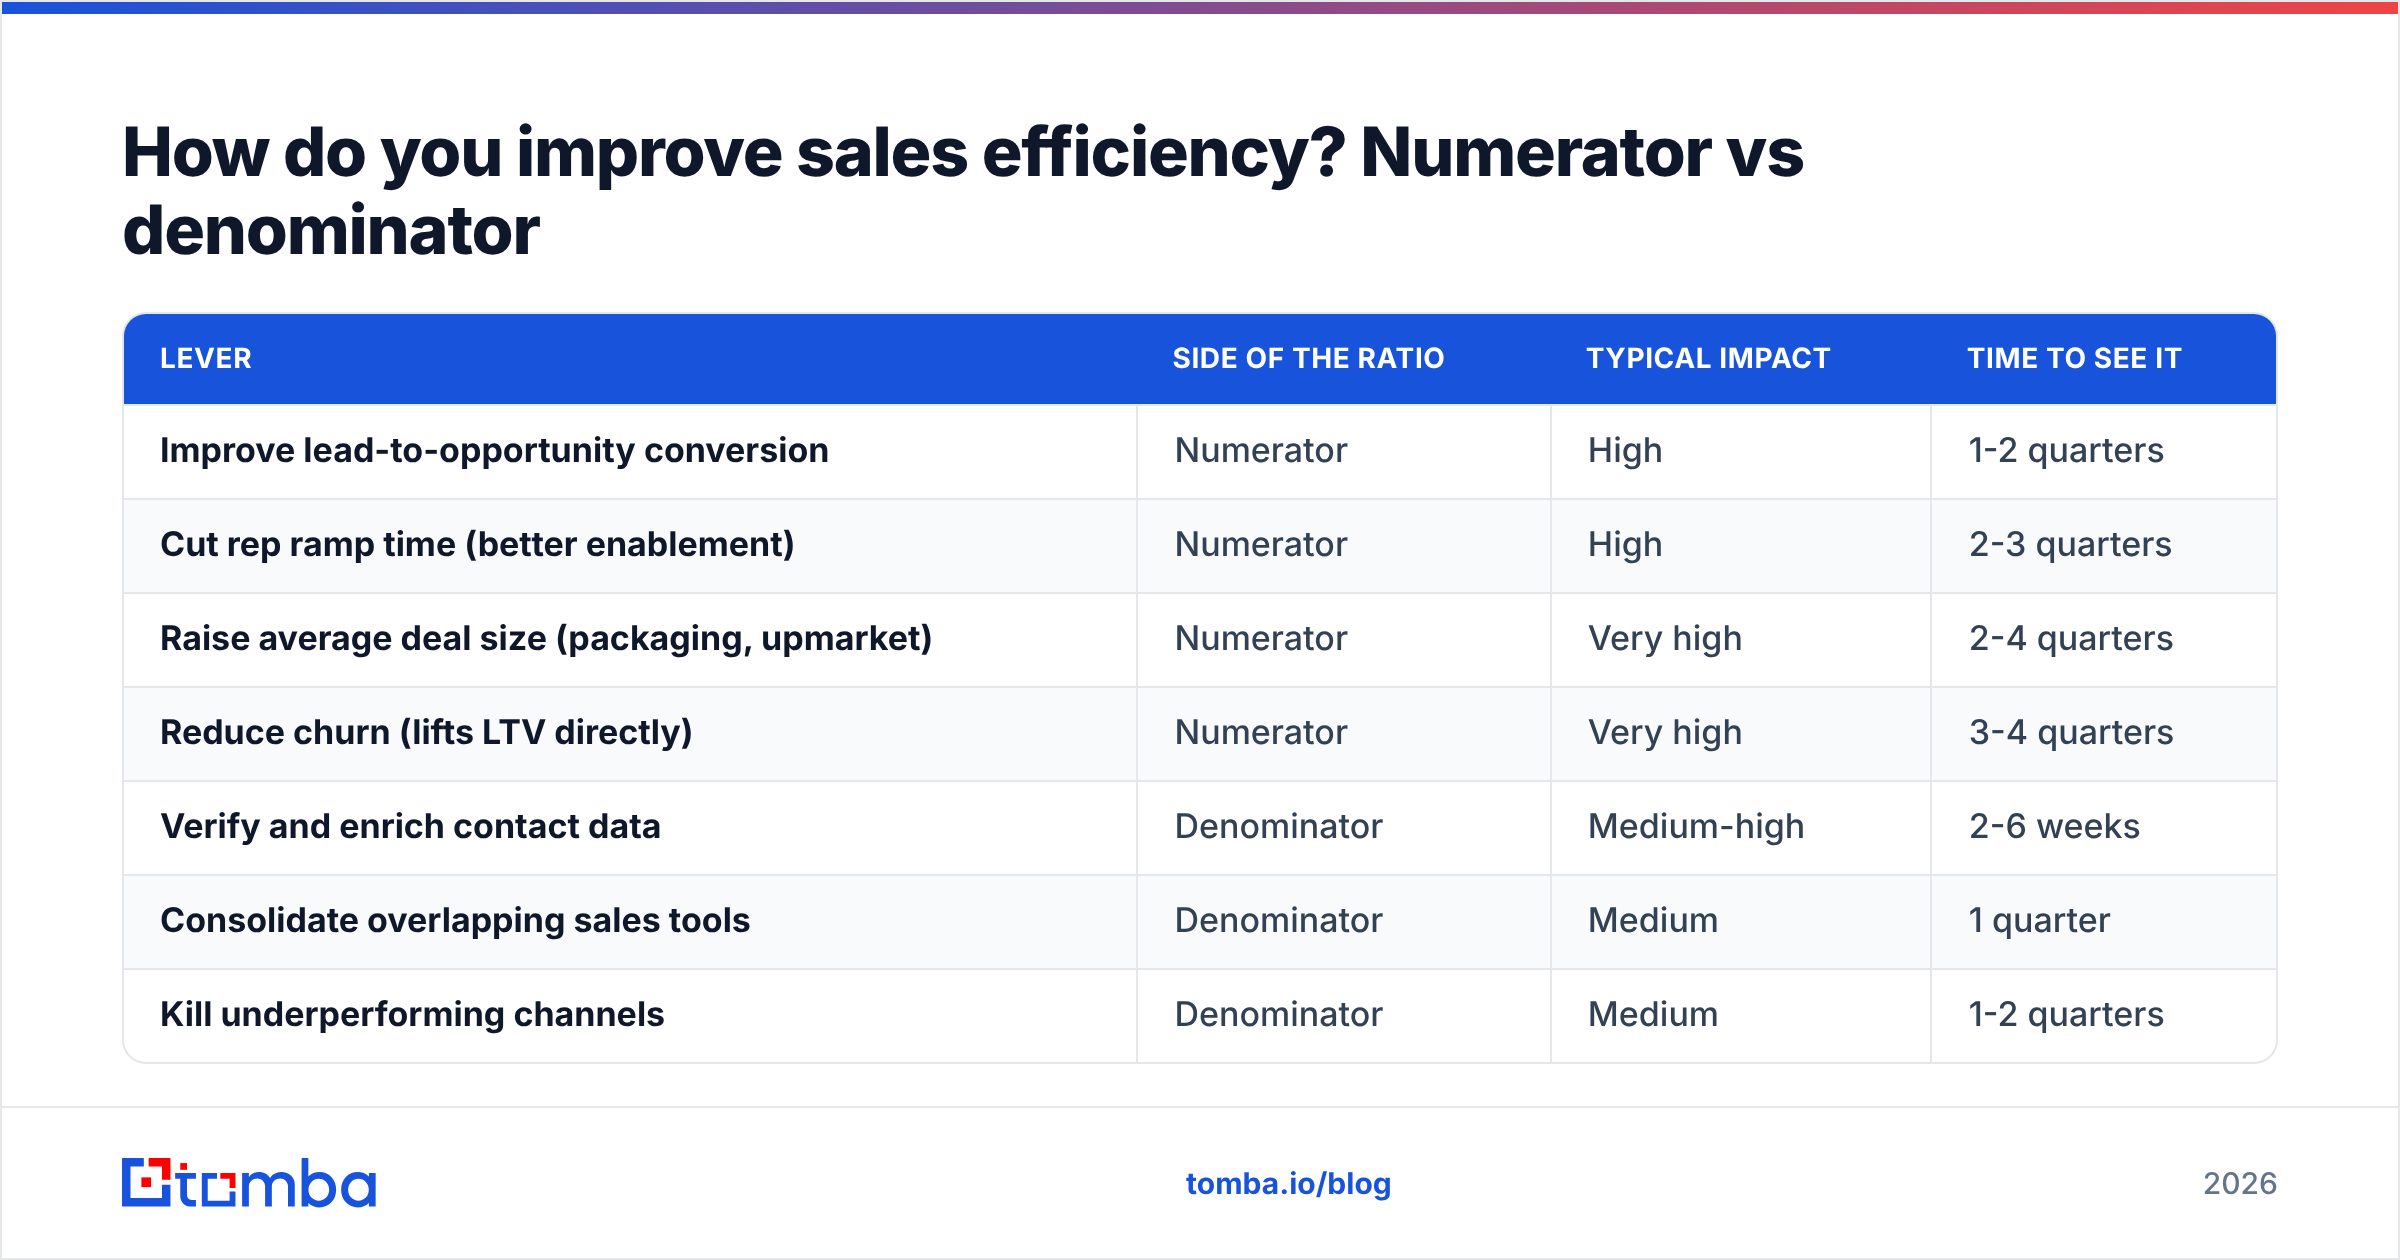
Every efficiency improvement is either "make more revenue from the same spend" or "make the same revenue from less spend." Confusing the two is how teams cut their way into stagnation.
| Lever | Side of the ratio | Typical impact | Time to see it |
|---|---|---|---|
| Improve lead-to-opportunity conversion | Numerator | High | 1-2 quarters |
| Cut rep ramp time (better enablement) | Numerator | High | 2-3 quarters |
| Raise average deal size (packaging, upmarket) | Numerator | Very high | 2-4 quarters |
| Reduce churn (lifts LTV directly) | Numerator | Very high | 3-4 quarters |
| Verify and enrich contact data | Denominator | Medium-high | 2-6 weeks |
| Consolidate overlapping sales tools | Denominator | Medium | 1 quarter |
| Kill underperforming channels | Denominator | Medium | 1-2 quarters |
| Shift SDR volume to automation | Denominator | Medium | 1-2 quarters |
| Reduce management layers | Denominator | Low-medium | 2+ quarters |
The sequencing rule most teams get backwards: denominator fixes are faster, numerator fixes are bigger. Start with denominator work because it pays back in weeks and buys you credibility for the harder numerator projects. But don't stop there — you cannot cost-cut your way to a 3:1 LTV:CAC if your win rate is 8%.
One warning on tool consolidation. Cutting spend on tools that directly feed rep productivity is a false economy — you save $200 a seat and lose ten hours a month of selling time per rep. Audit by cost-per-hour-saved, not by line-item price. A bulk email finder that costs $99 a month and saves each of six reps four hours a week is returning something like 100 hours a month against a rounding-error cost.

What does a full worked example look like?#
Take a mid-market B2B SaaS company, Q3 2026.
Inputs:
- Q2 ending ARR: $8,400,000
- Q3 ending ARR: $9,650,000
- Q2 S&M spend (fully loaded): $1,480,000
- New customers added in Q3: 46
- Average new-customer MRR: $1,900
- Gross margin: 78%
- Monthly logo churn: 1.2%
Magic Number: ARR grew $1,250,000. Annualized quarterly growth is $1,250,000 × 4 = $5,000,000. Divide by prior-quarter S&M of $1,480,000 → 3.38. That looks spectacular — suspiciously so. Because the calculation used total ARR growth, it includes expansion. Split it out: $760,000 of the growth was expansion from existing accounts, leaving $490,000 net-new. New-logo Magic Number = ($490,000 × 4) ÷ $1,480,000 = 1.32. Still strong, but a very different story about where growth comes from.
CAC: Roughly 70% of S&M spend went to new-logo acquisition = $1,036,000, divided by 46 new customers = $22,522 per customer.
CAC payback: $22,522 ÷ ($1,900 × 0.78) = 15.2 months. Acceptable for a mid-market motion, on the long side for a $1,900 MRR price point.
LTV:CAC: Monthly churn of 1.2% implies an average lifetime of about 83 months. LTV = $1,900 × 0.78 × 83 = $123,006. Against a $22,522 CAC that's 5.5:1 — above the healthy band, which means this company is underinvesting. The data says: hire more reps.
Notice how the four metrics tell one coherent story only after you separate expansion from new logos. That single correction changed the headline number from 3.38 to 1.32.
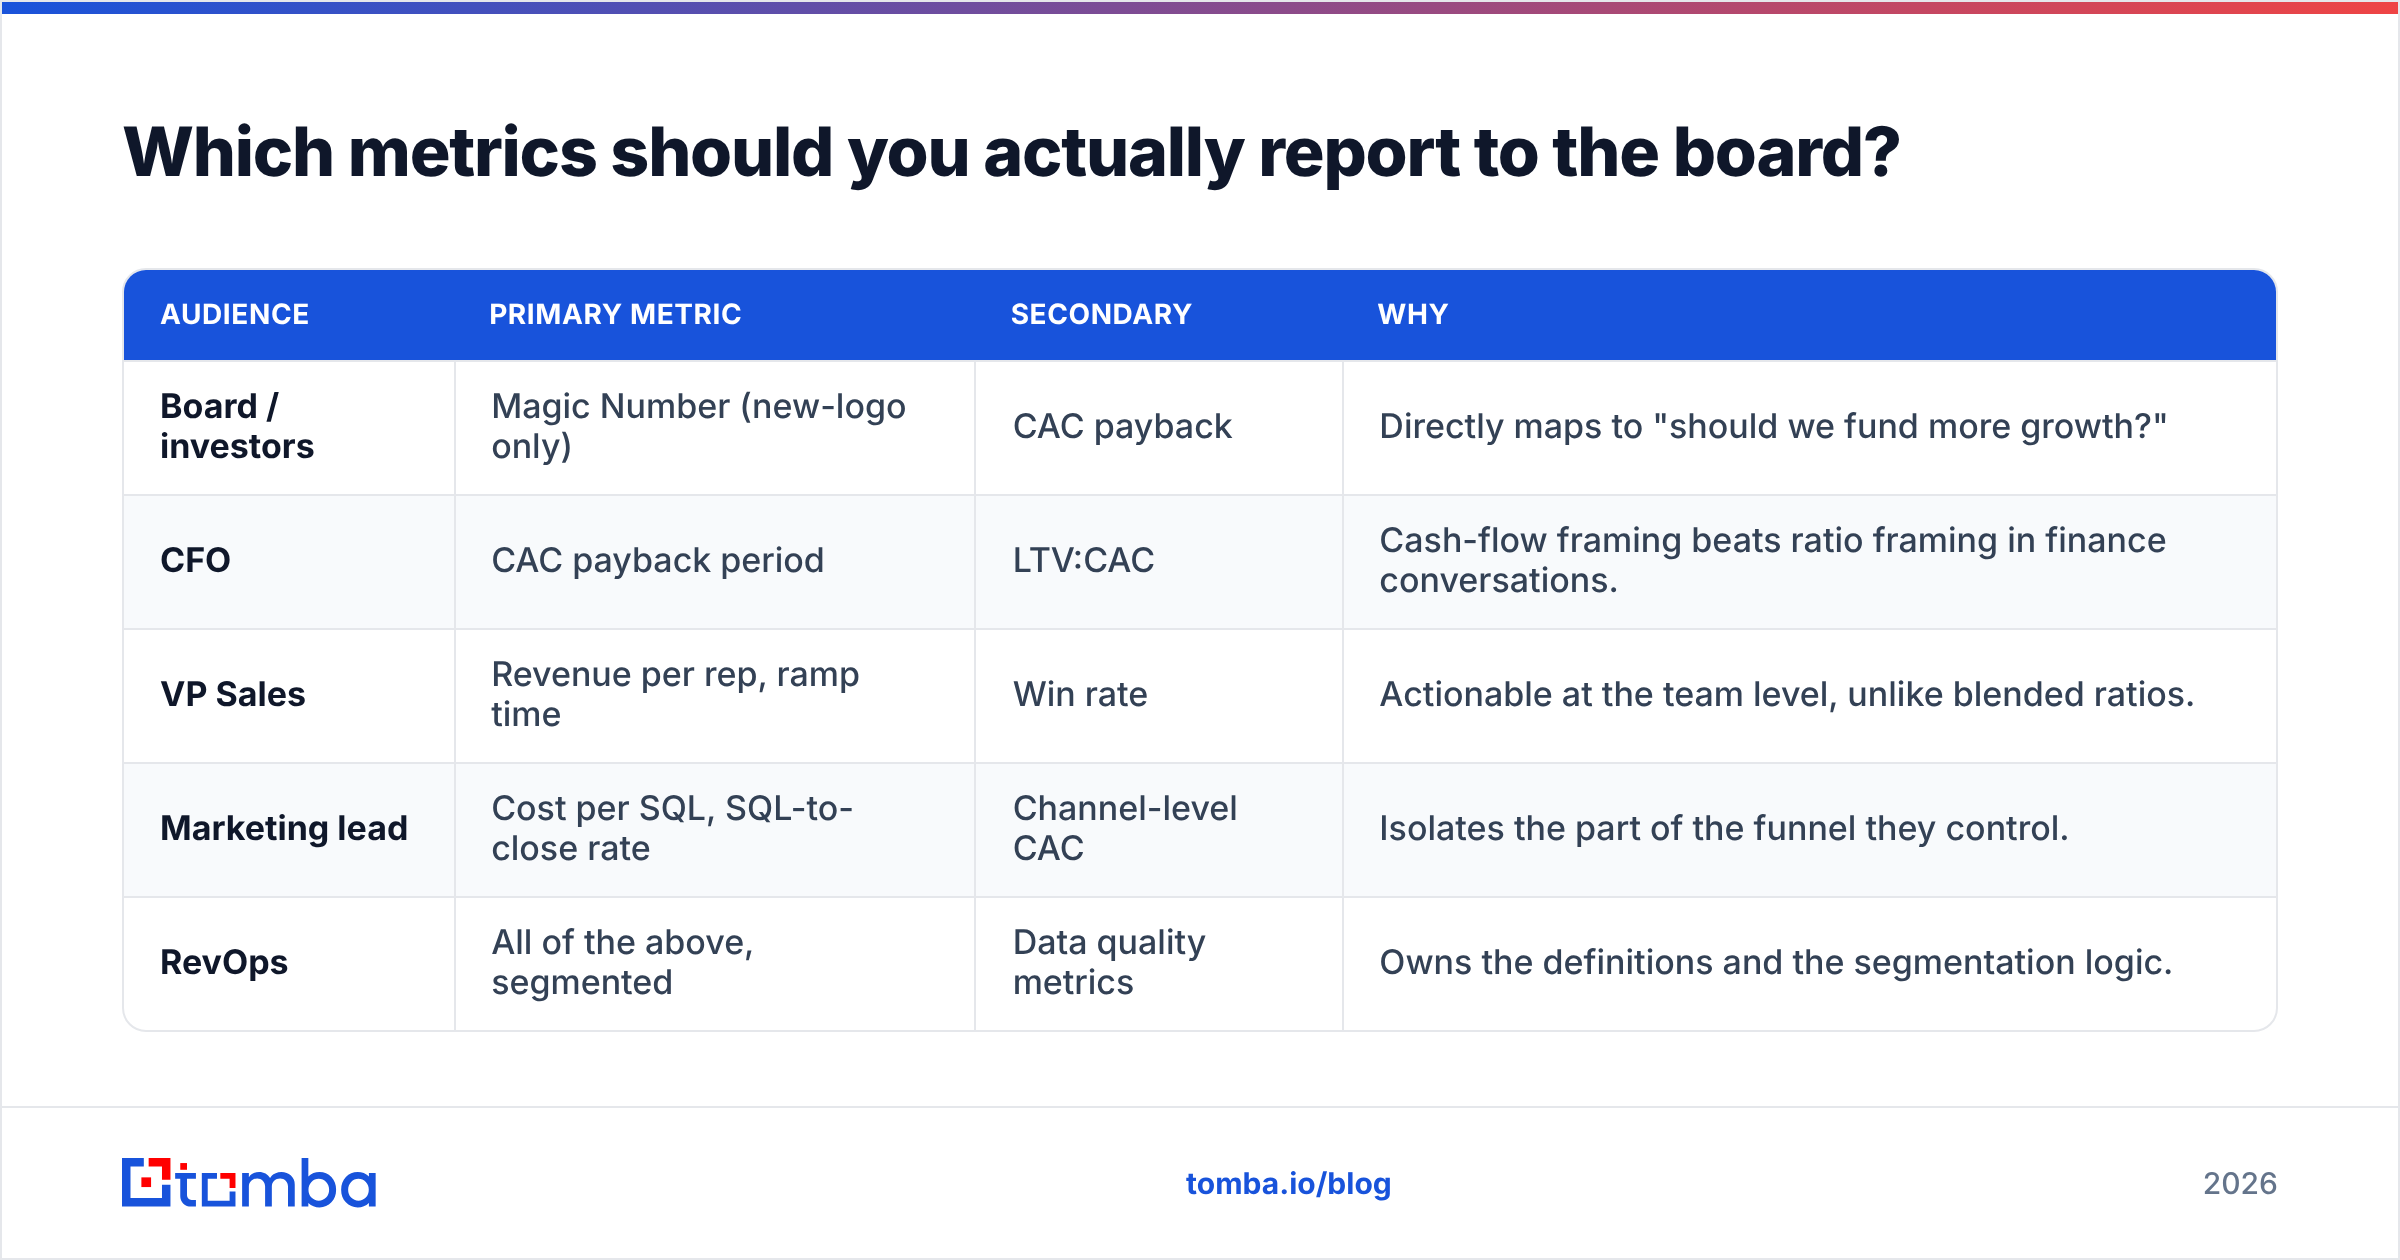
Which metrics should you actually report to the board?#
Pick three, keep them stable, and show trend lines rather than snapshots.
| Audience | Primary metric | Secondary | Why |
|---|---|---|---|
| Board / investors | Magic Number (new-logo only) | CAC payback | Directly maps to "should we fund more growth?" |
| CFO | CAC payback period | LTV:CAC | Cash-flow framing beats ratio framing in finance conversations. |
| VP Sales | Revenue per rep, ramp time | Win rate | Actionable at the team level, unlike blended ratios. |
| Marketing lead | Cost per SQL, SQL-to-close rate | Channel-level CAC | Isolates the part of the funnel they control. |
| RevOps | All of the above, segmented | Data quality metrics | Owns the definitions and the segmentation logic. |
The definitional discipline matters more than the metric choice. Write down exactly what counts as S&M spend, what counts as new revenue, and which quarter's denominator you're using. Publish it. Then don't change it for at least four quarters, because a metric that gets redefined every board meeting is a metric nobody trusts. This is the core of what good revenue operations work looks like — boring, documented, consistent.
For a deeper treatment of the underlying unit economics, HubSpot's research library publishes annual benchmark data worth cross-referencing against your own segments.
What's the fastest efficiency win available this quarter?#
Fix your contact data before you touch anything else.
It's the only lever on this list that takes weeks rather than quarters, requires no organizational change, and improves both sides of the ratio at once — fewer wasted rep hours in the denominator, more connected conversations in the numerator. Everything else on the improvement list (deal size, ramp time, churn) is a multi-quarter program with organizational dependencies.
Start with an audit: pull your last 5,000 outbound contacts, run them through verification, and measure the invalid rate. If it's above 10%, you have a quantifiable, fixable efficiency leak with a number attached to it. Take that number to your next pipeline review instead of an opinion.
Get the denominator under control. Tomba's Email Finder gives your reps verified, current contact data so prospecting hours turn into conversations instead of bounces. Start free with 25 searches a month, or step up to Starter at $49/mo and Growth at $99/mo when the whole team needs it — see full Tomba pricing for volume tiers and API access. Clean inputs are the cheapest sales efficiency improvement you will make this year.
Related guides#
Ready to find emails that actually work?
Join 150,000+ professionals who stopped guessing and started sending. Free credits on signup — no credit card required.
Get the Tomba newsletter
Practical outbound tactics and product updates — once every two weeks.
About the author