How To Calculate Sales Forecast For A New Business (2026)
No sales history, no pipeline, no benchmarks. Here is the exact bottom-up method for building a defensible first-year sales forecast — plus the three models to compare and the inputs that actually move the number.
TL;DR
- A new business has no sales history, so you forecast bottom-up from activity capacity, not top-down from market size. Top-down ("we'll take 1% of a $4B market") is not a forecast, it's a wish.
- The core formula is:
Reachable contacts × contact rate × meeting rate × close rate × average deal value × deals per period. Every term must be defensible on its own. - Build three scenarios — conservative, base, aggressive — and force the base case to be the one you'd bet payroll on. Investors read the spread, not the headline number.
- Your biggest error source in month one is list quality, not conversion assumptions. A 30% bounce rate silently deletes a third of your funnel before anyone replies.
- Re-forecast every 30 days for the first year. Replace one assumption with real data each cycle until nothing is left but observed rates.
Why can't a new business forecast the normal way?#
Because every standard forecasting method assumes you have a past. Weighted pipeline forecasting needs a pipeline. Historical run-rate forecasting needs history. Regression needs at least four quarters of data points to be anything other than a line drawn through noise.
You have none of that. What you do have is a set of physical constraints: how many hours your team can work, how many people you can actually reach, how much you can charge, and how long a deal takes to close. A new-business forecast is a model of those constraints, expressed in dollars.
Think of it like planning a restaurant's opening-year revenue. You don't know how many customers will come. But you do know you have 40 seats, you serve two turns a night, you're open six days a week, and the average check is $38. That gives you a ceiling. Then you apply an honest fill rate. That's the whole exercise — capacity times realistic conversion.
The mistake most founders make is skipping straight to the market-size slide. Gartner's research on forecasting practice consistently finds that forecast accuracy tracks with process discipline, not model sophistication. A simple model you update weekly beats an elaborate one you build once.
What is the bottom-up sales forecast formula?#
Here's the spine of it. Work left to right, and write down where each number came from.
Monthly revenue =
  (Reachable contacts per month
   × Deliverable rate
   × Reply rate
   × Meeting-booked rate
   × Close rate)
  × Average contract value
Then layer on the pieces that make it a real forecast rather than a single-month snapshot:
- Sales cycle length — shifts revenue into later months. A 60-day cycle means January outreach books February meetings and March revenue. Forecast the activity in month one and the cash in month three.
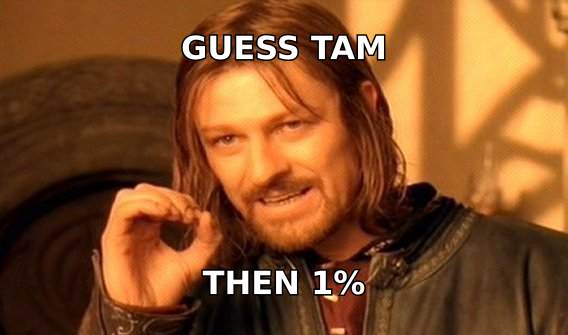
- Ramp time — a new rep does not hit full output in week one. Assume 40% of full capacity in month one, 70% in month two, 100% by month three.
- Churn and expansion — for subscription businesses, month-over-month revenue is not additive. Net revenue retention below 100% means you refill a leaking bucket.
- Seasonality — B2B outbound dies in late December and mid-August. Do not straight-line 12 identical months.
- Capacity ceiling — one full-time SDR sustains roughly 800–1,200 personalized emails and 200–300 calls a month. If your model requires 5,000 touches from one person, the model is broken, not ambitious.
- Payment terms — booked revenue and collected cash differ by 30–90 days. Founders run out of the second one, not the first.
A worked example#
Say you sell a $6,000/year product to operations managers at mid-market logistics firms.
- Reachable contacts you can source per month: 2,000
- Deliverable rate after verification: 95% → 1,900
- Reply rate: 6% → 114
- Meeting-booked rate from replies: 35% → 40 meetings
- Close rate from meeting: 18% → 7 deals
- ACV: $6,000 → $42,000 booked in that cohort
With a 45-day cycle, that January cohort mostly lands as February–March revenue. Run twelve cohorts, apply ramp and seasonality, and you have a year-one forecast that survives a due-diligence conversation — because every single number in it is something you can test in week one.
Which forecasting model should you use?#
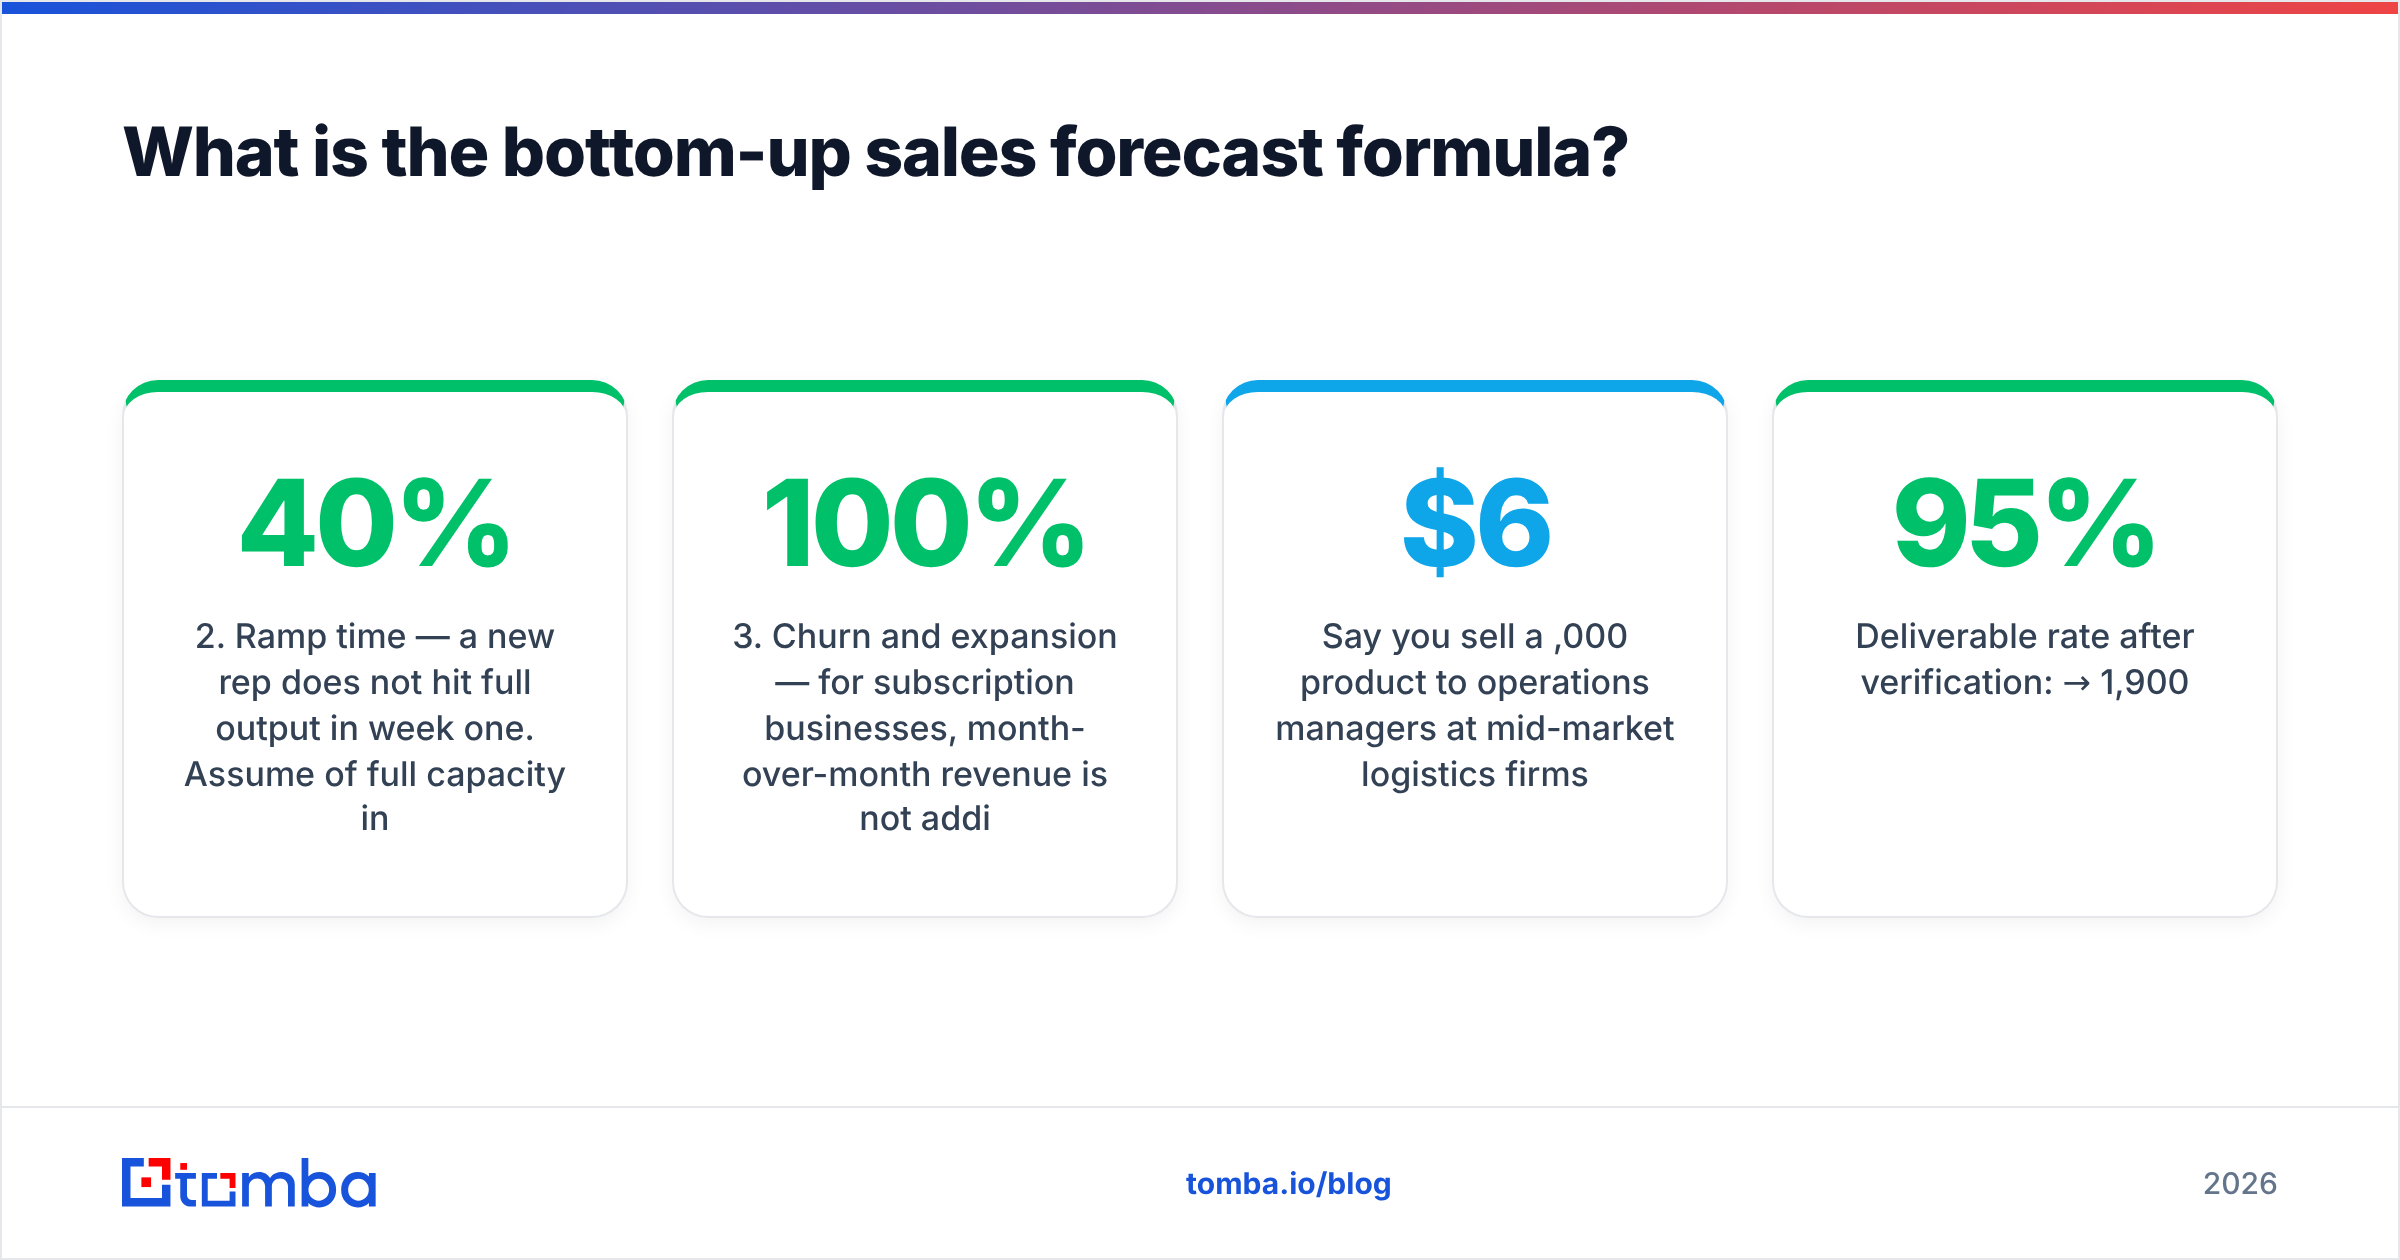
Three models are realistic for a pre-revenue or early-revenue company. Most founders should run the bottom-up model as their primary and use the others as sanity checks.
| Model | How it works | Best for | Accuracy in year 1 | Main failure mode |
|---|---|---|---|---|
| Bottom-up (activity-based) | Multiply reachable contacts by funnel conversion rates and deal value | Outbound-led B2B, any pre-revenue startup | Highest — every input is testable | Over-optimistic conversion rates |
| Top-down (market share) | Estimate TAM, assume a capture percentage | Board slides, category-creation pitches | Lowest — unfalsifiable | "1% of the market" with no path to it |
| Comparable / analog | Copy the first-year curve of a similar company at a similar stage | Franchise, retail, well-mapped SaaS niches | Medium — depends on comp quality | Comps are survivors; failures aren't public |
| Pipeline-weighted | Multiply open deals by stage probability | Month 4+, once you have real opportunities | High, but only short-horizon | Useless before you have a pipeline |
| Capacity-constrained | Work backward from headcount × output ceiling | Services, agencies, consultants | High for delivery-limited businesses | Ignores demand-side limits |
The practical answer: build bottom-up, cross-check against a comparable, and keep the top-down number in your deck only to show you understand the market's size — never as the forecast itself.
What inputs do founders get wrong most often?#
Four inputs cause the majority of first-year forecast misses, and they're not the ones people argue about in board meetings.
Reachable contacts is not the same as total market. Your TAM might be 40,000 companies. Your reachable list this quarter is the subset where you can identify the right role, get a verified email or phone number, and fit the ICP filter. That's usually 10–20% of TAM in month one. Use a domain search against your target account list to find the real number before you write it in the model — counting actual retrievable contacts takes an afternoon and removes the biggest source of fantasy.
Deliverable rate gets ignored entirely. Most first-time forecasts assume every email sent is an email received. In practice, unverified B2B lists bounce at 15–30%, and once you cross roughly a 3% bounce rate your email deliverability degrades for the whole domain — meaning even the good addresses stop landing. Run every list through an email verifier before it enters the model, and forecast on verified counts only.
Close rate is borrowed from companies with brand equity. A public SaaS company's 22% close rate reflects inbound demand, analyst coverage, and reference customers. You have none of those yet. Cut any borrowed close rate by at least a third for year one.
Sales cycle is measured optimistically. Founders time the cycle from "first serious call" instead of "first touch." The honest measure includes the three weeks of no-reply before someone answers. Check your assumption against published benchmarks — HubSpot's sales statistics roundup is a reasonable starting reference — and then add 30%.
How do you build the three-scenario model?#
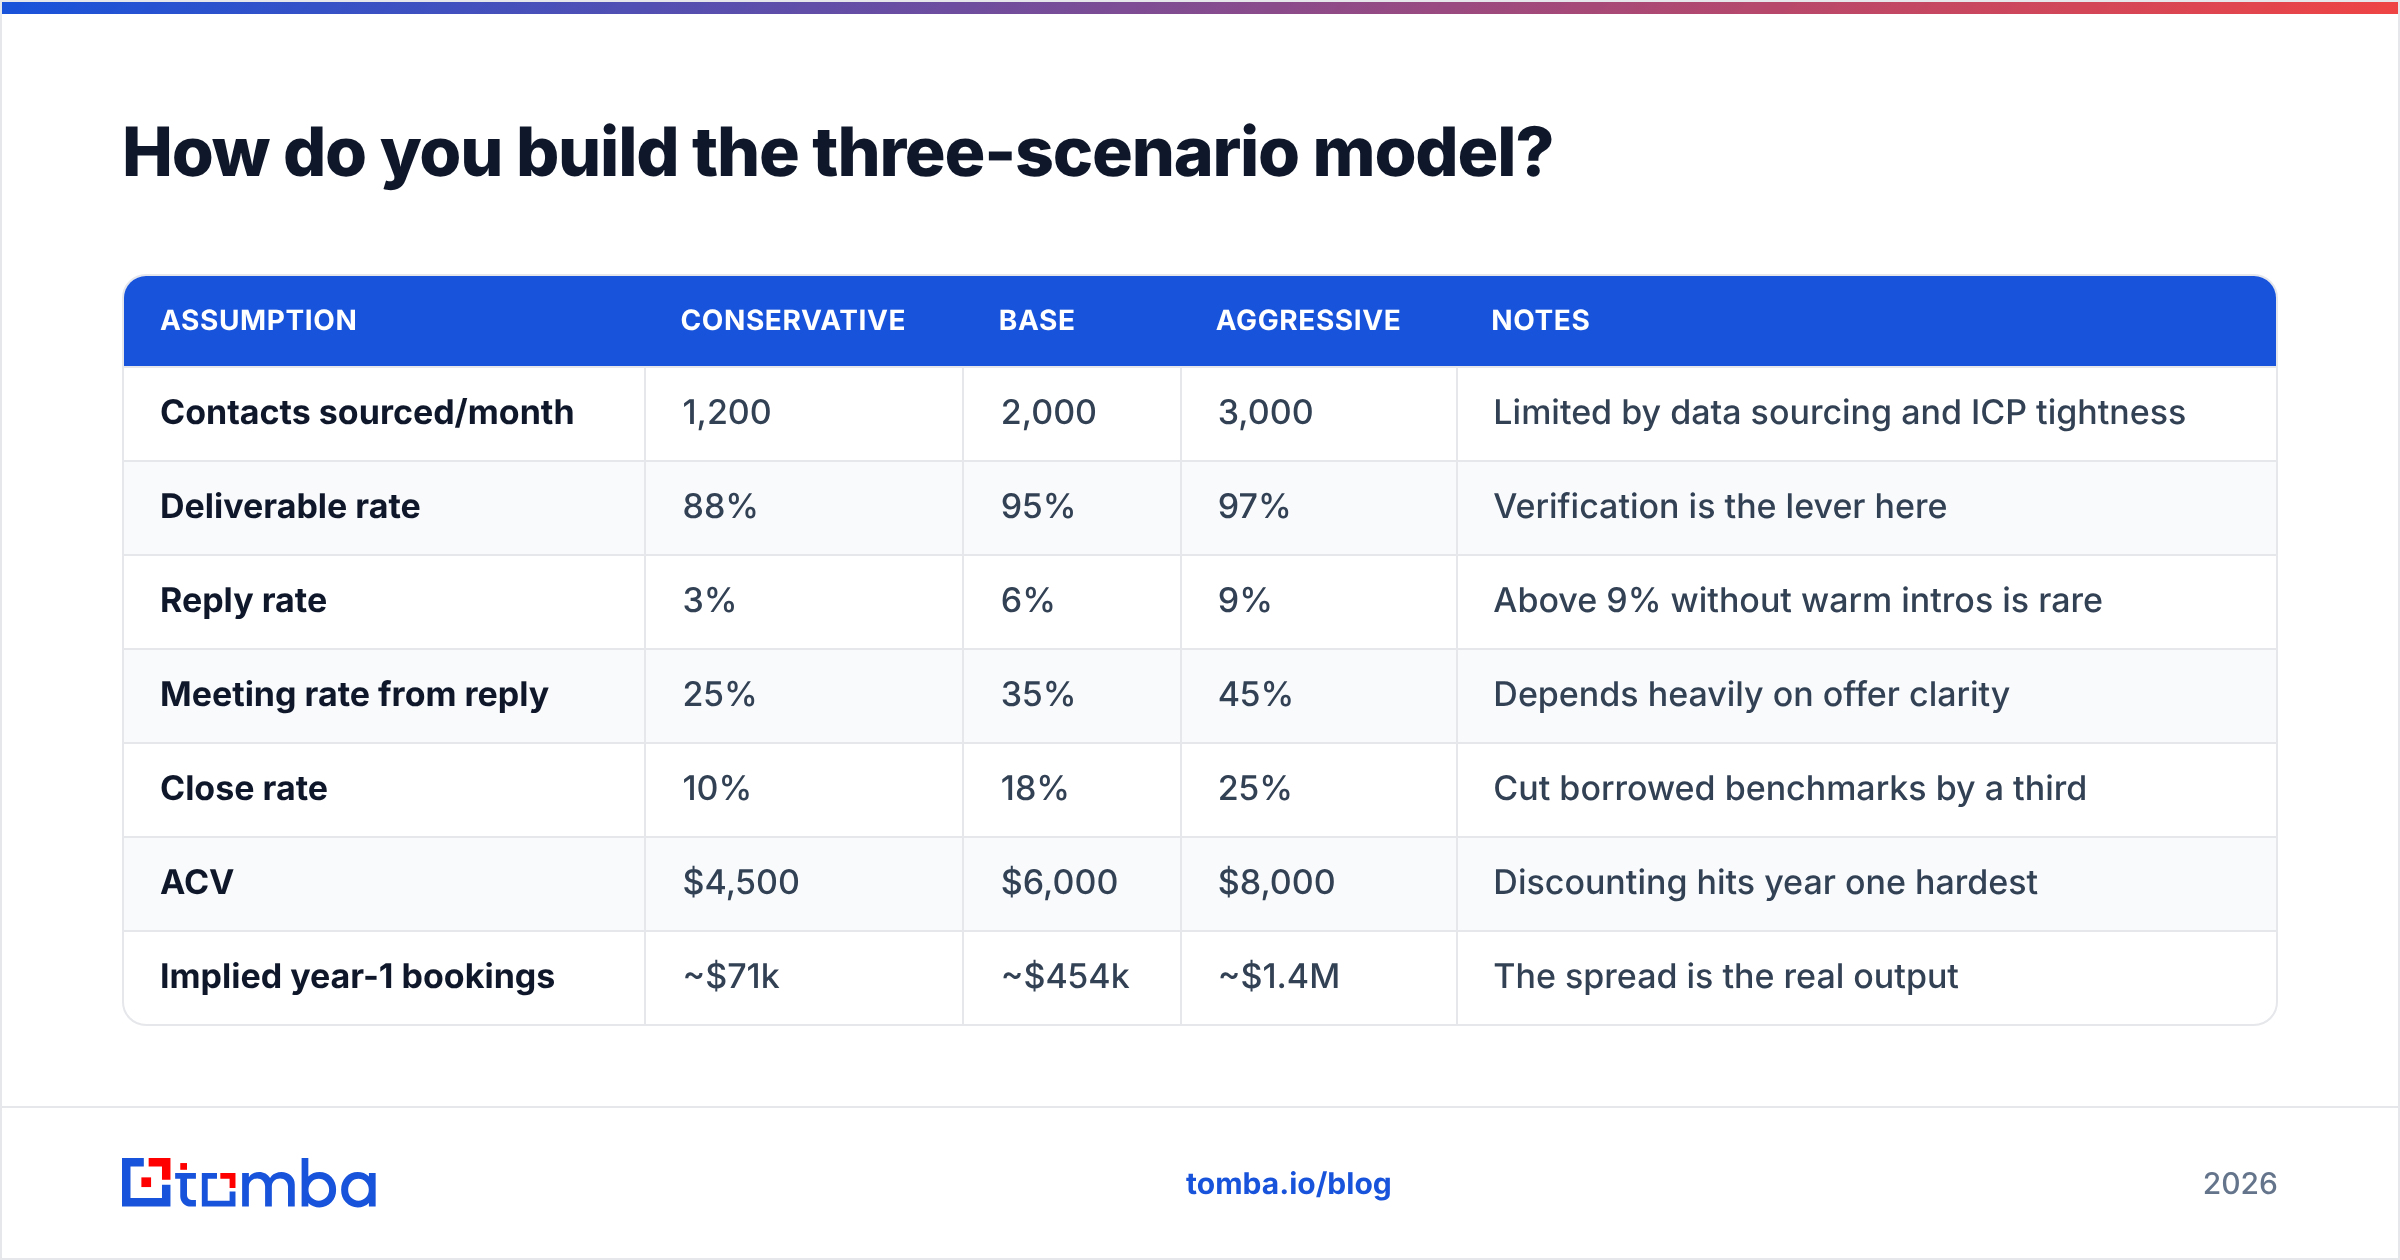
One number is a guess. Three numbers is a forecast. Build conservative, base, and aggressive versions by varying only the assumptions you're genuinely uncertain about — not all of them at once.
| Assumption | Conservative | Base | Aggressive | Notes |
|---|---|---|---|---|
| Contacts sourced/month | 1,200 | 2,000 | 3,000 | Limited by data sourcing and ICP tightness |
| Deliverable rate | 88% | 95% | 97% | Verification is the lever here |
| Reply rate | 3% | 6% | 9% | Above 9% without warm intros is rare |
| Meeting rate from reply | 25% | 35% | 45% | Depends heavily on offer clarity |
| Close rate | 10% | 18% | 25% | Cut borrowed benchmarks by a third |
| ACV | $4,500 | $6,000 | $8,000 | Discounting hits year one hardest |
| Implied year-1 bookings | ~$71k | ~$454k | ~$1.4M | The spread is the real output |
That spread — roughly 20x between conservative and aggressive — is uncomfortable, and it should be. It tells you exactly which assumption to test first. Here it's reply rate and close rate, since they multiply together and swing the outcome more than anything else. So your first 30 days of operating work is: send enough volume to measure reply rate with a real sample, and get enough meetings to see whether 18% is anywhere near true.
Run the conservative case against your burn rate. If conservative doesn't survive, you don't have a forecasting problem — you have a business model problem, and no spreadsheet fixes that.
How do you validate the forecast with real data?#
The forecast is a hypothesis. Validation means replacing assumptions with measurements as fast as you can afford to.
Week 1–2: validate list volume. Can you actually source 2,000 qualified contacts a month? Pull one week's worth. If you can only find 300, your model's top line is wrong by 6x and everything downstream is fiction. Building a real target list — with roles, verified emails, and B2B phone numbers where relevant — is the first empirical test of the model.
Week 2–4: validate deliverability. Send a controlled batch. Measure hard bounces. Anything over 3% means your sourcing or verification step is broken, and the deliverable-rate input in your model needs to come down before you scale spend against it.
Week 3–6: validate reply rate. You need roughly 400–600 delivered emails to get a reply-rate estimate that isn't noise. Below that sample size, a single enthusiastic prospect makes your model look brilliant for the wrong reason.
Week 6–12: validate meeting-to-close. This is the slowest input to measure because it's gated by cycle length. Until you have 10+ closed-won or closed-lost outcomes, keep using the conservative close rate in your base case.
Ongoing: re-forecast monthly. Each month, swap one more assumption for an observation. By month six, a well-run early-stage forecast should have at most two assumed inputs left. That's the transition point where you can move to standard pipeline-weighted forecasting and retire the activity model as your primary.
Track the delta between forecast and actual each month, not just the actual. A forecast that's consistently 40% high isn't useless — once you know the bias, you can correct for it. A forecast that's randomly wrong in both directions means your model structure is off, not your inputs.
What tools do you need to run this?#
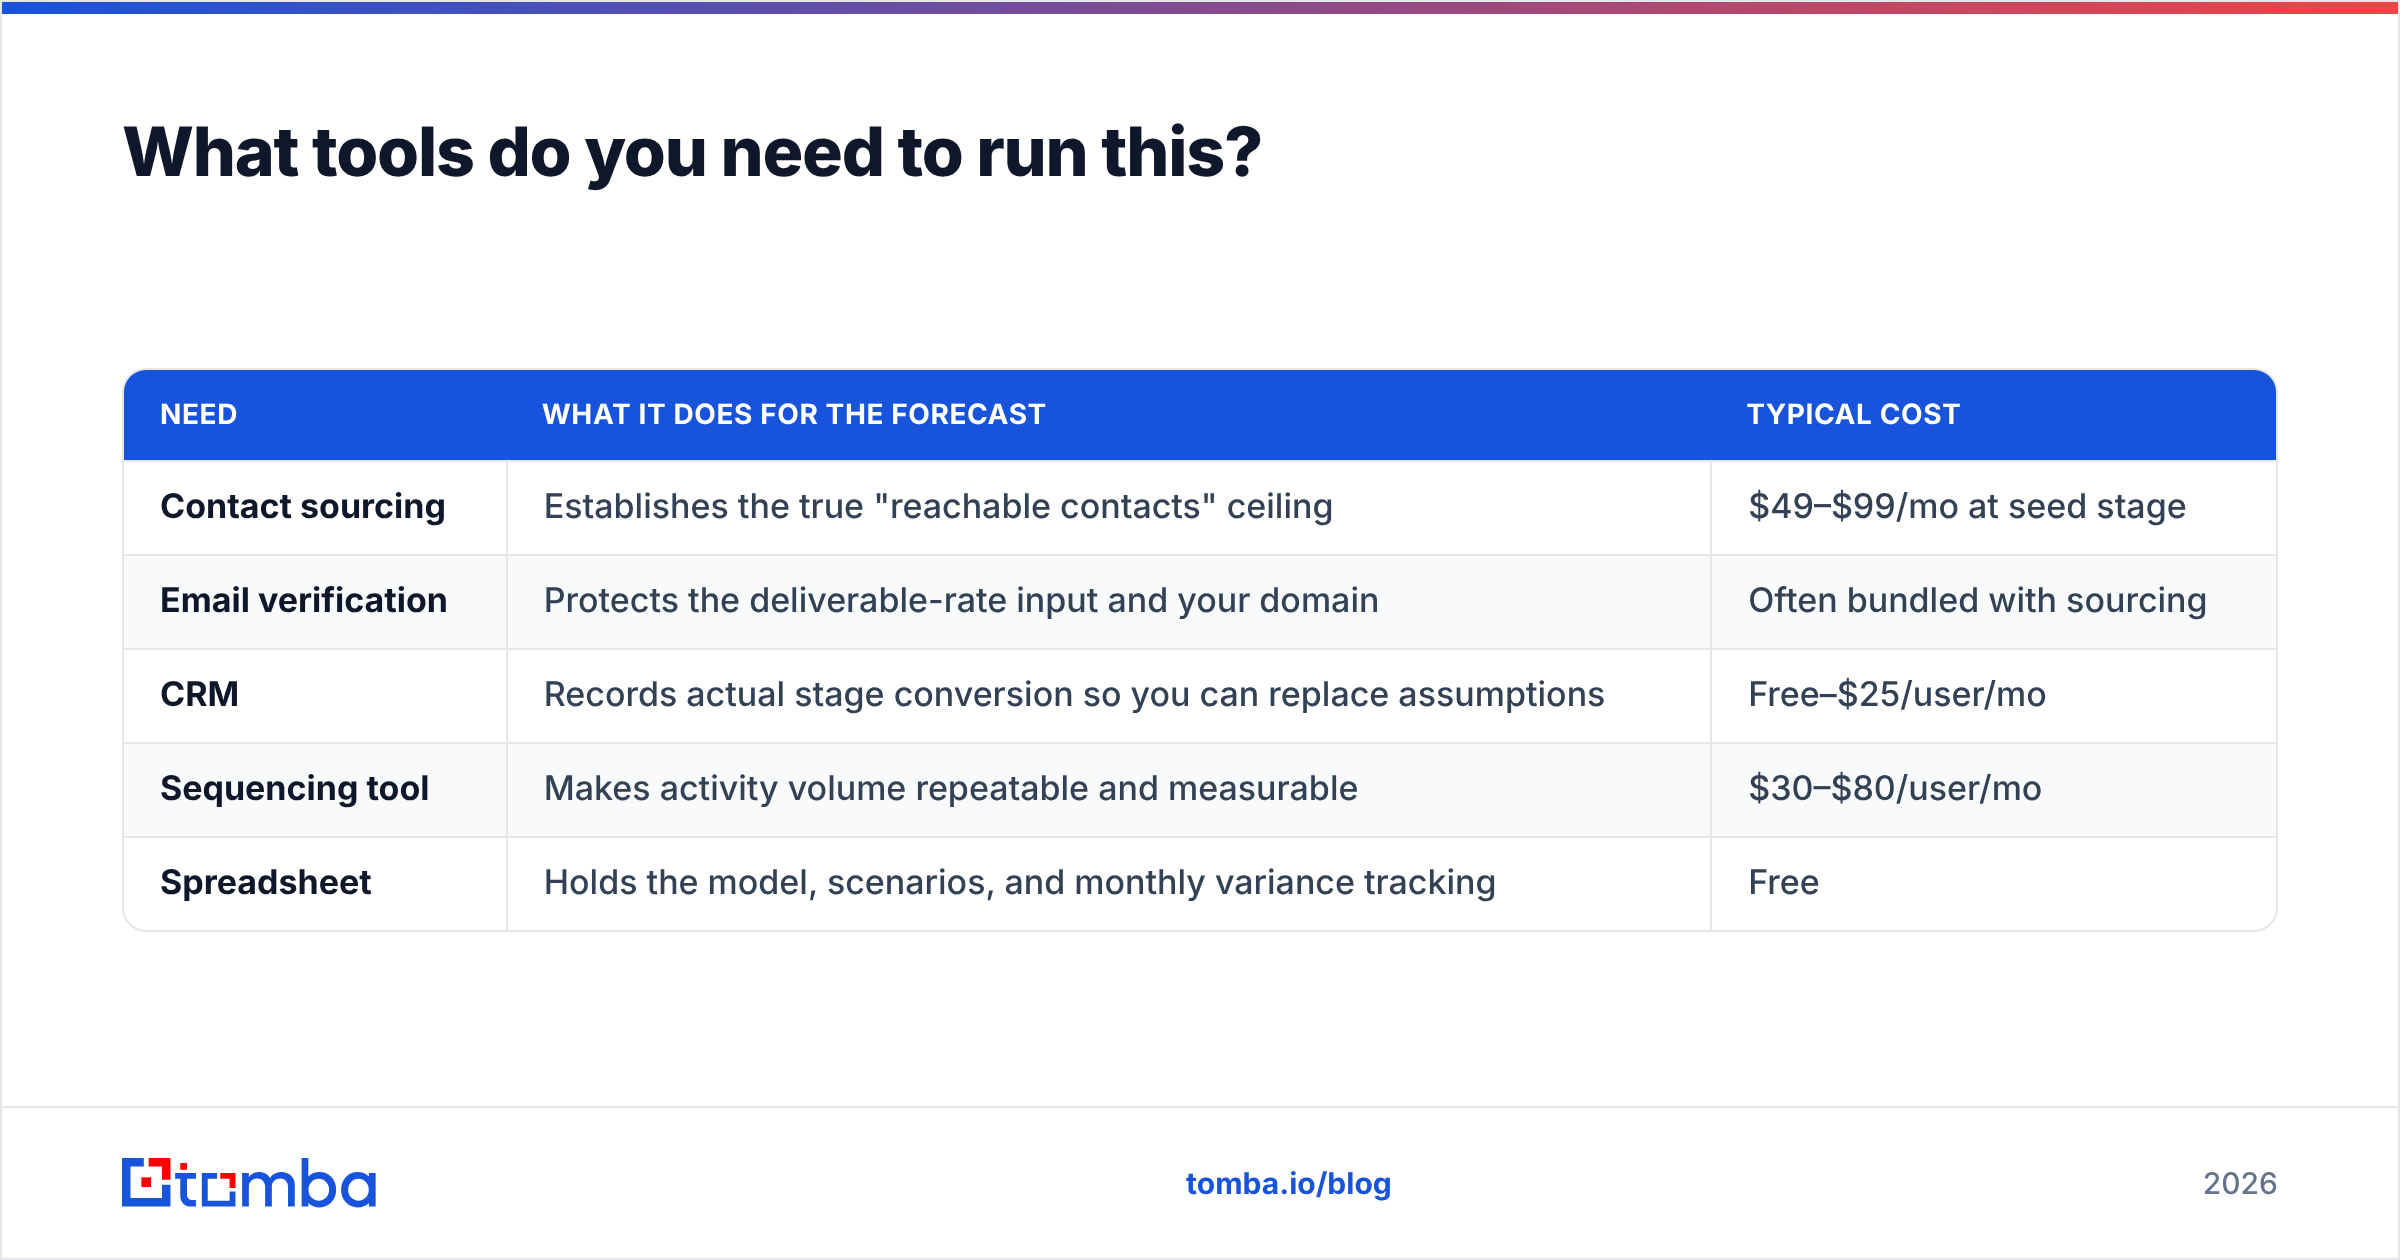
Less than you'd think. A spreadsheet holds the model. What you actually need to buy is reliable input data, because a forecast built on a bad contact list fails at the very first multiplication.
| Need | What it does for the forecast | Typical cost |
|---|---|---|
| Contact sourcing | Establishes the true "reachable contacts" ceiling | $49–$99/mo at seed stage |
| Email verification | Protects the deliverable-rate input and your domain | Often bundled with sourcing |
| CRM | Records actual stage conversion so you can replace assumptions | Free–$25/user/mo |
| Sequencing tool | Makes activity volume repeatable and measurable | $30–$80/user/mo |
| Spreadsheet | Holds the model, scenarios, and monthly variance tracking | Free |
For sourcing and verification, Tomba pricing starts with a free tier at 25 searches/month — enough to test whether your ICP is findable at all — then Starter at $49/mo and Growth at $99/mo, which is where most seed-stage teams building 2,000-contact monthly cohorts land. Peers like BookYourData take a pay-as-you-go approach to prebuilt lists, which suits teams that want a one-time cohort rather than ongoing search volume; both approaches work, and the right one depends on whether your ICP is stable or still moving.
Whatever you pick, check the vendor's published accuracy methodology rather than the marketing number, and cross-reference user reports on G2 before committing annual spend. Then export directly into your model so the "reachable contacts" cell is a real count, not an estimate.
What should your first forecast actually look like?#
A one-page model with three tabs: assumptions, monthly build, and variance tracking. Nothing else.
The assumptions tab holds every input as a named cell with a comment explaining its source — "reply rate 6%, based on 412 delivered emails in weeks 3–5" is a defensible note; "reply rate 6%, industry standard" is not. The monthly build multiplies those assumptions across twelve columns with ramp and seasonality applied. The variance tab compares forecast to actual each month and shows the running bias.
If an investor or a lender asks how you got the number, you should be able to walk them from a verified contact count to a booked-revenue figure in under three minutes, and name the two assumptions you're least confident about. That's what a good early-stage forecast is for — not predicting the future accurately, which is impossible, but making your beliefs explicit enough that you notice quickly when they're wrong.
Start with the input that breaks everything else. Your forecast's top line is "reachable contacts," and it's the one number you can verify today rather than assume for a quarter. Use the Tomba Email Finder to pull a real, verified contact list for your target accounts — company by company, role by role — and replace the guess at the top of your model with a count. The free tier gives you 25 searches to test whether your ICP is even findable before you commit to a plan. Everything downstream in the forecast is conversion math; this is the only input that's a fact.
Related guides#
Ready to find emails that actually work?
Join 150,000+ professionals who stopped guessing and started sending. Free credits on signup — no credit card required.
Get the Tomba newsletter
Practical outbound tactics and product updates — once every two weeks.
About the author