How To Calculate Sales Revenue: Formula, Examples, Fixes
The sales revenue formula takes ten seconds. Getting a number your CFO and your board both trust takes a bit more. Here are the formulas, the four adjustments most teams miss, and the data problems that quietly corrupt the total.
TL;DR
- Sales revenue = units sold x price per unit (product) or number of customers x average price of service (services). That is gross revenue, and it is the easy part.
- Net sales revenue subtracts returns, allowances, and discounts. If you report gross and your CFO reports net, you will lose that argument every quarter.
- Bookings, ARR, MRR, and recognized revenue are four different numbers. Mixing them is the single most common reason a sales dashboard disagrees with the general ledger.
- Revenue accuracy starts upstream: bad account data, duplicate CRM records, and unverified contacts inflate pipeline before anyone touches a formula.
- Use the worked examples and the reconciliation checklist below to produce one revenue number your board, your CFO, and your reps all read the same way.
What is sales revenue, exactly?#
Sales revenue is the money your company earns from selling its core products or services during a specific period, before any costs are deducted.
That last clause matters. Revenue is the top line. It is not profit, it is not cash collected, and it is not what landed in the bank account this month. Think of it like a restaurant's total on the register at close: it tells you how much food you sold, not how much you paid for the ingredients or whether the credit card processor has settled yet.
Two things are commonly confused with sales revenue:
- Total revenue includes non-operating income — interest, asset sales, licensing, one-off settlements. Sales revenue only counts your core selling activity.
- Cash collected is a treasury number. A signed $120,000 annual contract is revenue you recognize over twelve months, even if the customer pays it all in January.
Getting the definition right is not academic. The number you publish drives quota setting, commission payouts, valuation multiples, and board expectations. A definition that drifts between departments produces four dashboards and zero agreement.
What is the sales revenue formula?#
There are two base formulas, depending on what you sell.
For product companies:
Sales Revenue = Units Sold x Average Price Per UnitFor service and subscription companies:
Sales Revenue = Number of Customers x Average Price of ServiceBoth produce gross sales revenue. To get net sales revenue — the number that belongs on your income statement — apply the deductions:
Net Sales Revenue = Gross Sales Revenue - Returns - Allowances - DiscountsHere is what each deduction actually captures:
- Returns — product sent back for a full refund. In SaaS, this is the money-back-guarantee refund inside the trial window.
- Allowances — a partial credit issued without a return, usually for a defect, a service outage, or a shipping error. SLA credits live here.
- Discounts — promotional pricing, volume tiers, early-payment terms, and the "just get it signed before quarter close" concessions your reps negotiated.
- Chargebacks and failed payments — technically not a revenue deduction under strict GAAP, but if you run self-serve billing, failed cards can erode 2-4% of a month's stated revenue before you notice.

How do you calculate sales revenue step by step?#
Work through a real example. Take a B2B software company, "Northwind Analytics," closing out Q1 2026.
Step 1 — Segment your revenue lines. Never calculate one blended number first. Split by product, plan tier, or region, then sum.
Step 2 — Pull units and price per line.
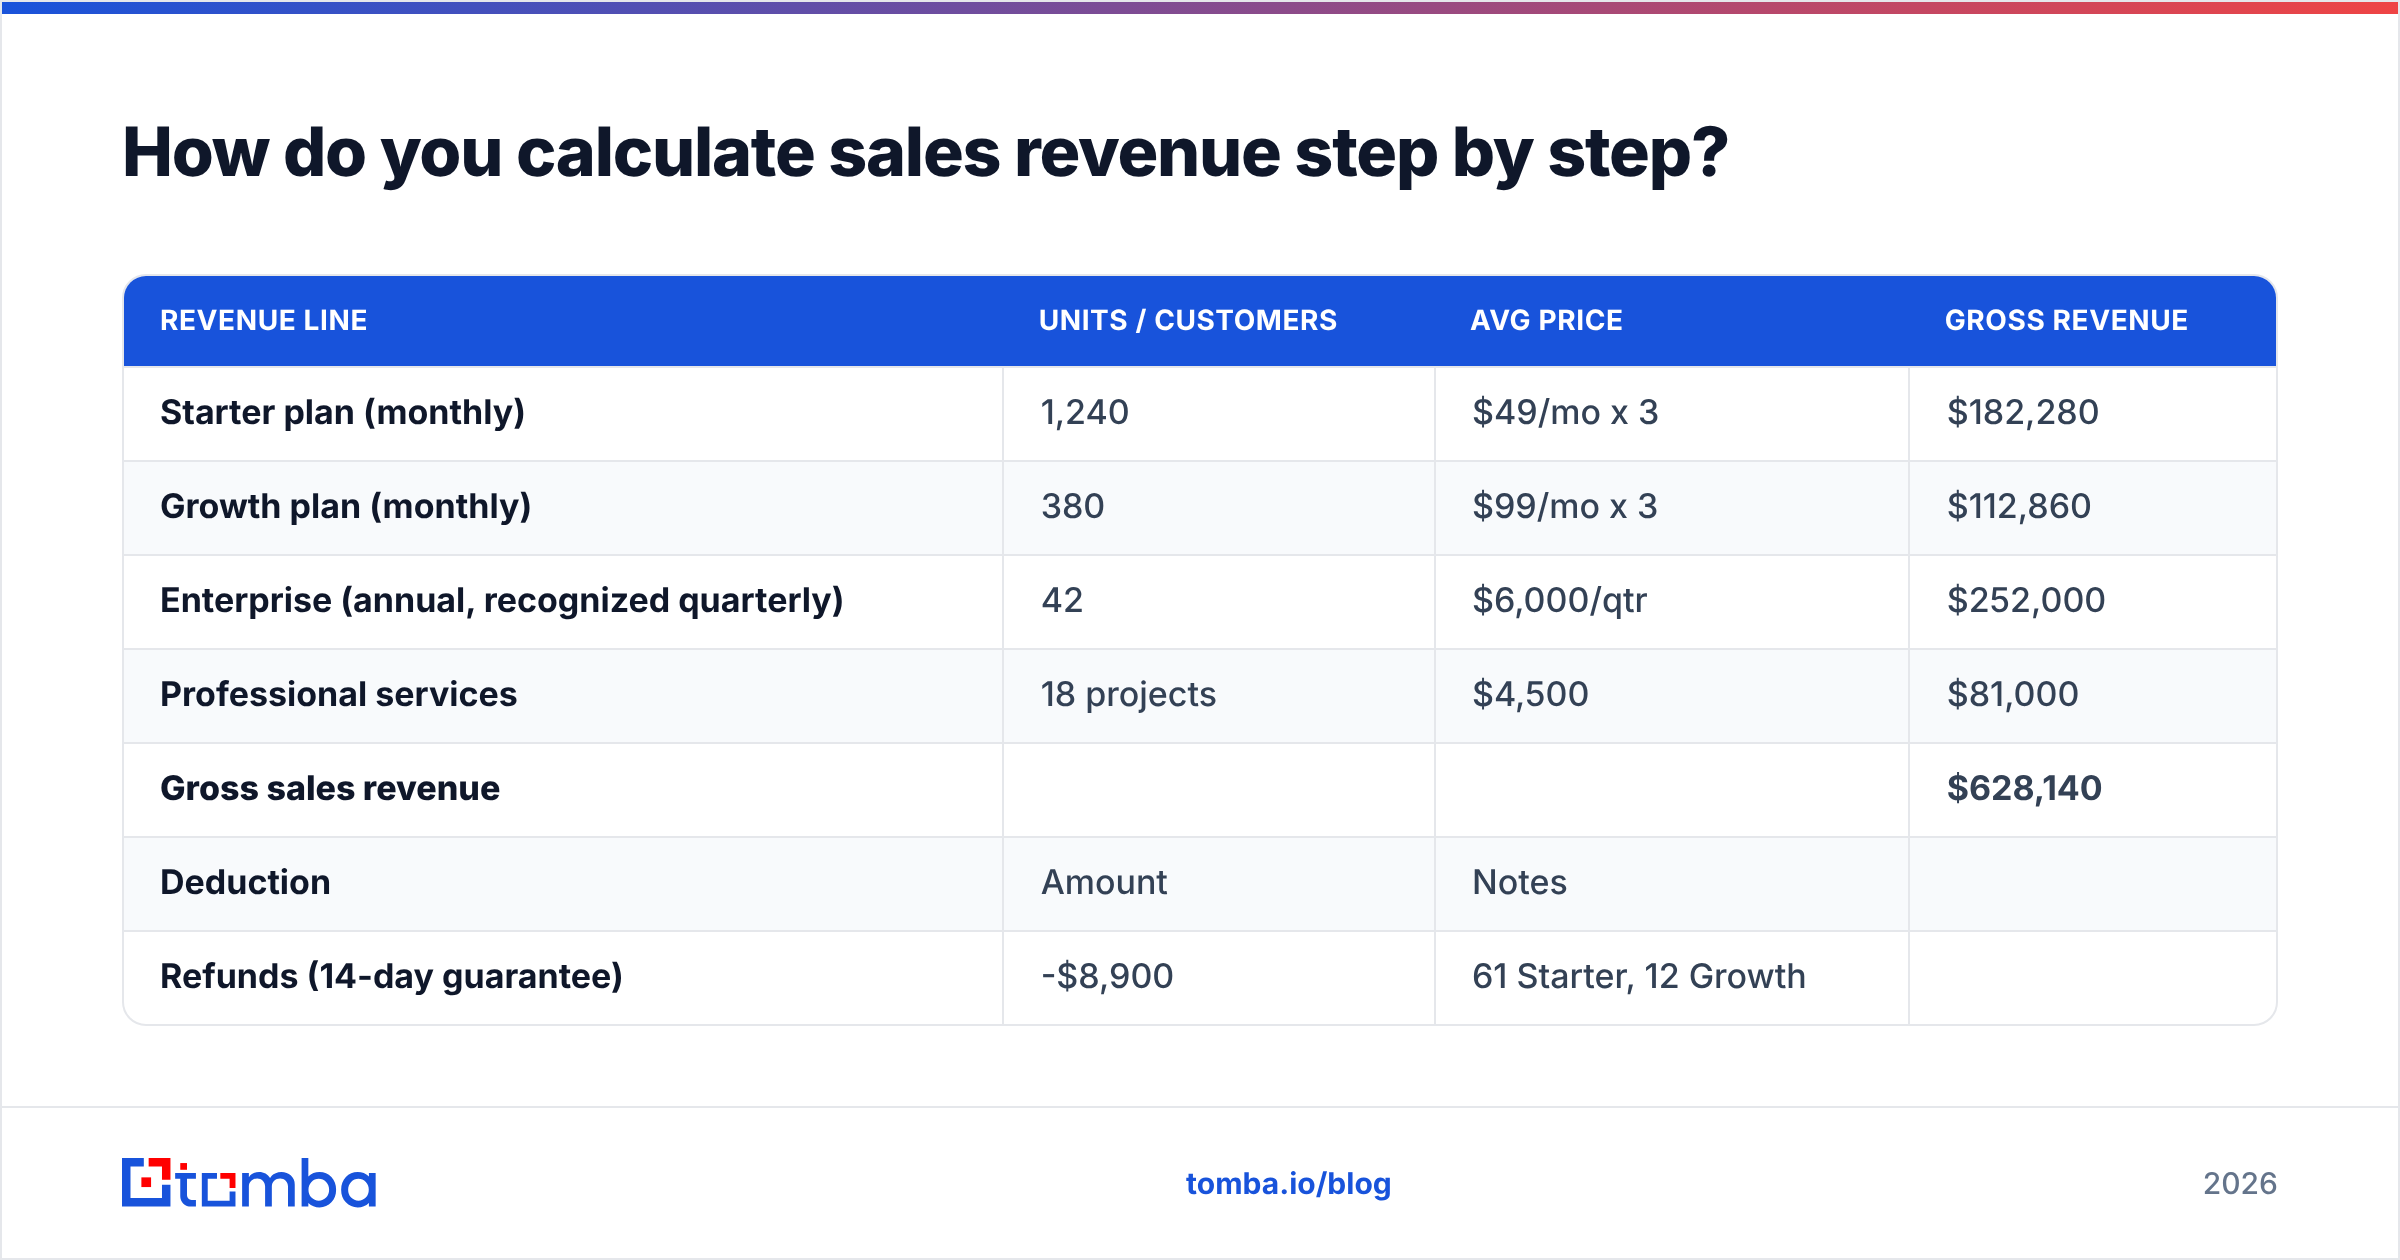
| Revenue line | Units / customers | Avg price | Gross revenue |
|---|---|---|---|
| Starter plan (monthly) | 1,240 | $49/mo x 3 | $182,280 |
| Growth plan (monthly) | 380 | $99/mo x 3 | $112,860 |
| Enterprise (annual, recognized quarterly) | 42 | $6,000/qtr | $252,000 |
| Professional services | 18 projects | $4,500 | $81,000 |
| Gross sales revenue | $628,140 |
Step 3 — Apply deductions.
| Deduction | Amount | Notes |
|---|---|---|
| Refunds (14-day guarantee) | -$8,900 | 61 Starter, 12 Growth |
| SLA credits | -$4,200 | One 6-hour outage in February |
| Annual prepay discounts | -$31,400 | 12% off, 42 enterprise accounts |
| Partner referral discounts | -$9,700 | 10% on 31 deals |
| Net sales revenue | $573,940 |
Step 4 — Reconcile to the ledger. Your CRM will say something different from your billing system, which will say something different from your accounting software. Reconcile all three before anyone presents a slide. Northwind's gap between CRM-reported closed-won ($671,000) and net revenue ($573,940) is 14.5% — entirely explained by discounts, refunds, and deals booked in March that recognize in April.
Step 5 — Document the definition. Write down which number you report, which deductions apply, and which period convention you use. Put it in a shared doc. Revisit it once a year, not once a quarter.
What is the difference between bookings, ARR, and recognized revenue?#
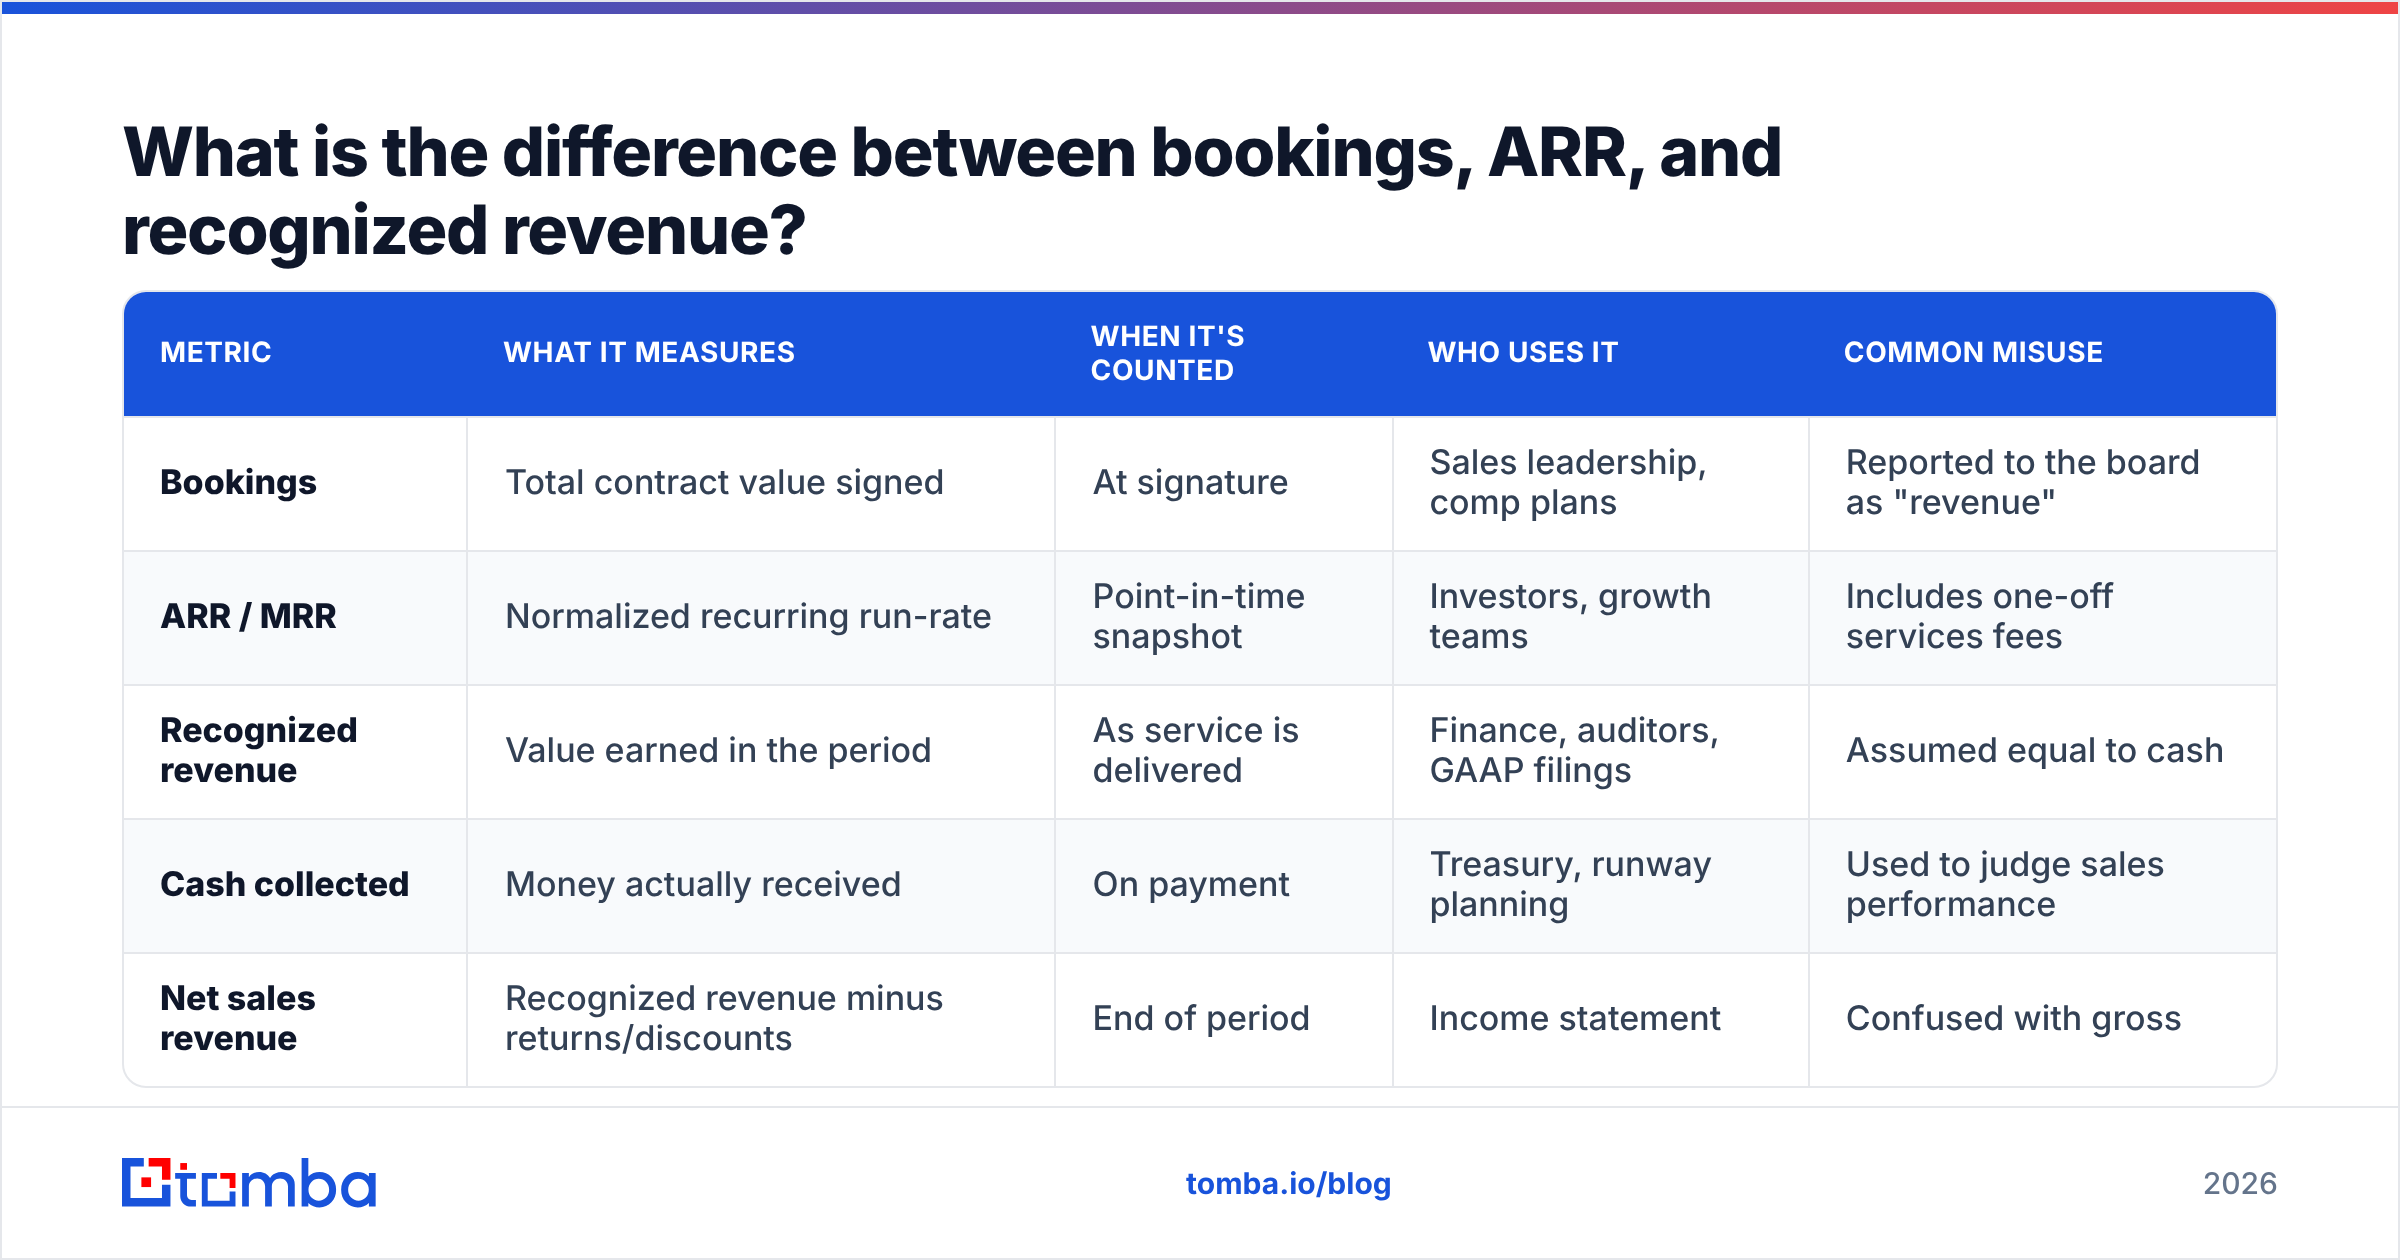
This is where most revenue reporting quietly falls apart. Four numbers, four meanings, one dashboard.
| Metric | What it measures | When it's counted | Who uses it | Common misuse |
|---|---|---|---|---|
| Bookings | Total contract value signed | At signature | Sales leadership, comp plans | Reported to the board as "revenue" |
| ARR / MRR | Normalized recurring run-rate | Point-in-time snapshot | Investors, growth teams | Includes one-off services fees |
| Recognized revenue | Value earned in the period | As service is delivered | Finance, auditors, GAAP filings | Assumed equal to cash |
| Cash collected | Money actually received | On payment | Treasury, runway planning | Used to judge sales performance |
| Net sales revenue | Recognized revenue minus returns/discounts | End of period | Income statement | Confused with gross |
A concrete illustration: a rep signs a three-year $360,000 contract in March. Bookings = $360,000 in March. ARR = $120,000. Recognized revenue in March = $10,000. Cash collected in March = $360,000 if the customer prepaid, $10,000 if billed monthly, $0 if the invoice terms are net-60.
All five of those statements are correct simultaneously. That is why "what was our revenue in March?" needs a follow-up question. The revenue operations function exists largely to keep these definitions from drifting apart across sales, marketing, and finance.
For the formal accounting treatment, the ASC 606 five-step model is the reference standard, and HubSpot's revenue recognition breakdown is a readable summary if you do not want to read the standard itself.
Which sales revenue metrics should you track alongside the total?#
The total number is a scoreboard. These are the metrics that tell you why the score moved.
- Average selling price (ASP) — net revenue divided by deals closed. If ASP is falling while deal count rises, your team is discounting to hit quota.
- Revenue per rep — net revenue divided by quota-carrying headcount. This is the number that determines whether hiring more reps will actually help.
- Net revenue retention (NRR) — expansion minus churn on existing accounts. Above 100% means you grow without a single new logo.
- Revenue concentration — percentage of revenue from your top five accounts. Above 25% and one churn event reshapes your quarter.
- Pipeline-to-revenue conversion — what share of qualified pipeline becomes recognized revenue. This is where data quality shows up as a number.
- Sales cycle length by segment — because a revenue forecast built on a blended cycle time is wrong for both ends of your customer base.
Track ASP and NRR monthly. Track concentration quarterly. Track the rest whenever a forecast misses by more than 10% and you need to find out why.
Why does bad contact data corrupt your revenue number?#
Because every revenue calculation inherits the quality of the pipeline that fed it.
Here is the chain. A rep imports a list of 5,000 prospects. Twenty percent of the emails bounce or belong to people who left the company two years ago. Those contacts still create CRM records. Those records still get associated with opportunities. Those opportunities still enter your pipeline total. Your forecast — built as pipeline x historical conversion rate — now contains ghost deals that were never reachable in the first place.
The damage is measurable in three places:
- Forecast accuracy. Inflated pipeline produces a forecast that misses high, quarter after quarter. Leadership responds by discounting the forecast with a gut-feel haircut, which is not a forecast at all.
- Deliverability. High bounce rates hurt sender reputation, which suppresses the deliverability of your legitimate outreach, which shrinks real pipeline. The data problem becomes a demand problem.
- Duplicate revenue counting. The same company entered as "Acme Corp," "Acme Corporation," and "acme.com" produces three opportunity records and a triple-counted deal.
The fix is unglamorous: verify contacts before they enter the CRM, not after. Running a list through an email verifier before import removes the invalid records that would otherwise become fake pipeline. When you are building target account lists from scratch, domain search gets you verified contacts at a company without the guesswork of pattern-generated addresses that may or may not resolve.

How do you calculate sales revenue forecasts that hold up?#
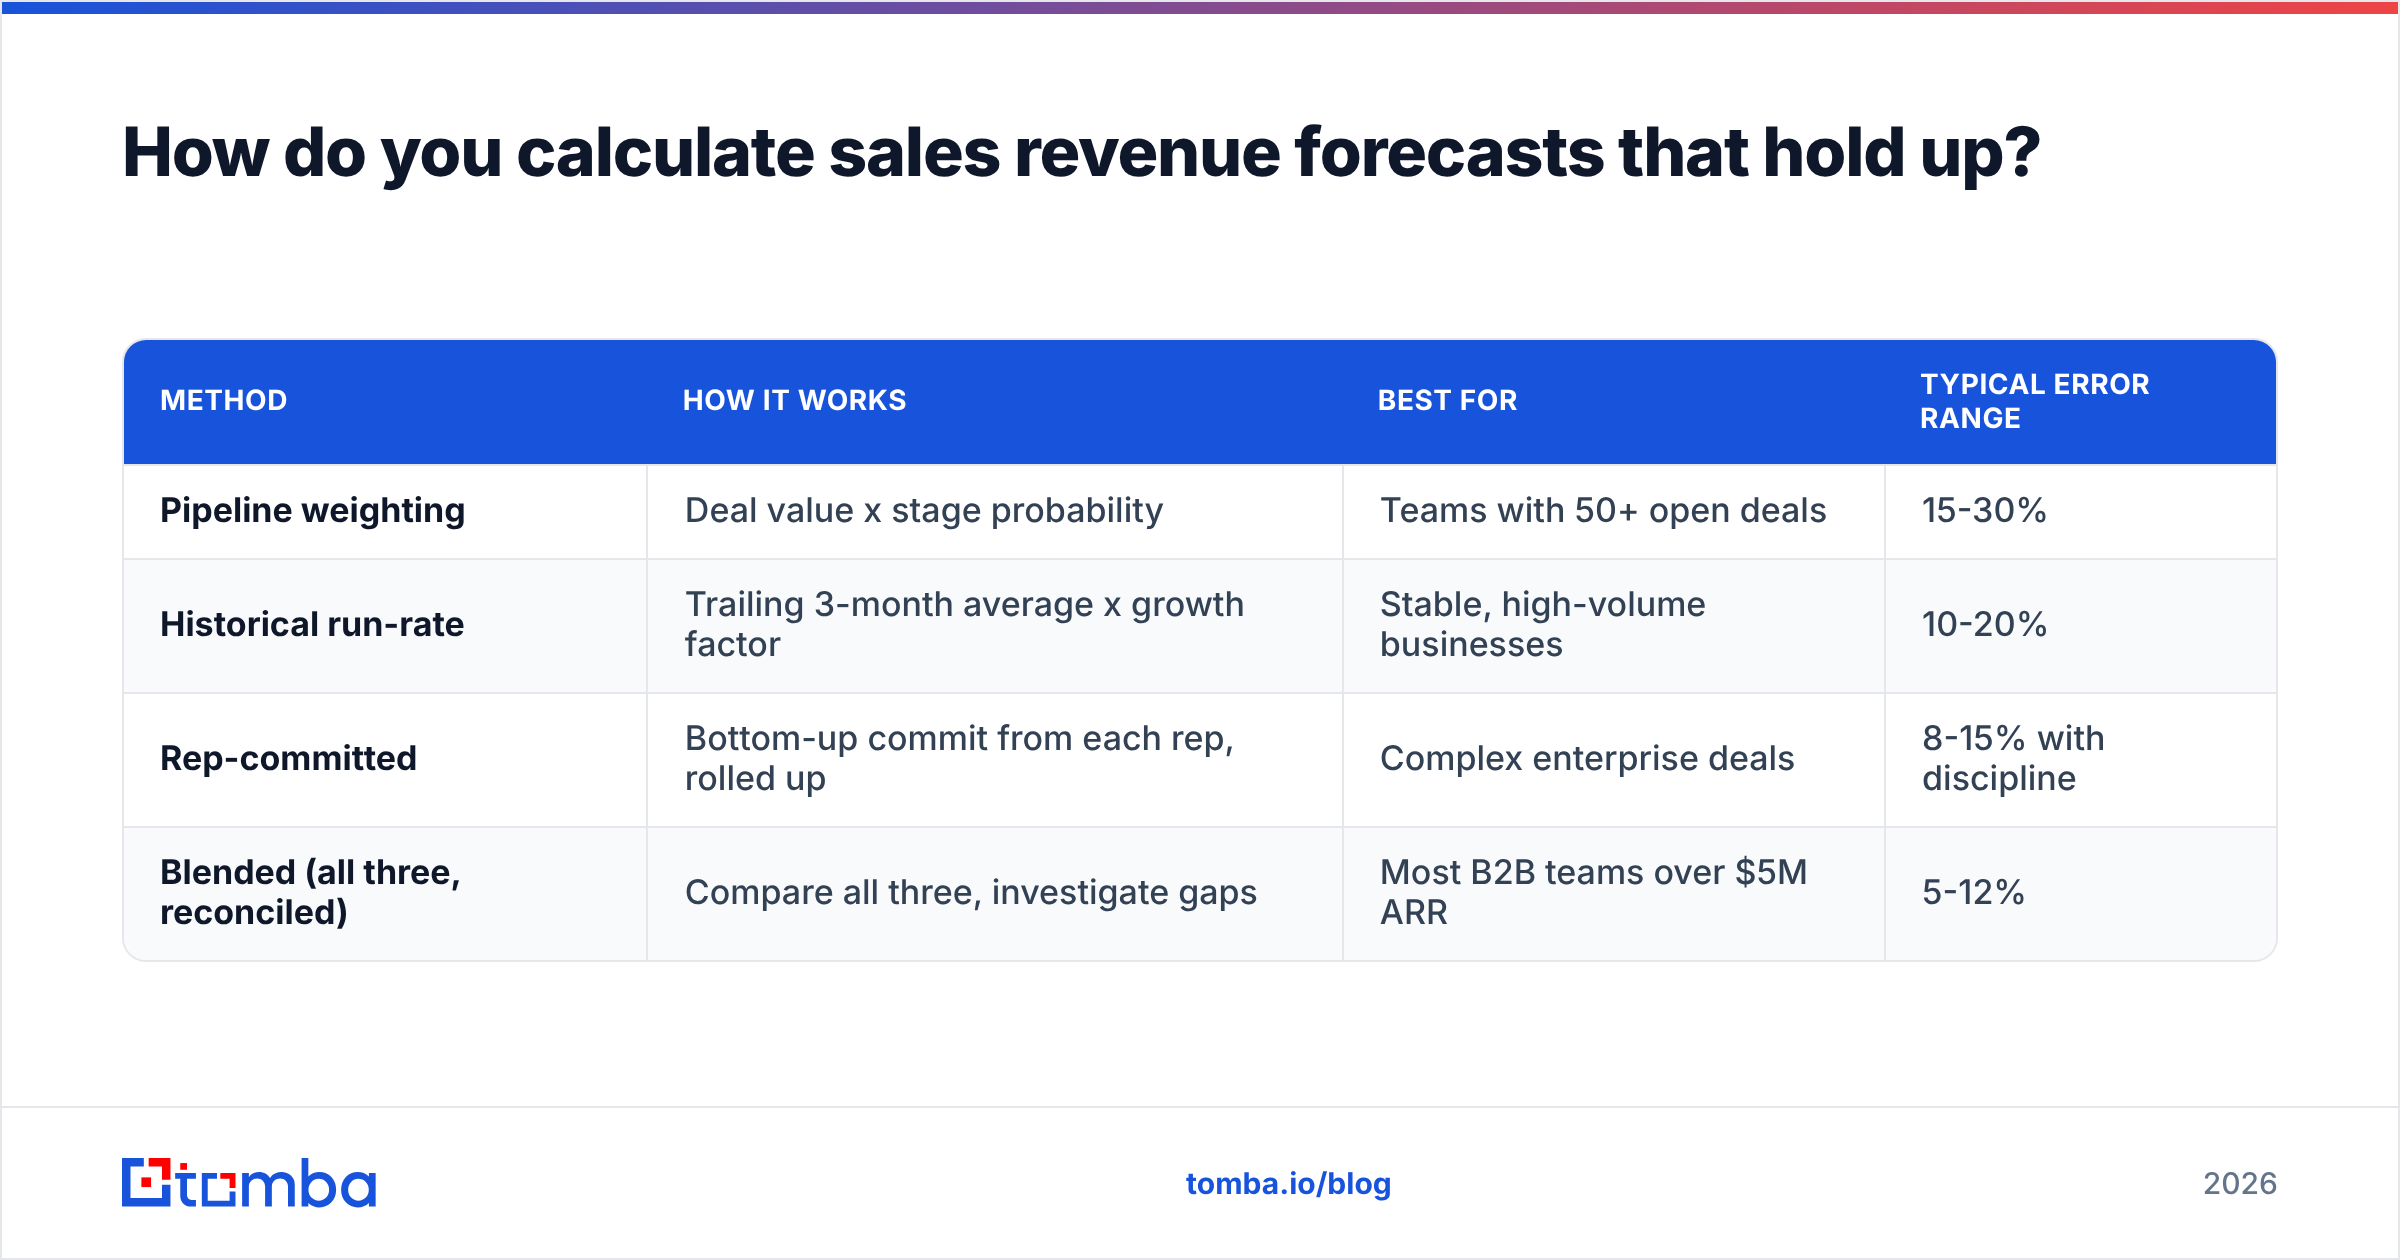
A forecast is a revenue calculation applied to deals that have not closed yet. Three methods, in ascending order of reliability.
| Method | How it works | Best for | Typical error range |
|---|---|---|---|
| Pipeline weighting | Deal value x stage probability | Teams with 50+ open deals | 15-30% |
| Historical run-rate | Trailing 3-month average x growth factor | Stable, high-volume businesses | 10-20% |
| Rep-committed | Bottom-up commit from each rep, rolled up | Complex enterprise deals | 8-15% with discipline |
| Blended (all three, reconciled) | Compare all three, investigate gaps | Most B2B teams over $5M ARR | 5-12% |
The blended approach wins not because the math is better but because the disagreements between methods are informative. When pipeline weighting says $800K and rep commits say $520K, that gap is a question worth asking in a pipeline review.
Two rules keep forecasts honest. First, stage probabilities must come from your own historical conversion data, not from CRM defaults — Salesforce's out-of-the-box percentages are a placeholder, not a model, and Salesforce's own forecasting documentation says as much. Second, any deal that has slipped two quarters in a row gets removed from the forecast entirely until something material changes.
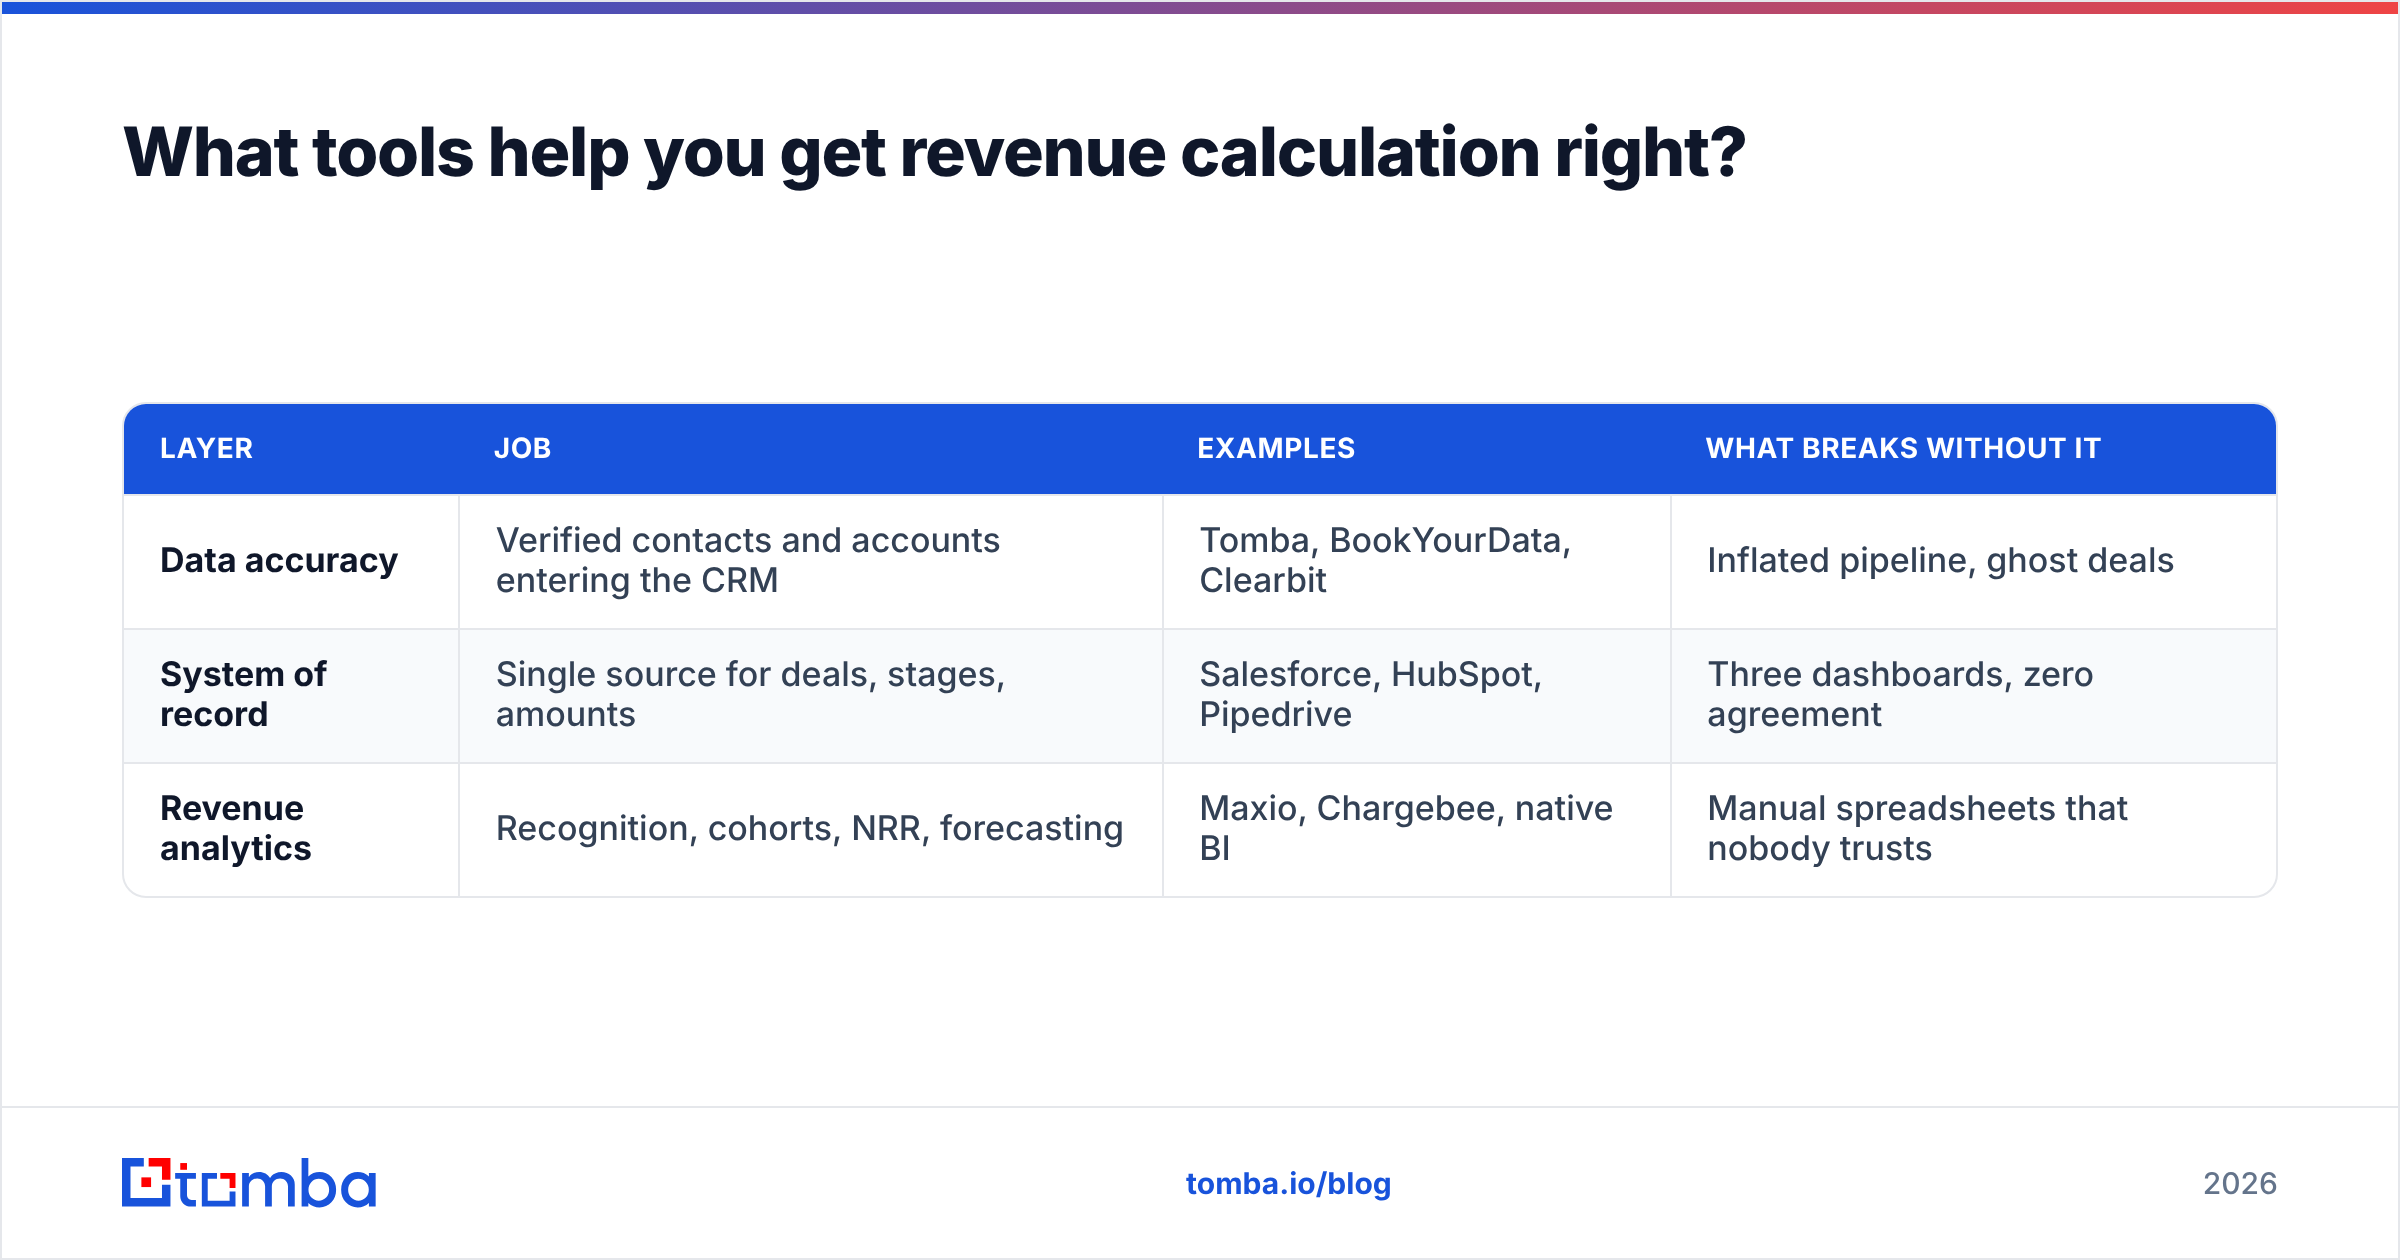
What tools help you get revenue calculation right?#
You need three layers, and most teams over-invest in the third while ignoring the first.
| Layer | Job | Examples | What breaks without it |
|---|---|---|---|
| Data accuracy | Verified contacts and accounts entering the CRM | Tomba, BookYourData, Clearbit | Inflated pipeline, ghost deals |
| System of record | Single source for deals, stages, amounts | Salesforce, HubSpot, Pipedrive | Three dashboards, zero agreement |
| Revenue analytics | Recognition, cohorts, NRR, forecasting | Maxio, Chargebee, native BI | Manual spreadsheets that nobody trusts |
On the data layer specifically, the choice usually comes down to enrichment coverage versus verified accuracy. Tomba pricing starts with a free tier at 25 searches per month, then Starter at $49/mo, Growth at $99/mo, and Pro at $249/mo — useful when your bottleneck is finding and verifying the contacts behind target accounts. BookYourData takes a different route with a pre-built, verified B2B database you buy from directly, which suits teams that want a list handed over rather than built. Both solve the same underlying problem: revenue math is only as good as the accounts it is calculated on.
For teams doing this at volume, an API-first approach beats manual exports. The Tomba API lets you verify and enrich contacts at the point of CRM creation, which is the only place the fix actually holds. If you would rather work in the spreadsheet where your revenue model already lives, the Google Sheets add-on does the same job without a data pipeline.
Independent review data on these categories is worth reading before you commit — G2's sales intelligence category shows how buyers actually rate coverage versus accuracy, which rarely matches the vendor claims.
What are the most common sales revenue mistakes?#
Five errors account for most revenue reporting failures.
- Reporting gross when everyone else reports net. Your number will always be higher and always be wrong in the room that matters. Pick net, say so explicitly, and show gross as a secondary line.
- Counting bookings as revenue. A $360,000 three-year deal is not a $360,000 quarter. This is the fastest way to lose credibility with a finance team or a due-diligence process.
- Ignoring the discount line. Discounts are frequently 8-15% of gross revenue in competitive B2B markets and almost never appear on the sales dashboard. Track them or your net will surprise you every quarter.
- Calculating on unverified pipeline. Covered above, and it is the most under-diagnosed of the five because the symptom (a missed forecast) never points back to the cause (a bad list imported eleven months ago).
- Changing the definition mid-year. If you switch from gross to net in Q3, every trend line in your board deck becomes meaningless. Change definitions at fiscal year boundaries only, and restate history when you do.
A sixth honorable mention: reporting revenue with no segmentation. A single blended number hides the fact that one product line grew 40% while another shrank 25%. The total looked flat. The business did not.
How do you build a revenue reporting cadence that works?#
Keep it simple enough that it survives a busy quarter.
- Weekly: pipeline movement, deals slipped, new bookings. No recognized revenue — it moves too slowly to be a weekly metric.
- Monthly: net sales revenue, ASP, NRR, discount rate as a percentage of gross. Reconciled against billing before it is circulated.
- Quarterly: revenue concentration, segment breakdown, forecast accuracy versus actual, cohort retention.
- Annually: definition review, stage probability recalibration, comp plan alignment to whichever revenue number you actually report.
One person owns the reconciliation. Not a committee. The moment two people can produce the official number independently, you have two official numbers.
Get the data layer right before you fix the formula#
The sales revenue formula is arithmetic. Units times price, minus returns, allowances, and discounts. You can learn it in a minute and apply it forever.
What takes real work is making sure the units, the accounts, and the pipeline behind that formula are real. Ghost contacts, duplicate accounts, and unverified email lists inflate the top of the funnel months before anyone notices the forecast is off — and by then the miss looks like a sales execution problem, not a data problem.
Start upstream. Use the Tomba Email Finder to build target account lists from verified professional email addresses, so the pipeline you calculate revenue against reflects companies you can actually reach. The free tier gives you 25 searches a month to test the accuracy against your own known-good contacts before you commit to a plan. A revenue number is only ever as trustworthy as the records underneath it.
Related guides#
Ready to find emails that actually work?
Join 150,000+ professionals who stopped guessing and started sending. Free credits on signup — no credit card required.
Get the Tomba newsletter
Practical outbound tactics and product updates — once every two weeks.
About the author