How to Calculate SAM: Serviceable Addressable Market Guide
SAM is the number that decides your quota, your territory map, and your next funding round. Here is the bottom-up method for calculating serviceable addressable market from real account data, plus the three mistakes that inflate it.
TL;DR
- SAM (serviceable addressable market) is the slice of your total addressable market you can actually sell to today — right geography, right segment, right product fit, right compliance posture.
- The only formula that survives scrutiny is bottom-up: SAM = qualifying accounts × average contract value. Everything else is a top-down guess wearing a suit.
- Getting the account count right is the hard part. Industry reports give you ranges; a verified contact dataset gives you a number you can defend line by line.
- Most decks inflate SAM by 3x to 10x by counting accounts they cannot legally, technically, or commercially serve.
- Rebuild SAM every quarter. Product launches, new locales, and pricing changes move it more than market growth does.
What is SAM, and how is it different from TAM and SOM?#
SAM is the portion of the total market your current product, pricing, and go-to-market can serve. Think of a pizza shop: TAM is everyone in the city who eats pizza, SAM is everyone inside your 20-minute delivery radius, and SOM is the households that will actually order from you this year instead of from the three other shops on the same street.
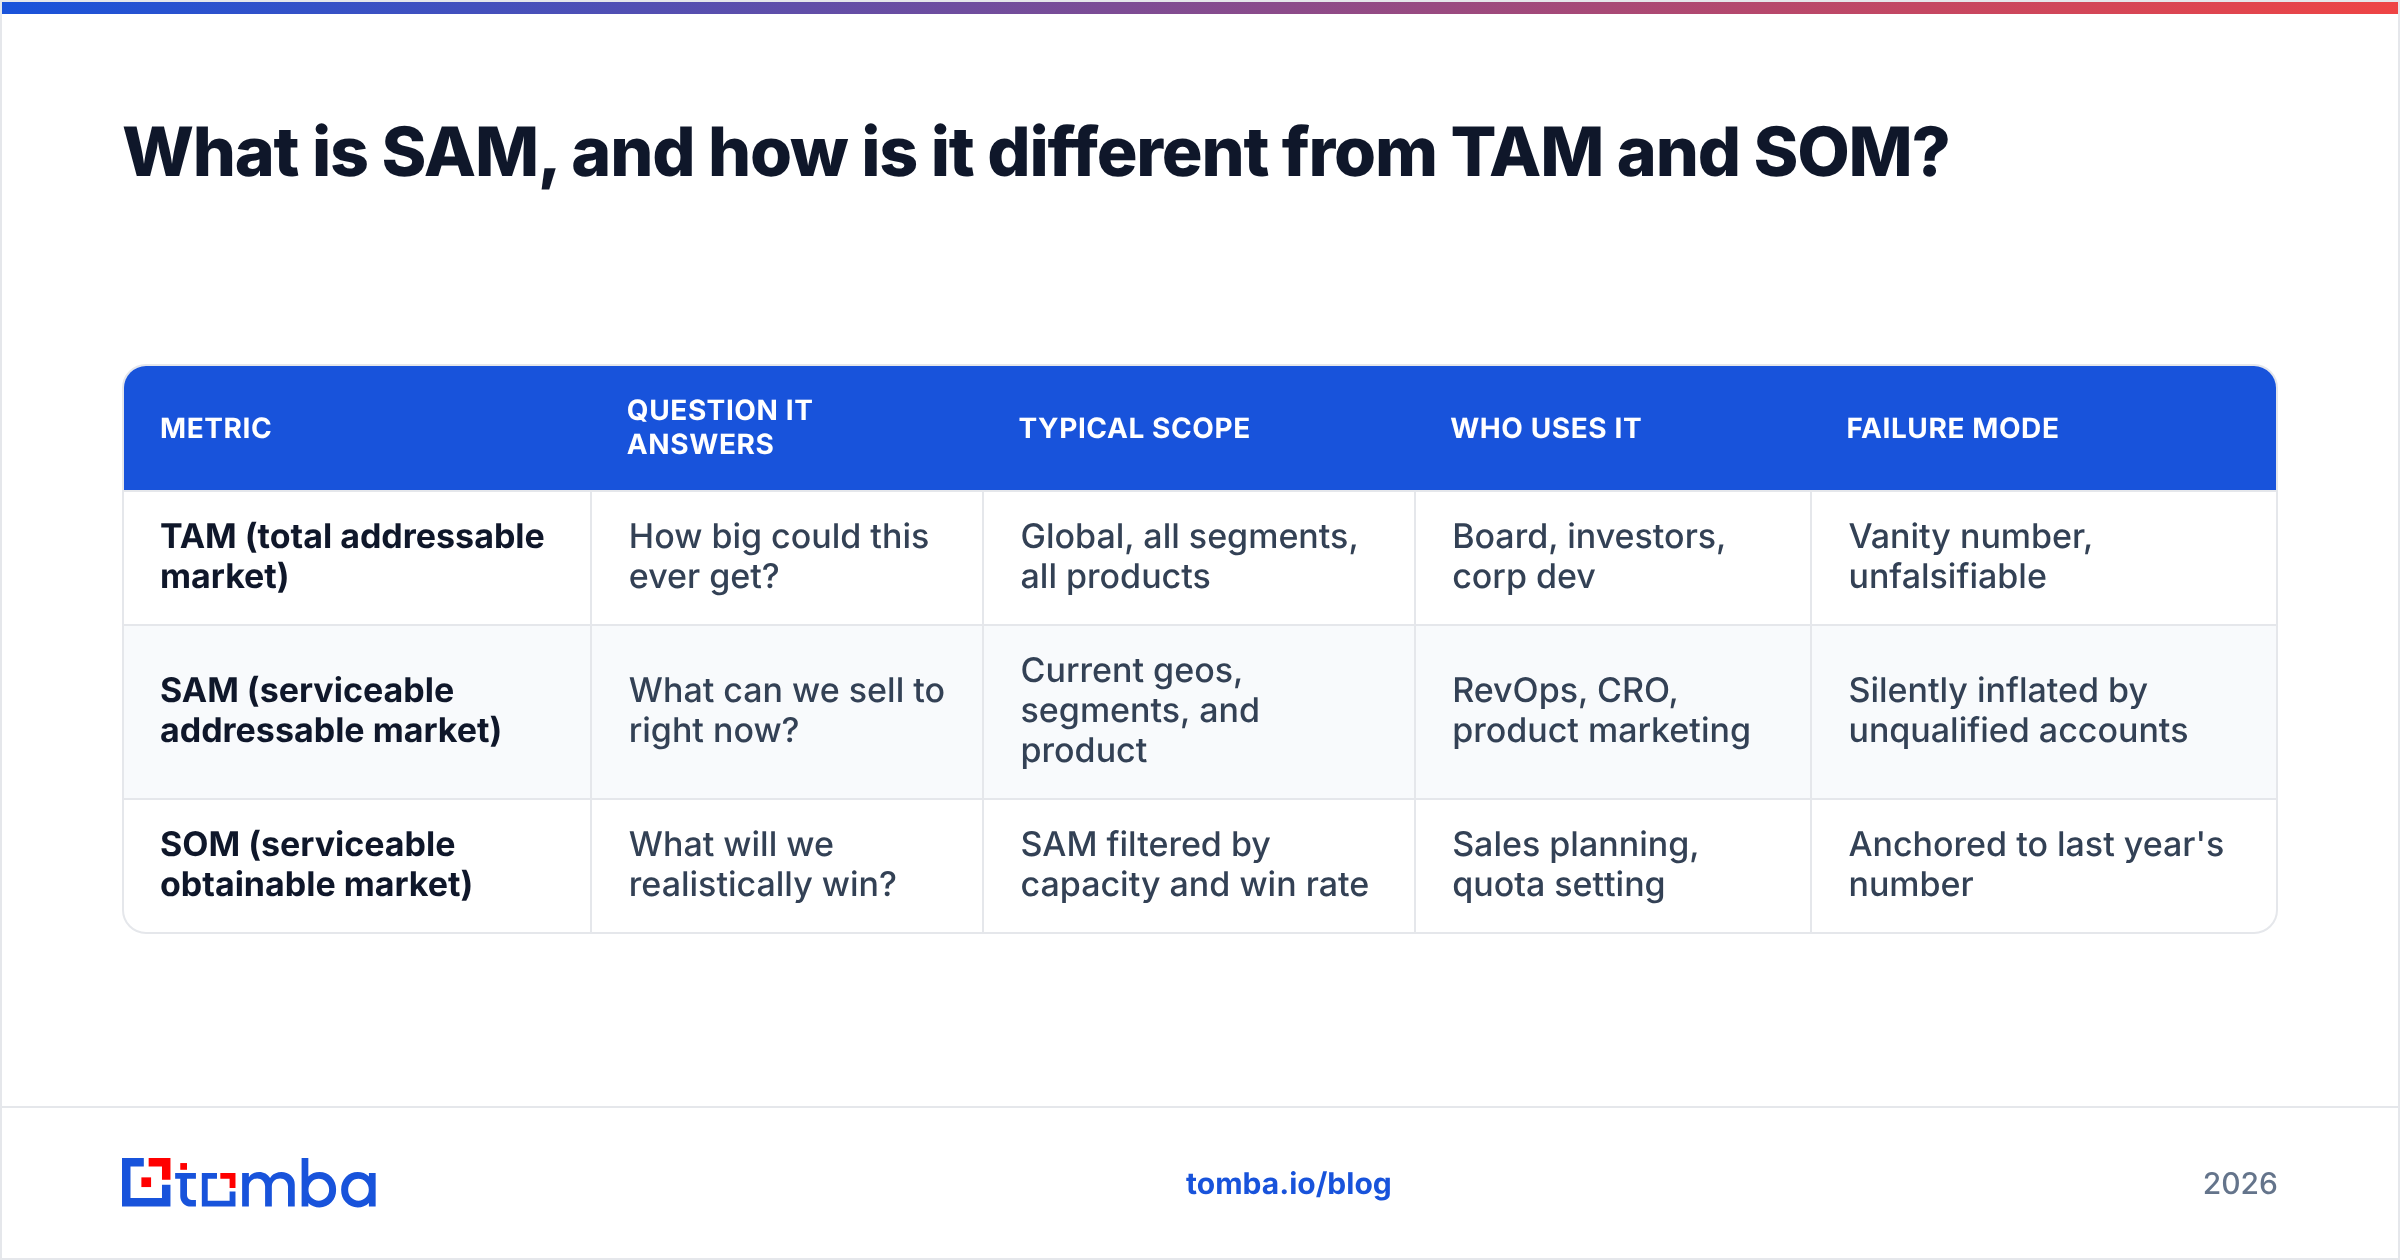
The three numbers answer three different questions, and confusing them is why market sizing slides get torn apart in diligence.
| Metric | Question it answers | Typical scope | Who uses it | Failure mode |
|---|---|---|---|---|
| TAM (total addressable market) | How big could this ever get? | Global, all segments, all products | Board, investors, corp dev | Vanity number, unfalsifiable |
| SAM (serviceable addressable market) | What can we sell to right now? | Current geos, segments, and product | RevOps, CRO, product marketing | Silently inflated by unqualified accounts |
| SOM (serviceable obtainable market) | What will we realistically win? | SAM filtered by capacity and win rate | Sales planning, quota setting | Anchored to last year's number |
The clean relationship: TAM ⊇ SAM ⊇ SOM. If your SAM is 90% of your TAM, you have either defined TAM too narrowly or defined SAM too generously. If your SOM is 40% of your SAM, you are assuming a market share almost nobody achieves outside of a monopoly.
For the formal definitions and the academic lineage of these terms, the Wikipedia entry on total addressable market is a reasonable neutral reference.
What is the formula for calculating SAM?#
There is one formula worth memorizing:
SAM = (number of accounts that meet your qualifying criteria) × (average annual contract value for that segment)
That is it. The complexity is not in the arithmetic — it is in defining "qualifying criteria" honestly and then counting the accounts accurately.
Your qualifying criteria should be a written filter with five to six dimensions:
- Geography — countries or regions where you can contract, invoice, support, and comply. If you cannot process a EUR invoice or handle a data residency clause, the EU is not in your SAM yet.
- Firmographics — employee count and revenue bands where your pricing lands. A $49/month tool has a different SAM than a $50,000 annual platform, even in an identical industry.
- Industry / vertical — NAICS or SIC codes where your product solves a real problem. Be strict. "Could theoretically use it" is TAM thinking.
- Technographics — required stack. If your product only works with Salesforce or HubSpot, accounts without those systems are out until you build the connector.
- Reachability — accounts where you can actually contact a decision maker. An account with no discoverable buying committee is not addressable in any practical sense.
- Exclusions — existing customers, active churned logos in cooldown, competitors, and any account blocked by policy or regulation.
Each filter should be a query you can run, not an adjective. "Mid-market SaaS companies in North America" is a vibe. "US and Canada, 50–500 employees, NAICS 5112, using HubSpot or Salesforce, at least one verified marketing-ops contact" is a SAM definition.
Which method should you use to calculate SAM?#
Three methods dominate. They are not equally good, and the gap between them widens the more specific your ICP is.
| Method | How it works | Data needed | Accuracy | Best for | Effort |
|---|---|---|---|---|---|
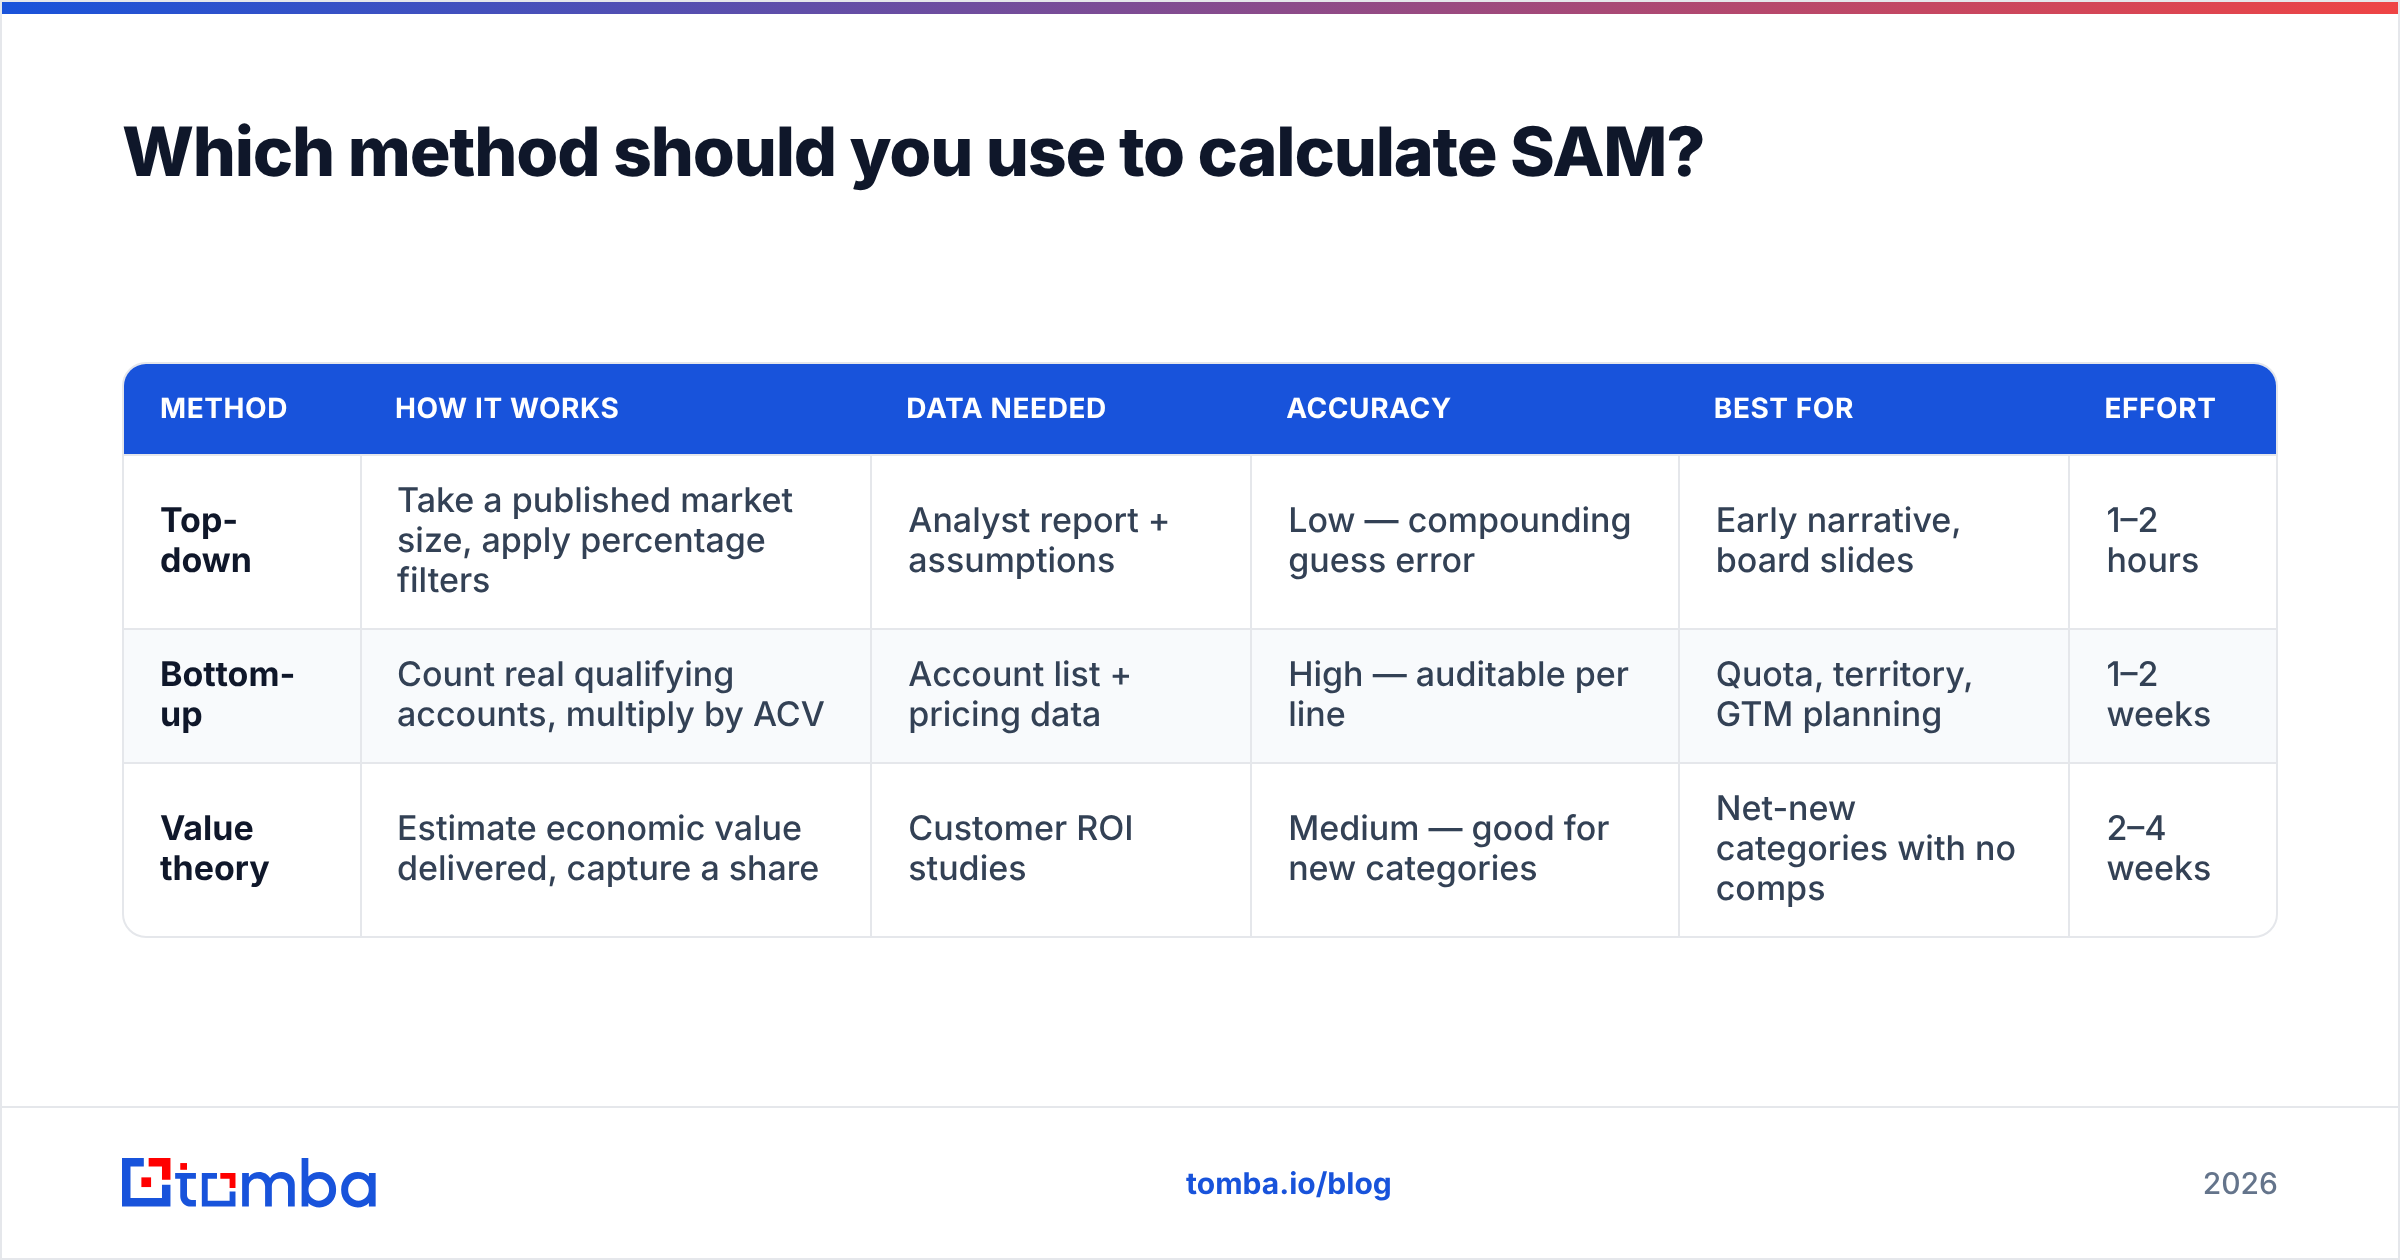
| Top-down | Take a published market size, apply percentage filters | Analyst report + assumptions | Low — compounding guess error | Early narrative, board slides | 1–2 hours |
| Bottom-up | Count real qualifying accounts, multiply by ACV | Account list + pricing data | High — auditable per line | Quota, territory, GTM planning | 1–2 weeks |
| Value theory | Estimate economic value delivered, capture a share | Customer ROI studies | Medium — good for new categories | Net-new categories with no comps | 2–4 weeks |
Top-down starts with something like "the global CRM market is $96B" and multiplies down: 30% is mid-market, 40% is North America, 25% needs our specific capability. You land on $2.88B and nobody can check any of the three percentages. It is fast and it is fiction. Use it for a first pass, never for planning.
Bottom-up starts with a list. You enumerate the companies that pass your filter, count them, and multiply by realistic ACV. Every number traces to a row. When a VP asks "why 14,200 and not 40,000?", you can export the list. HubSpot's market sizing guide makes the same case: bottom-up survives scrutiny because it is reconstructible.
Value theory matters when you have created a category and there is no market report to divide. You calculate the annual economic value your product creates per customer (hours saved, revenue unlocked, penalties avoided), assume you can capture 10–20% of that in price, and multiply by account count. It still needs an account count — so it is really bottom-up with a different pricing input.
The honest answer: build bottom-up, then sanity-check it against top-down. If they differ by more than about 3x, one of your assumptions is broken and you need to find out which before the number reaches a slide.
How do you calculate SAM step by step?#
Here is the sequence that produces a defensible number. Budget roughly a week for the first build; subsequent quarters take an afternoon.
- Write the ICP filter as a query. Six dimensions, each with explicit values. Get sales leadership to sign off on the filter before you count anything — arguing about criteria after the number exists never goes well.
- Build the account universe. Pull companies matching your firmographic and industry filters from a business registry, an analyst dataset, or a B2B database. Public sources like the US Census County Business Patterns give you free establishment counts by NAICS code and employee band — a solid free baseline for US-only SAM.
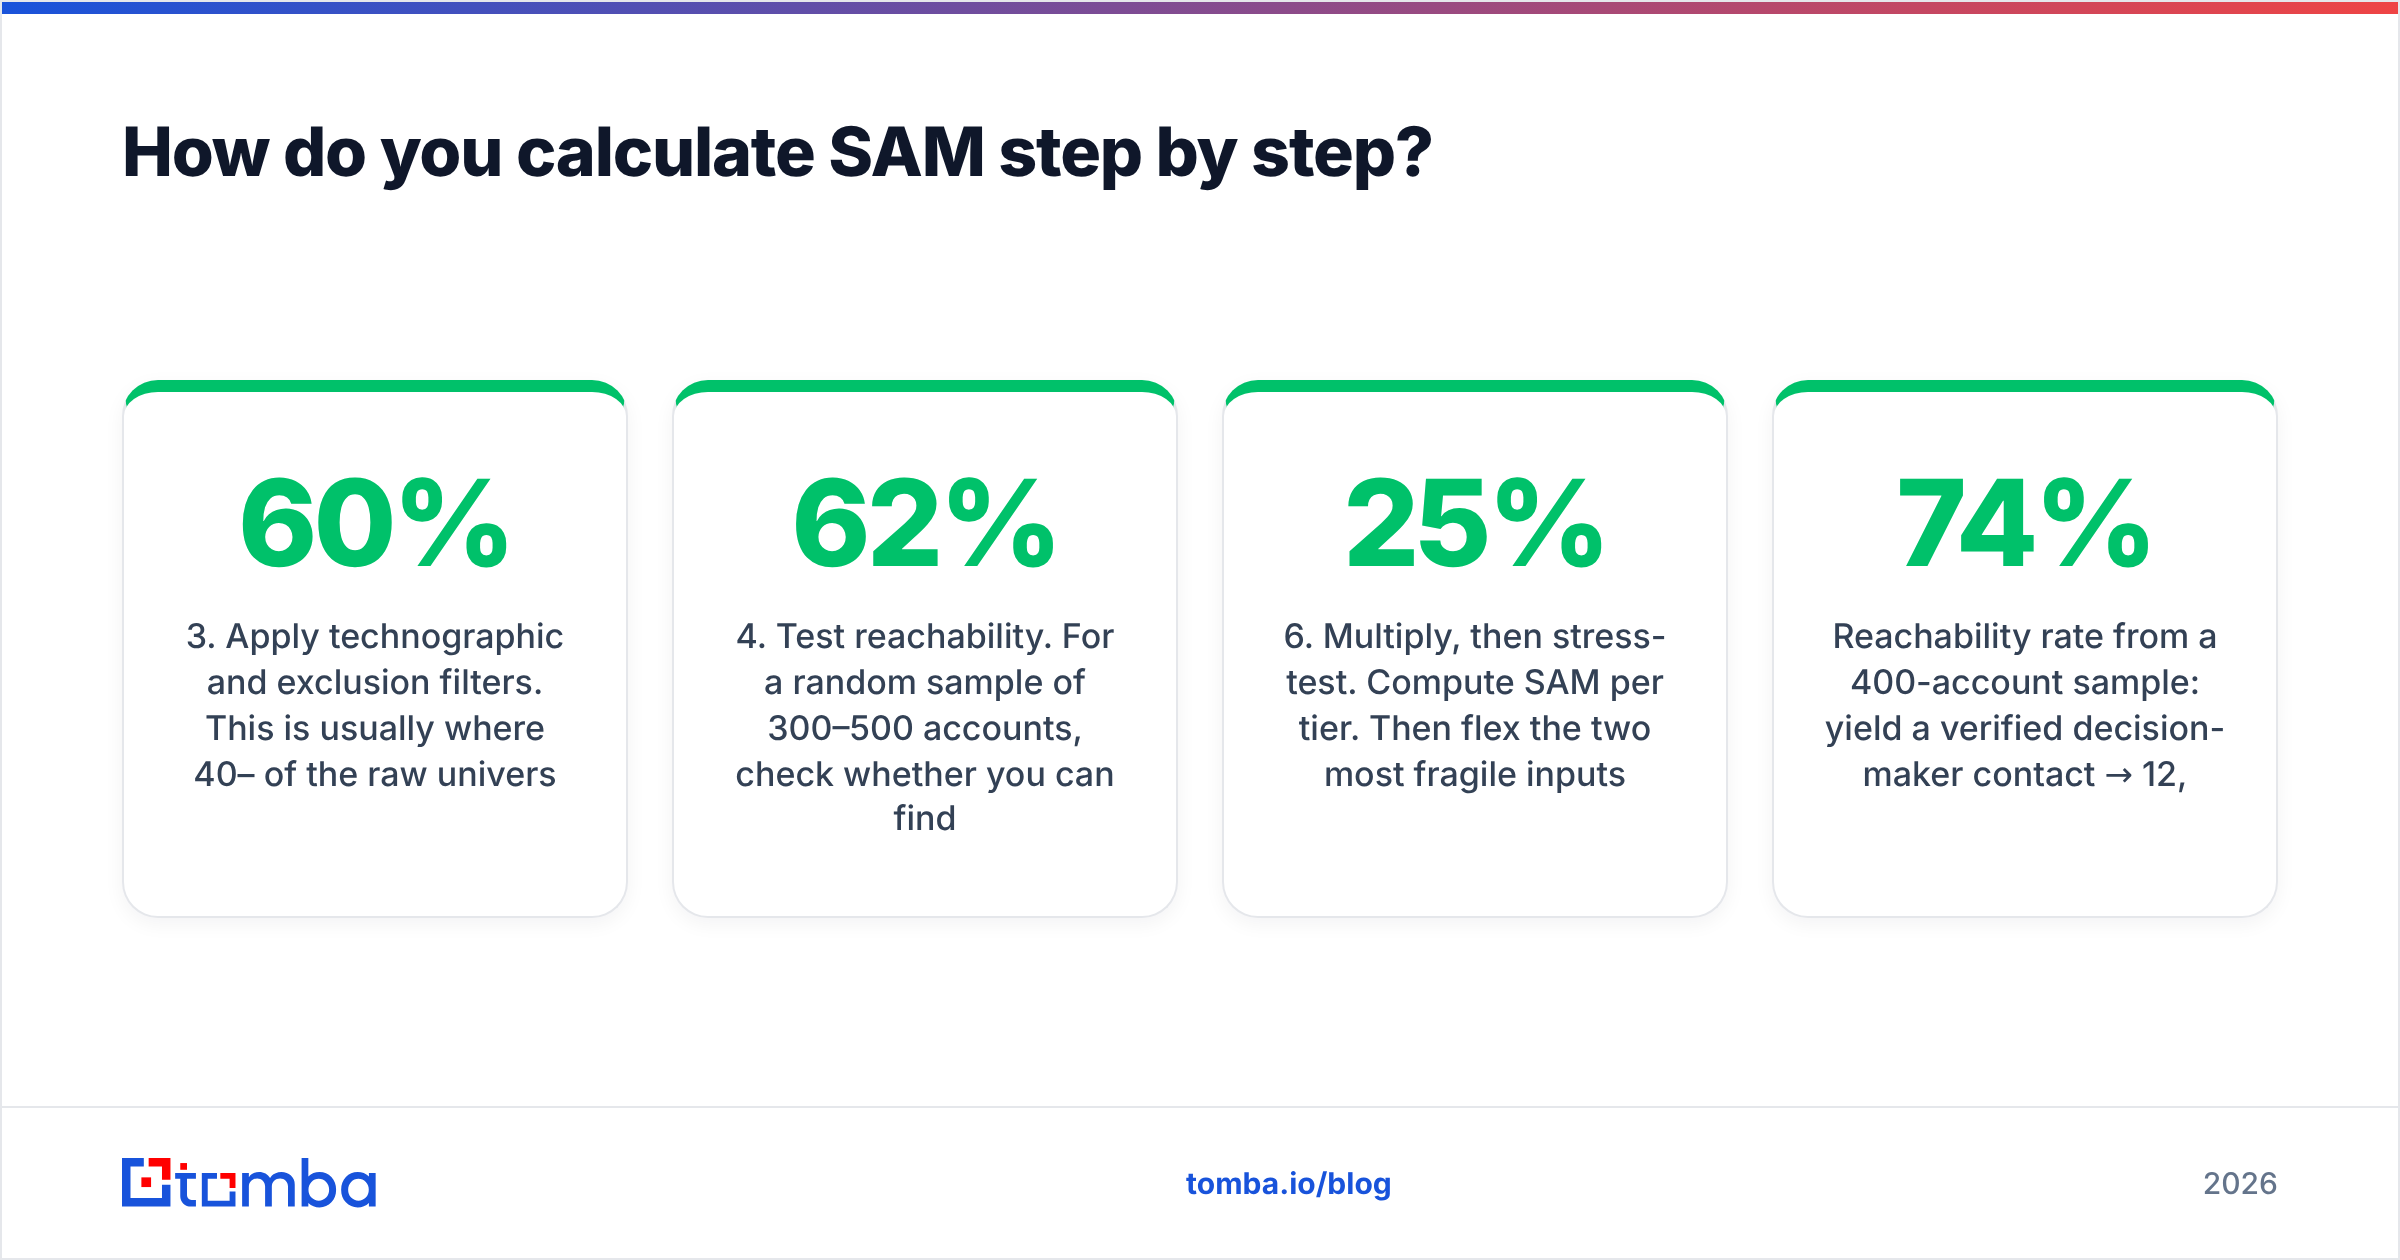
- Apply technographic and exclusion filters. This is usually where 40–60% of the raw universe drops out. Document each drop so the shrinkage is explainable.
- Test reachability. For a random sample of 300–500 accounts, check whether you can find a real, verified contact in the buying committee. Run a domain search against each domain, then push results through an email verifier so bounced or catch-all addresses do not count as "reachable". If only 62% of the sample yields a verified contact, your addressable count is 62% of your filtered count — not 100%.
- Set ACV by segment, not in aggregate. A blended ACV hides the fact that your 200-employee accounts pay 4x what your 50-employee accounts do. Split the SAM into two or three tiers and calculate each separately, then sum.
- Multiply, then stress-test. Compute SAM per tier. Then flex the two most fragile inputs — reachability rate and ACV — by ±25% and report the range, not a single point estimate.
A worked example#
Say you sell a compliance workflow tool to mid-market financial services firms in the US and UK.
- Raw universe: 41,000 firms in the target NAICS codes with 100–1,000 employees.
- After technographic filter (must run one of three core banking platforms): 18,400.
- After exclusions (existing customers, competitors, regulated-out entities): 17,100.
- Reachability rate from a 400-account sample: 74% yield a verified decision-maker contact → 12,654 addressable accounts.
- ACV: 9,100 accounts in the 100–300 employee tier at $18,000; 3,554 in the 300–1,000 tier at $47,000.
SAM = (9,100 × $18,000) + (3,554 × $47,000) = $163.8M + $167.0M = $330.8M.
That is a number you can walk a board through row by row. Compare it to the top-down version — "the $12B global regtech market, 25% mid-market, 30% our niche" = $900M — and you can see exactly which assumption was doing the inflating.
What data do you actually need, and where does it come from?#
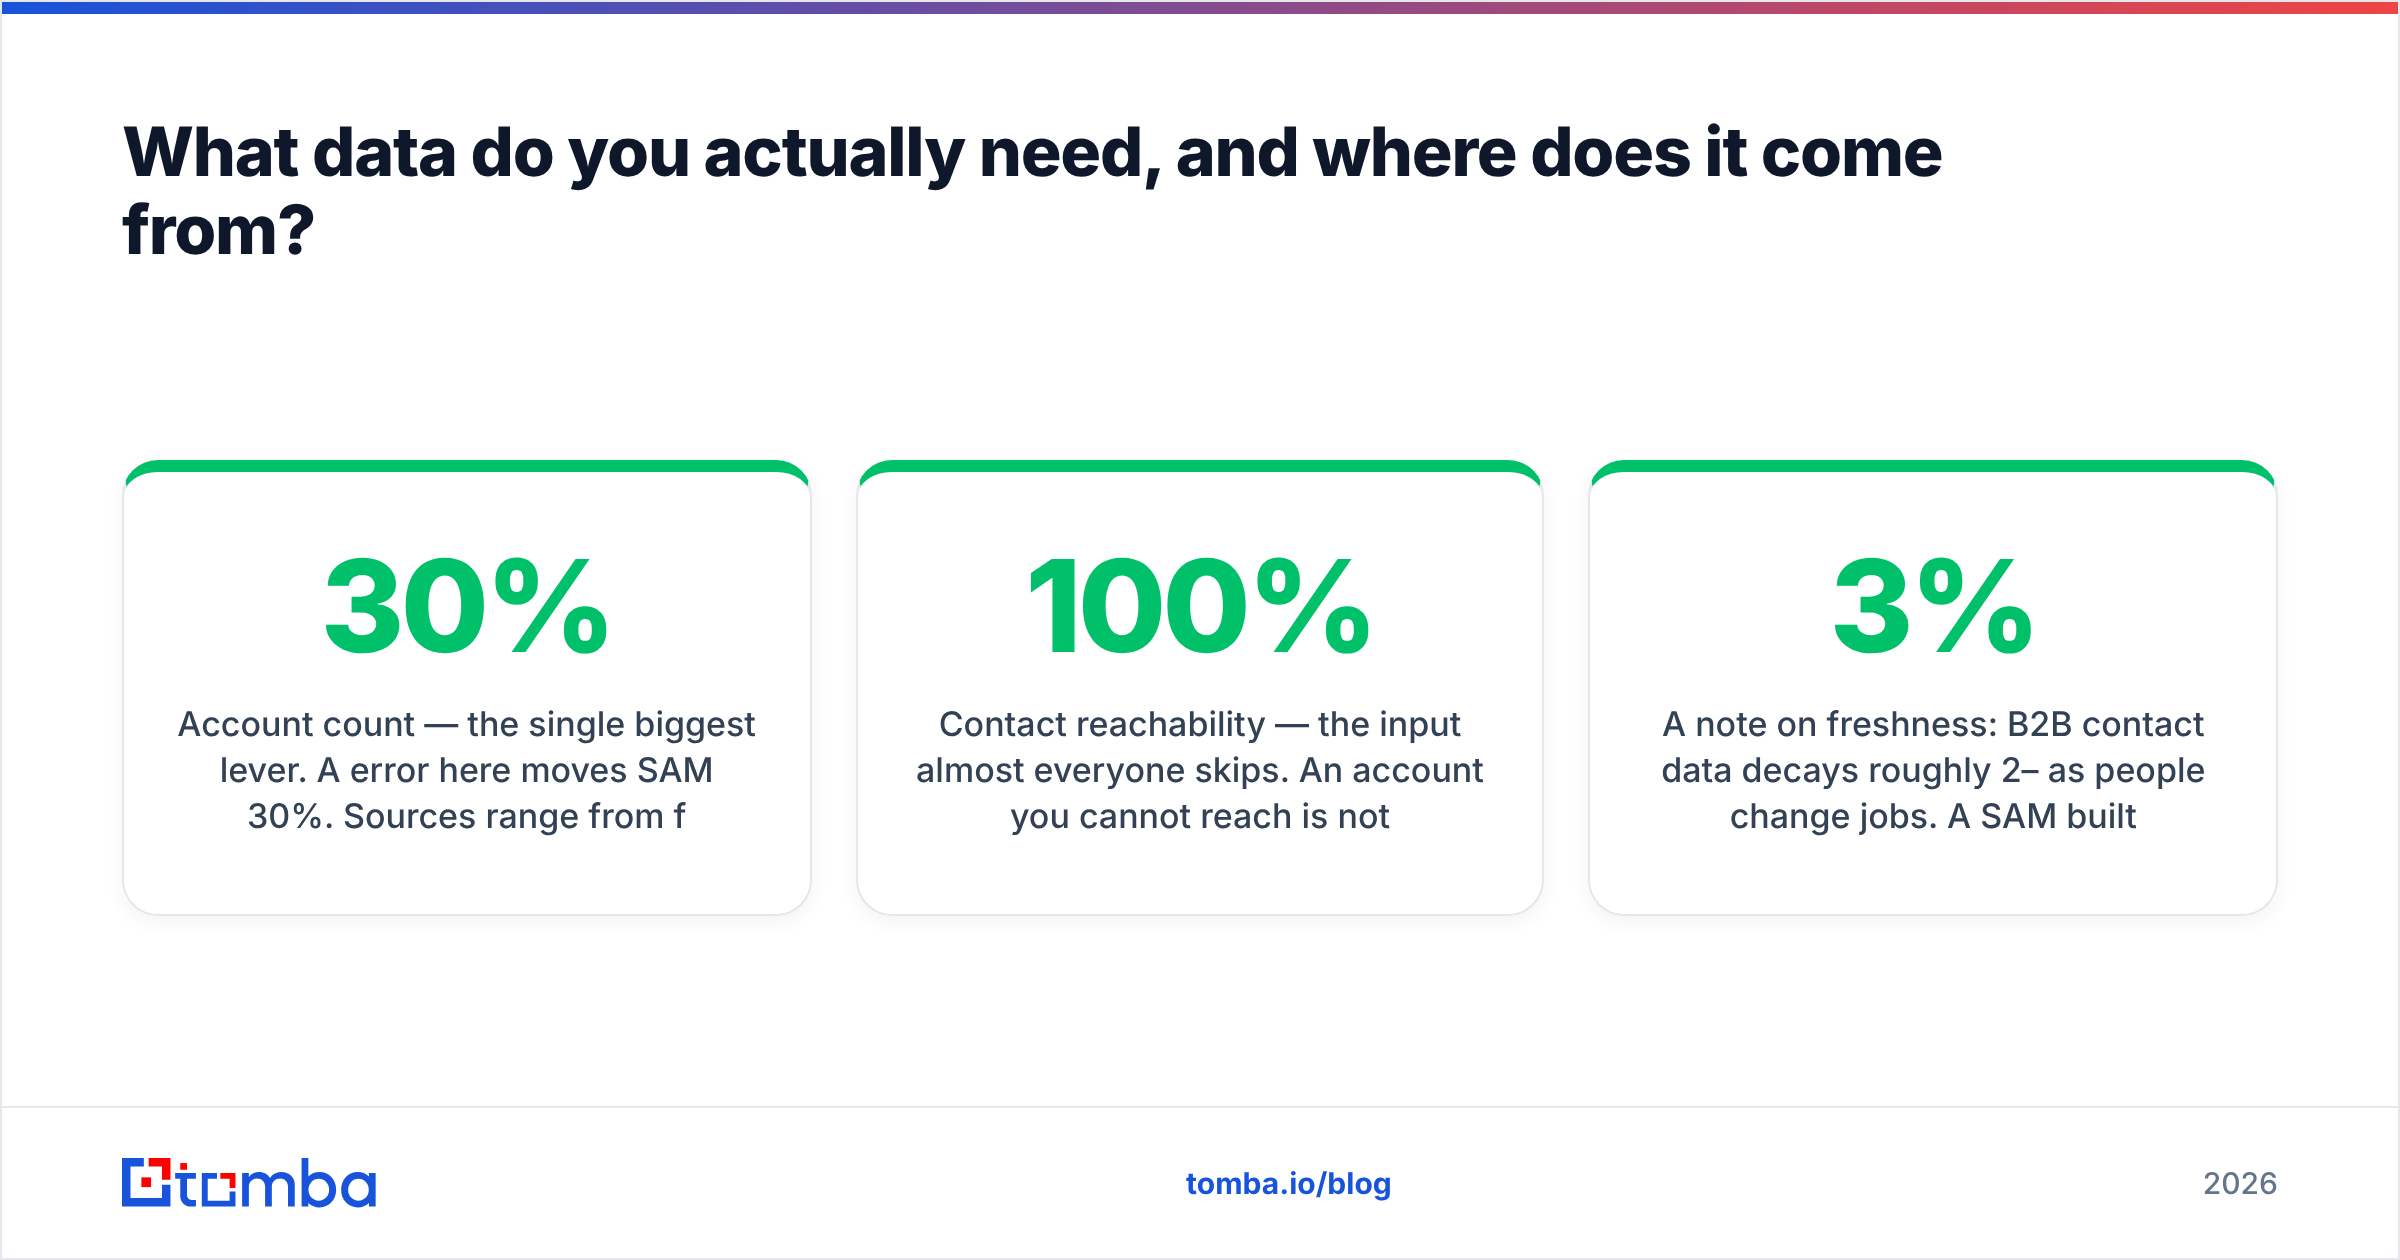
SAM accuracy is downstream of data accuracy. Three inputs matter most, in this order:
- Account count — the single biggest lever. A 30% error here moves SAM 30%. Sources range from free government registries (accurate but coarse) to commercial B2B datasets and providers like BookYourData or a self-serve contact database (granular, faster, but worth spot-checking).
- Contact reachability — the input almost everyone skips. An account you cannot reach is not addressable revenue. Measure it on a sample, do not assume 100%. Running a data enrichment pass over your sample turns "we think we can reach them" into a measured percentage.
- ACV by segment — pull from closed-won deals in the last 12 months, not from your price list. List price and realized price diverge fast once discounting starts.
A note on freshness: B2B contact data decays roughly 2–3% per month as people change jobs. A SAM built on a list you bought 18 months ago is materially wrong even if the methodology was perfect. That is why the reachability sample needs re-running each quarter, not just once.
Where do most SAM calculations go wrong?#
Five failure patterns account for most of the damage:
- Counting accounts you cannot legally serve. Data residency, export controls, and sector regulations remove real accounts. If you have no plan to comply this fiscal year, those accounts belong in TAM, not SAM.
- Using list price instead of realized ACV. A 22% average discount applied to a $200M SAM quietly removes $44M.
- Treating catch-all domains as reachable. Catch-all servers accept every address, so a naive verification pass marks them valid. They are not. Segment them separately with a catch-all verifier before counting them as addressable.
- Double-counting subsidiaries. Enterprise account hierarchies mean one buying entity can appear as eight rows. Deduplicate on parent domain before counting.
- Never rebuilding it. SAM changes when you launch a locale, ship an integration, or move upmarket. Teams that set it once and cite it for two years end up with quotas anchored to a market that no longer exists.
How often should you recalculate SAM?#
Quarterly for the full rebuild, monthly for the inputs that drift.
A practical cadence:
- Monthly: refresh the reachability sample (300–500 accounts) and update ACV from the last 90 days of closed-won.
- Quarterly: rerun the full account universe query, re-apply filters, and re-baseline SAM for planning.
- On trigger: rebuild immediately after a new locale launch, a pricing change over 15%, a major integration ship, or an ICP change coming out of win/loss analysis.
Tie the recalculation to your revenue operations planning cycle so the number lands before territory carving, not after. A SAM that arrives two weeks after quotas are set is a report; one that arrives two weeks before is a decision.
Can you calculate SAM without buying a market research report?#
Yes, and for most B2B companies under $50M ARR the DIY version is more accurate than the report anyway — because the report was not built around your ICP filter.
The minimum viable stack: a free registry for establishment counts by industry and size band, a scraped or purchased account list for the technographic filter, and a contact discovery pass to measure reachability. The last piece is where teams underinvest. You do not need contacts for every account in your SAM — you need them for a statistically valid sample, which for a universe of 15,000 accounts is a few hundred lookups. That is a weekend of work, not a procurement cycle.
If you want the number to be more than a slide, sample the accounts, verify the contacts, and report the range.
Build your SAM on contacts you can actually reach. The gap between "17,100 filtered accounts" and "12,654 addressable accounts" is the difference between a SAM your board believes and one they discount by half. Run your sample through the Tomba Email Finder to measure real reachability per segment, verify before you count, and get a market size you can defend line by line. Start free with 25 searches a month, or see Tomba pricing — Starter is $49/mo — when you are ready to sample at scale.
Related guides#
Ready to find emails that actually work?
Join 150,000+ professionals who stopped guessing and started sending. Free credits on signup — no credit card required.
Get the Tomba newsletter
Practical outbound tactics and product updates — once every two weeks.
About the author