How to Calculate SOM: A 5-Step Market Sizing Framework
Most SOM numbers are a percentage someone picked in a board deck. Here is the bottom-up method: real account counts, real reachability, real conversion math — plus a worked example you can copy.
TL;DR
- SOM (Serviceable Obtainable Market) is the slice of your SAM you can realistically win in a defined period — usually the next 12 months. It is a capacity number, not an ambition number.
- The only defensible way to calculate SOM is bottom-up: count real accounts, subtract the ones you cannot reach, then apply your actual reply, meeting, and win rates.
- The classic shortcut — "we'll take 3% of SAM" — is not a calculation. It is a guess wearing a percentage sign.
- You need three data inputs: an account count, contactable-contact coverage per account, and your own funnel conversion rates. The first two are data problems; the third is a CRM problem.
- Worked example below: a $12K ACV product with a $288M SAM lands at a $1.1M SOM — and that number survives a board question.
What is SOM, and how is it different from TAM and SAM?#
SOM is the revenue you can actually capture given your team, your reach, and your close rates over a fixed window.
Think of it like fishing. TAM is the whole ocean. SAM is the part of the ocean where your species of fish actually lives and where your boat is legally allowed to go. SOM is how many fish you can pull in this season with the crew, boats, and nets you currently own. Most founders describe the ocean and then act surprised when the freezer is empty.
Technically:
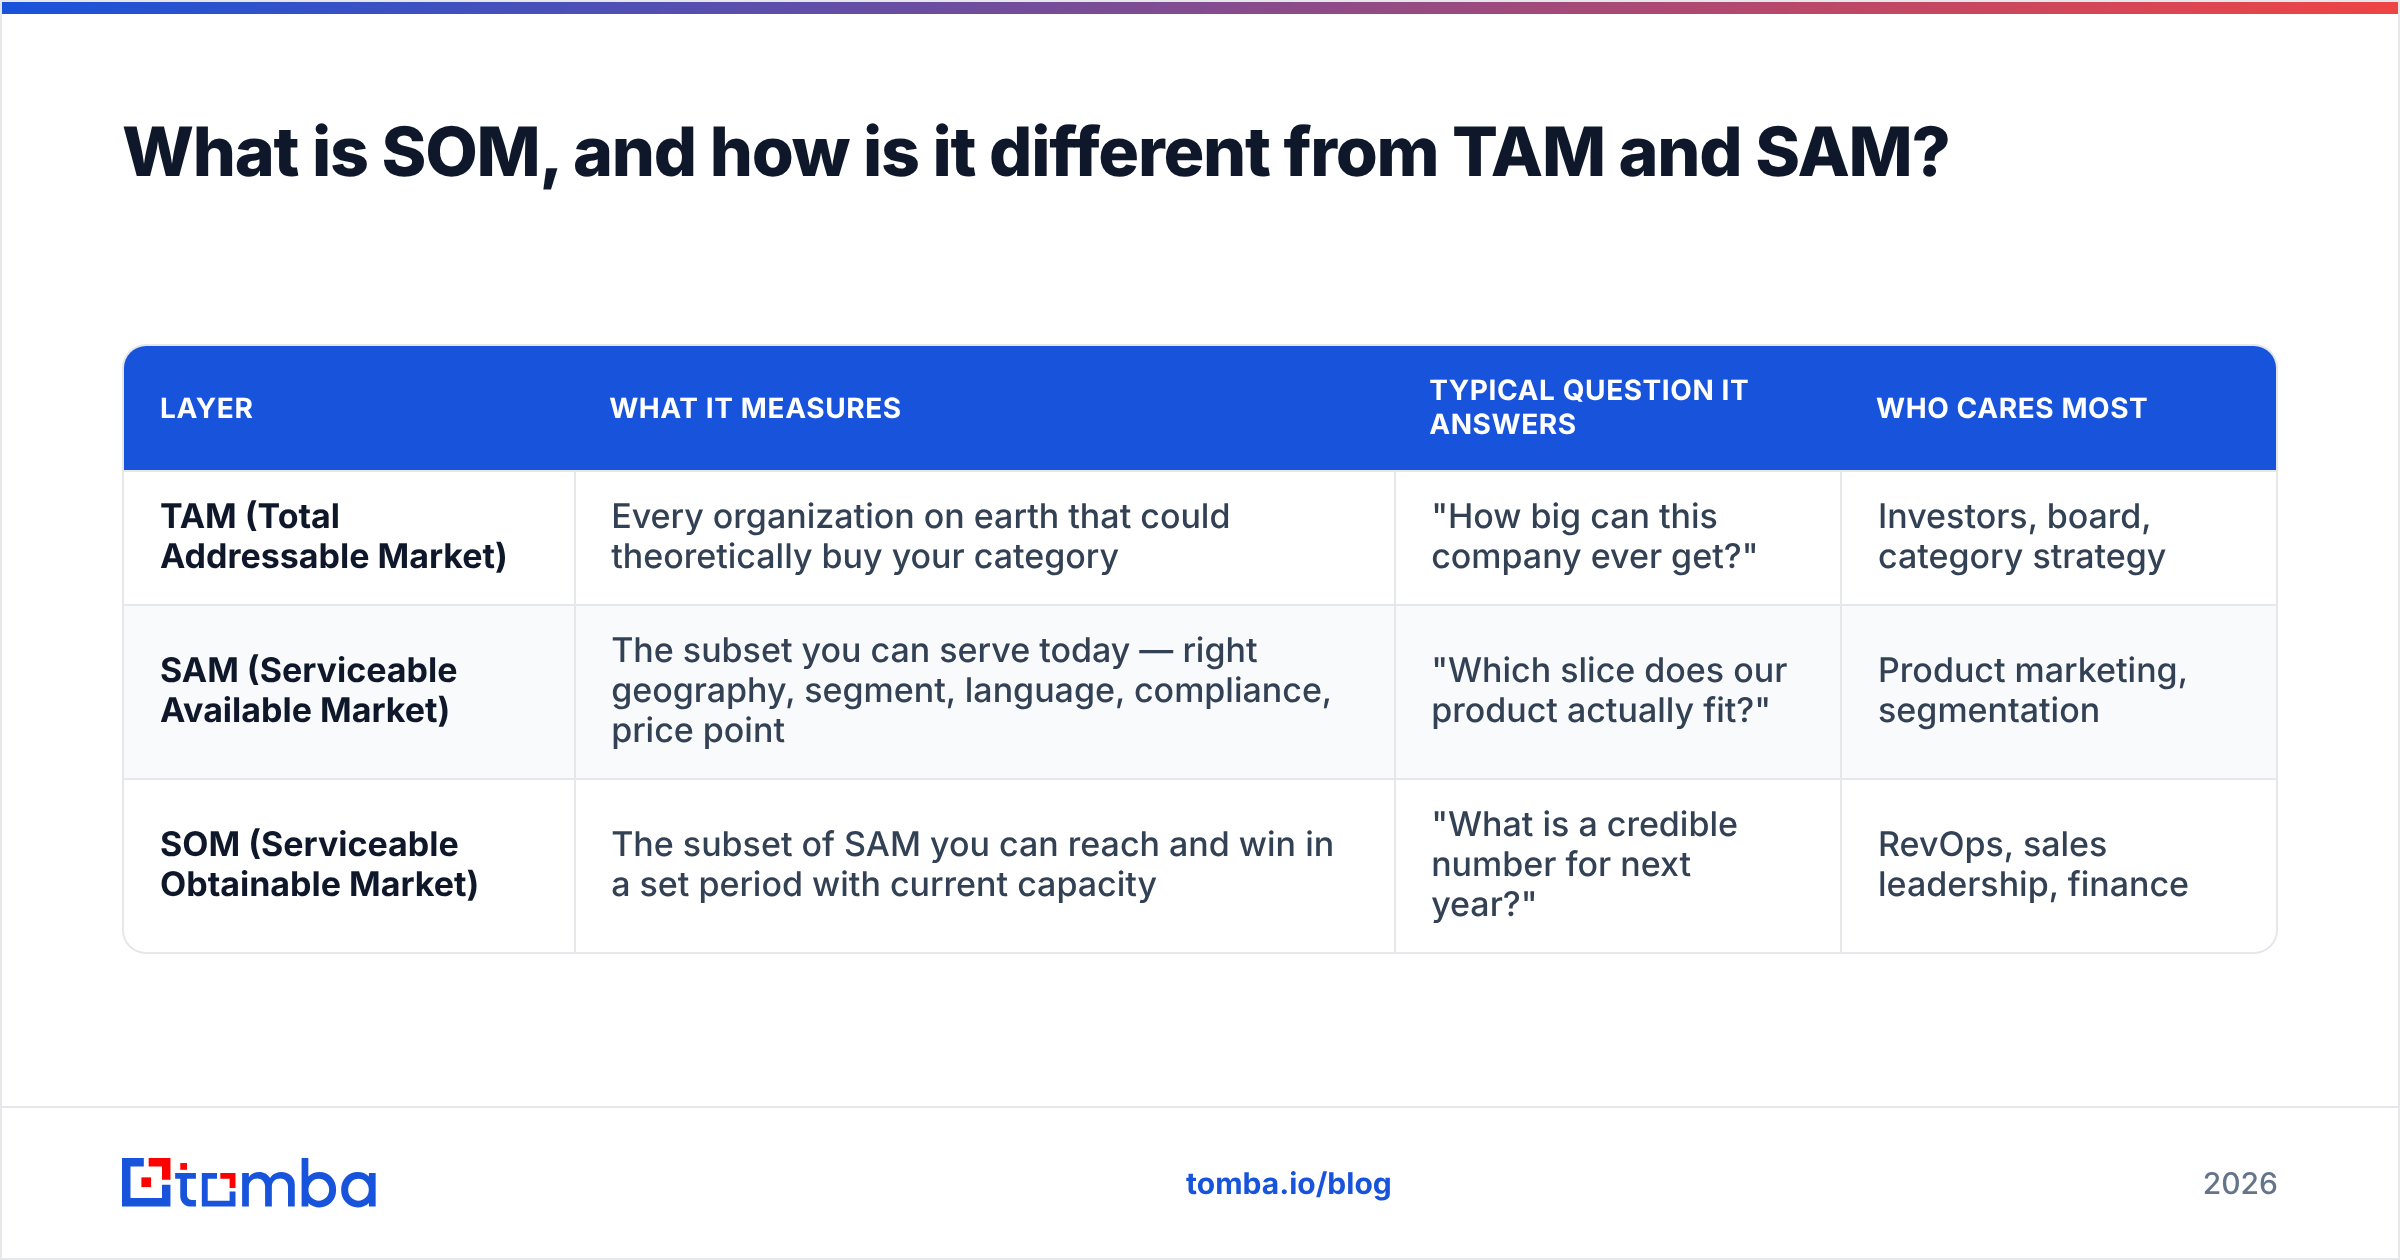
| Layer | What it measures | Typical question it answers | Who cares most |
|---|---|---|---|
| TAM (Total Addressable Market) | Every organization on earth that could theoretically buy your category | "How big can this company ever get?" | Investors, board, category strategy |
| SAM (Serviceable Available Market) | The subset you can serve today — right geography, segment, language, compliance, price point | "Which slice does our product actually fit?" | Product marketing, segmentation |
| SOM (Serviceable Obtainable Market) | The subset of SAM you can reach and win in a set period with current capacity | "What is a credible number for next year?" | RevOps, sales leadership, finance |
The nesting is strict: SOM ⊆ SAM ⊆ TAM. If your SOM is 40% of your SAM, one of the two is wrong. For the formal definitions and their history in market-sizing literature, Wikipedia's TAM entry is a decent neutral primer.
The distinction that matters operationally: TAM and SAM are market facts. SOM is a statement about you. Change your headcount, your data coverage, or your win rate, and SOM moves. The market did not move.

What formula should you use to calculate SOM?#
There are three formulas in circulation. Only one of them is worth putting in a plan.
1. The percentage-of-SAM method (top-down)
SOM = SAM × assumed market share %Fast, universally used, and almost always wrong. The share percentage is unsourced. Boards have learned to discount it on sight.
2. The competitor-share method
SOM = (competitor revenue in your segment) × (share you expect to displace)Better, because at least one input is externally sourced. Useful when you sell into a mature category with public revenue data. Useless in an emerging one.
3. The bottom-up capacity method (recommended)
SOM = Reachable Accounts × Coverage Rate × Reply Rate × Meeting Rate × Win Rate × ACVEvery term is either countable or already sitting in your CRM. Nothing is assumed. This is the method the rest of this post uses.
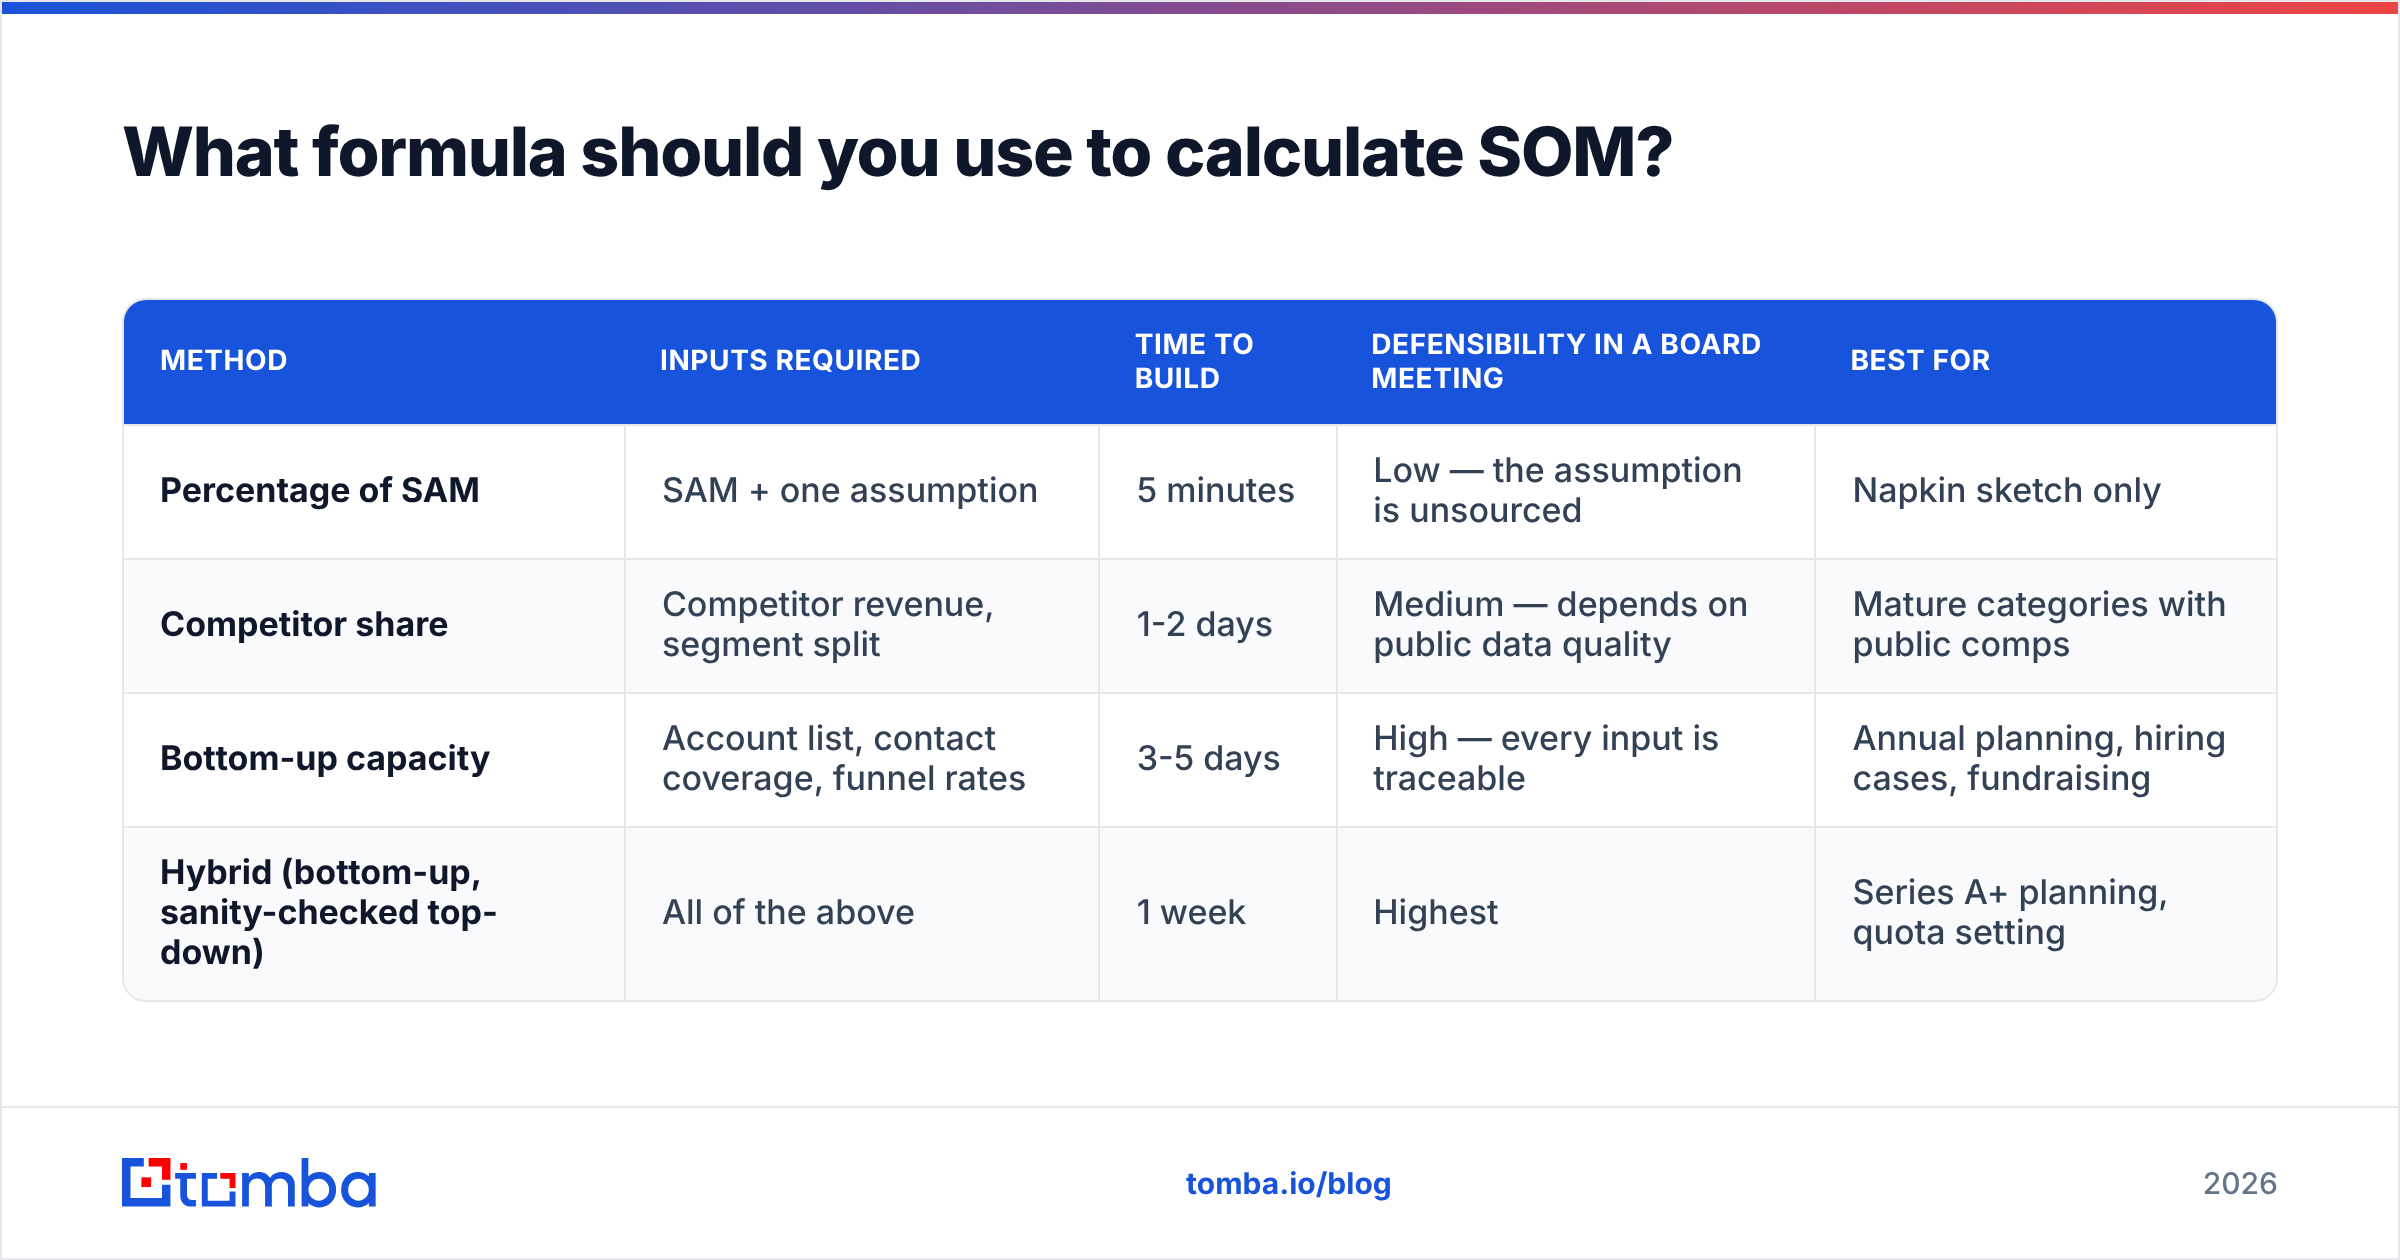
| Method | Inputs required | Time to build | Defensibility in a board meeting | Best for |
|---|---|---|---|---|
| Percentage of SAM | SAM + one assumption | 5 minutes | Low — the assumption is unsourced | Napkin sketch only |
| Competitor share | Competitor revenue, segment split | 1-2 days | Medium — depends on public data quality | Mature categories with public comps |
| Bottom-up capacity | Account list, contact coverage, funnel rates | 3-5 days | High — every input is traceable | Annual planning, hiring cases, fundraising |
| Hybrid (bottom-up, sanity-checked top-down) | All of the above | 1 week | Highest | Series A+ planning, quota setting |
How do you calculate SOM in five steps?#
- Count your SAM in accounts, not dollars. Dollars hide errors; account counts expose them. Filter your total universe by the firmographics your product actually serves — geography, employee band, industry, tech stack, compliance regime. The output is a single integer: "24,000 companies." If you cannot produce that integer, you do not have a SAM, you have a slogan.
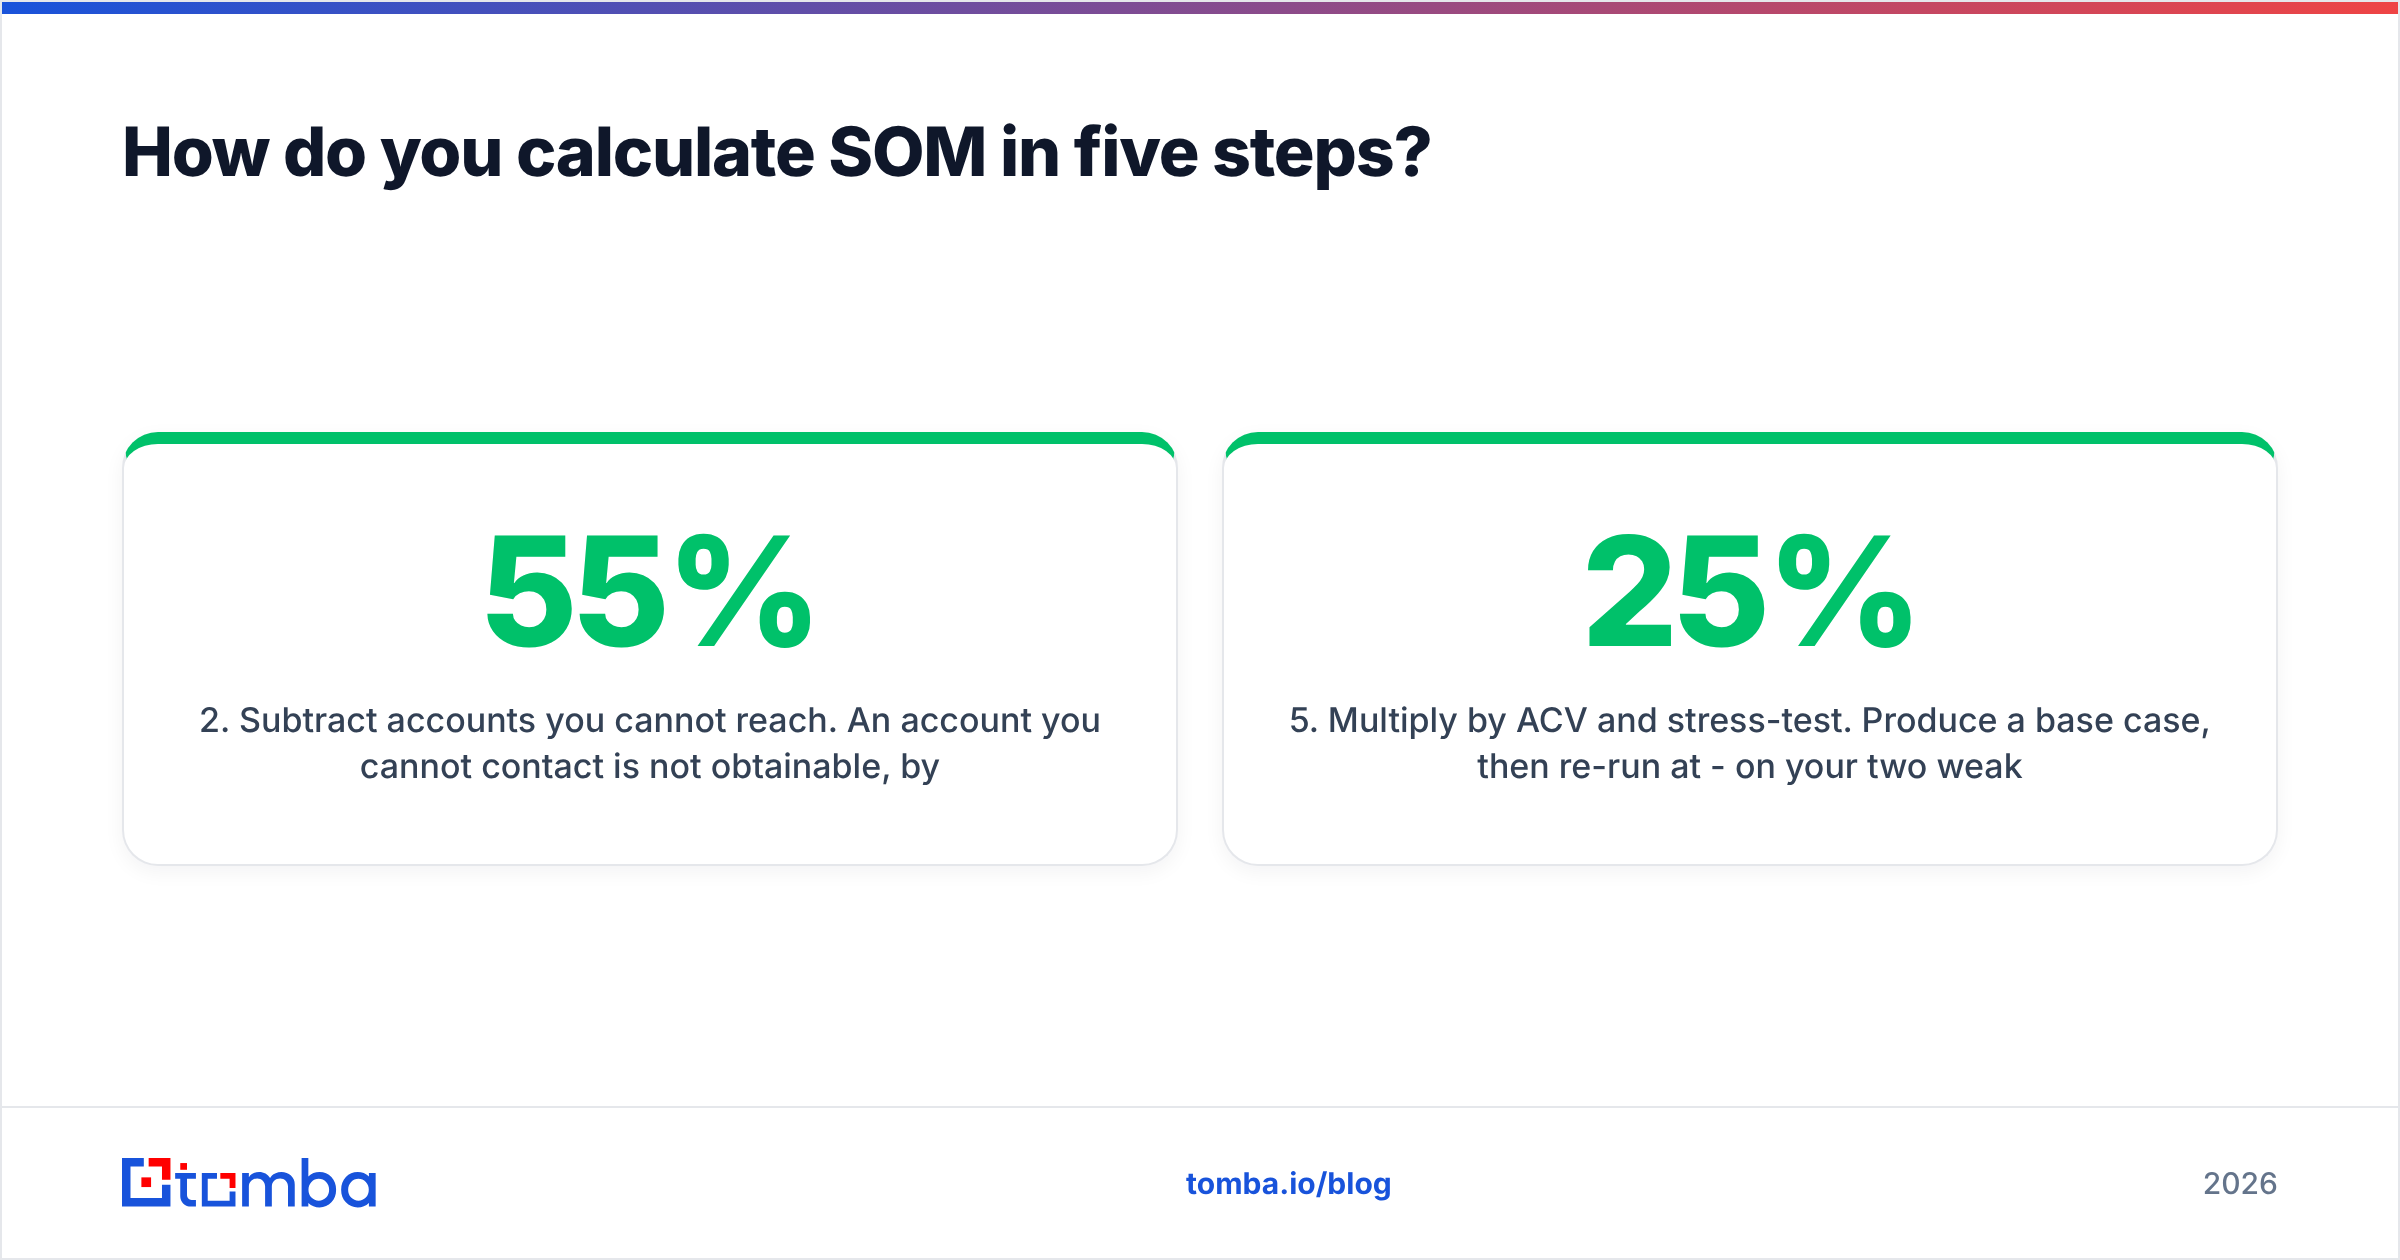
- Subtract accounts you cannot reach. An account you cannot contact is not obtainable, by definition. Run your account list against a contact-data source and measure what percentage returns at least one verified decision-maker email or phone number. That is your coverage rate, and for most mid-market B2B lists it lands between 55% and 75%.
- Cap by outreach capacity. Multiply reps × accounts worked per rep per quarter × 4. If capacity exceeds reachable accounts, use reachable accounts. If reachable accounts exceed capacity, use capacity. SOM is bounded by the smaller of the two — this is the step everyone skips.
- Apply your real funnel rates. Pull the last four quarters from your CRM: reply rate, reply-to-meeting rate, meeting-to-close rate. Use your numbers, not the benchmark from a blog post. If you have no history, use conservative published benchmarks and label them as placeholders.
- Multiply by ACV and stress-test. Produce a base case, then re-run at -25% on your two weakest inputs. If the pessimistic case still funds the plan, the number is safe to present.
What does a worked SOM calculation look like?#
Take a workflow-automation product at $12,000 ACV selling to operations leaders at North American SaaS companies with 50-1,000 employees.
Step 1 — SAM in accounts. Firmographic filtering returns 24,000 qualifying companies. At $12,000 ACV, that is a $288M SAM.
Step 2 — Reachability. Running those 24,000 domains through a contact-data enrichment pass returns at least one verified operations-title email at 62% of them.
24,000 × 0.62 = 14,880 reachable accountsStep 3 — Capacity. Eight reps working 500 accounts per quarter gives 16,000 account-touches per year. Capacity (16,000) exceeds reachable accounts (14,880), so reachable accounts is the binding constraint. Use 14,880.
Step 4 — Funnel rates from the CRM. Reply rate 8%, reply-to-meeting 35%, meeting-to-close 22%.
14,880 × 0.08 = 1,190 replies
1,190  × 0.35 = 417 meetings
417    × 0.22 = 92 closed-won
Step 5 — Revenue.
92 × $12,000 = $1,104,000 SOMThat is 0.38% of SAM. It looks small next to a $288M headline, and that is exactly why it is credible. A CFO can trace every multiplication. A "3% of SAM = $8.6M" claim invites one question — why three? — that nobody in the room can answer.
The stress test: drop coverage to 50% and win rate to 18%, and you get 24,000 × 0.50 × 0.08 × 0.35 × 0.18 × $12,000 = $725,760. If the plan survives at $726K, you can commit to $1.1M without flinching.
What data do you actually need, and where do you get it?#
Three inputs, three different sources, three different failure modes.
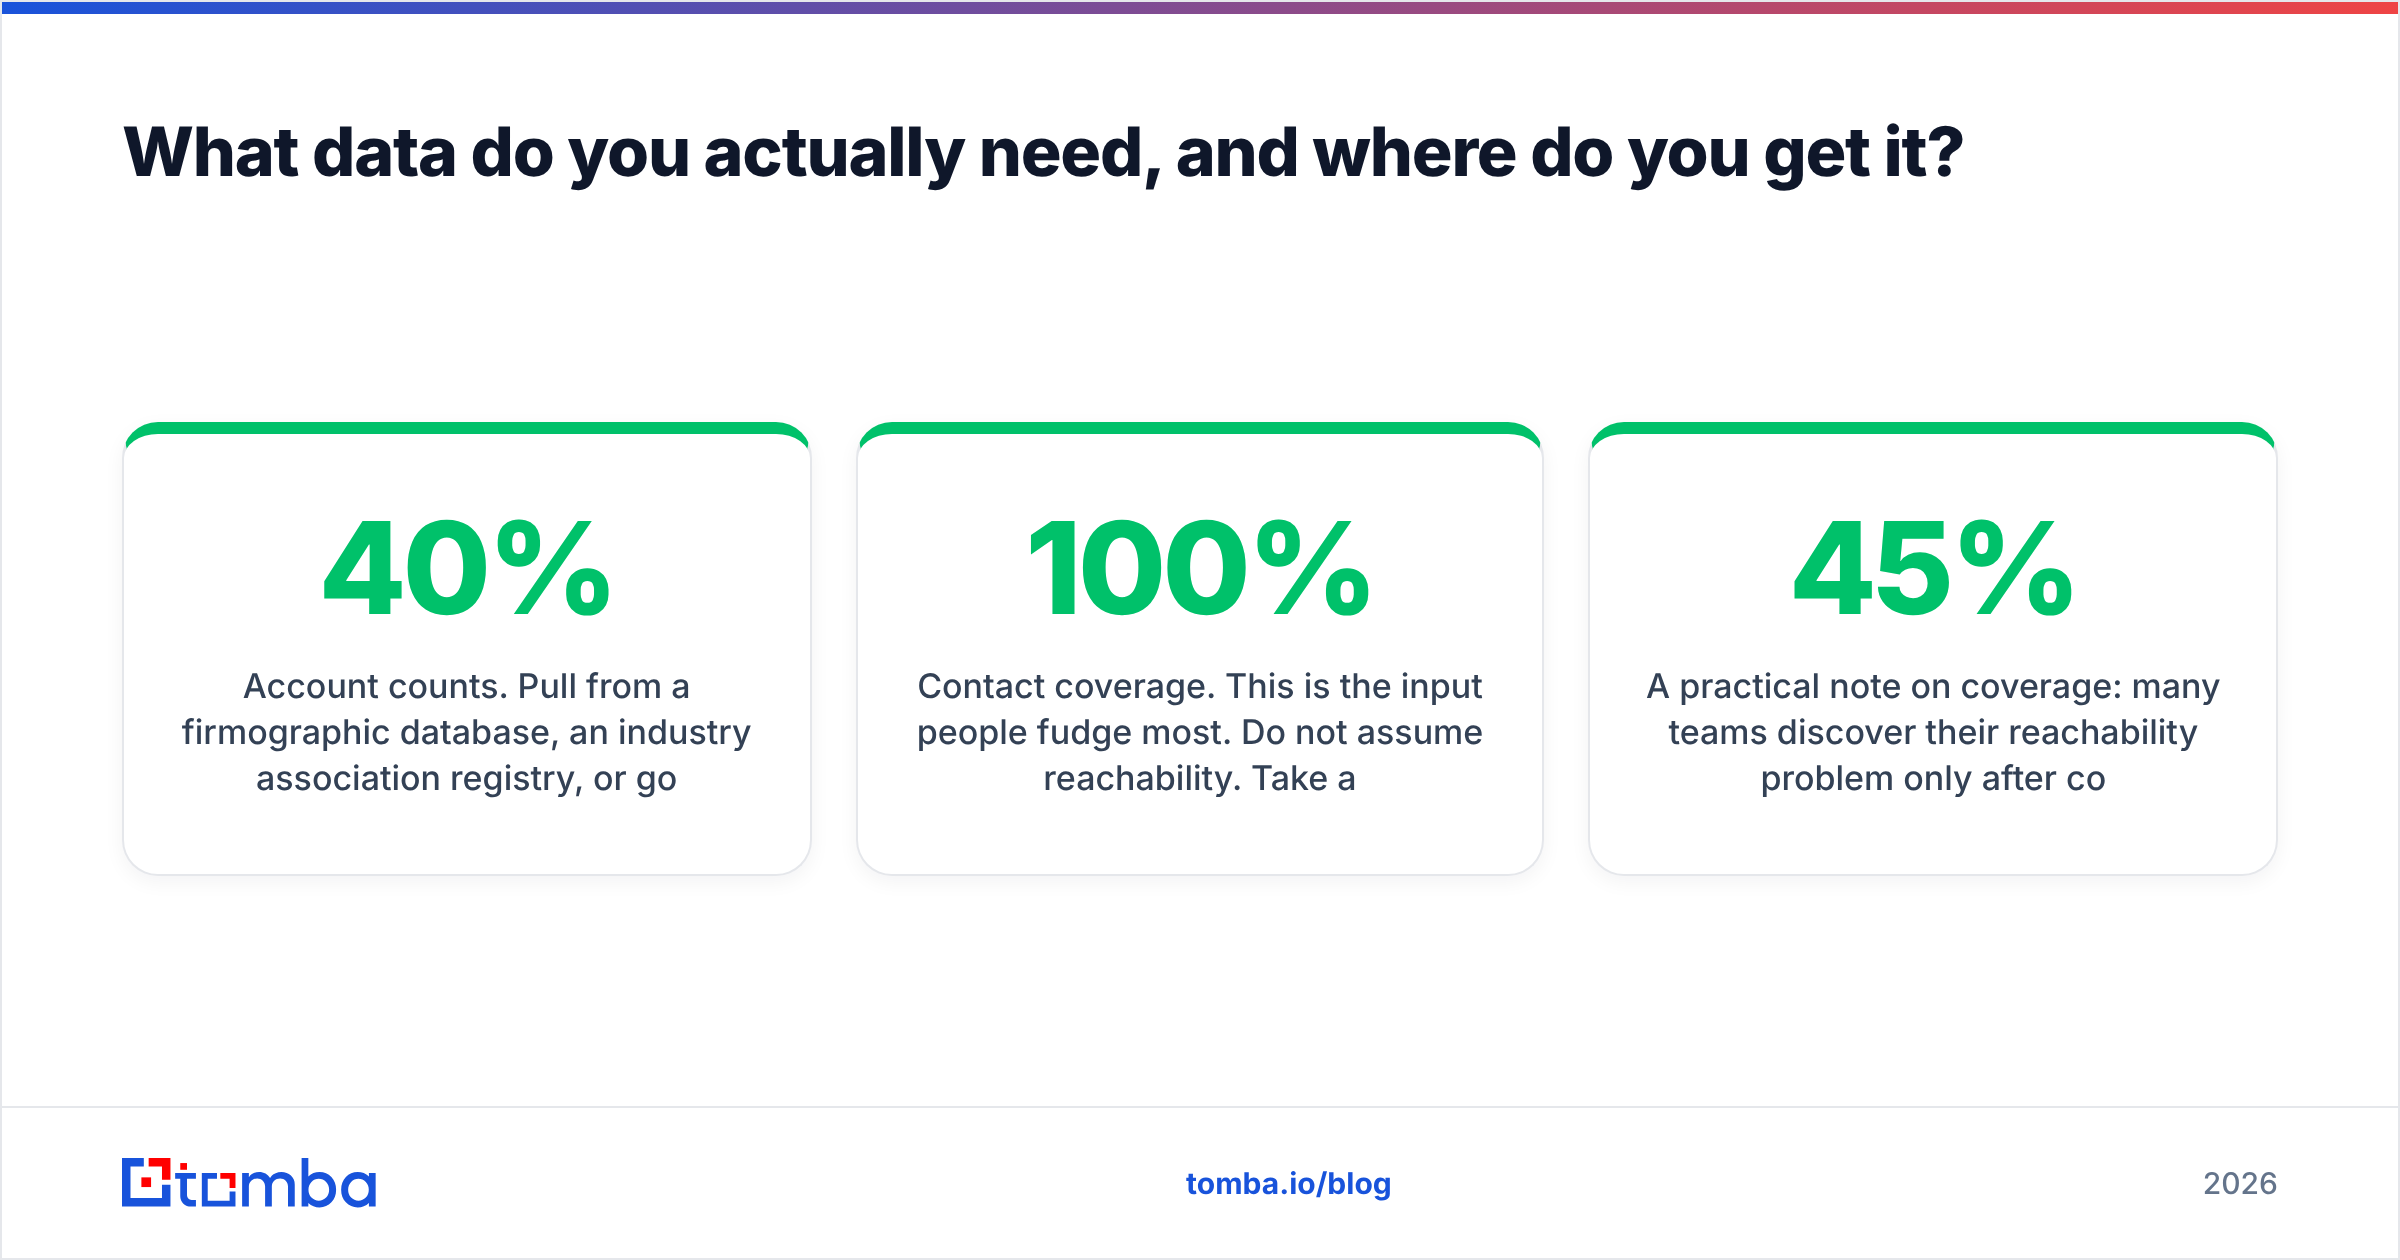
Account counts. Pull from a firmographic database, an industry association registry, or government business registries. Cross-check at least two sources — the variance between providers on "US SaaS companies, 50-1,000 employees" can be 40%. If two sources disagree wildly, your filter definition is ambiguous, not the data.
Contact coverage. This is the input people fudge most. Do not assume 100% reachability. Take a random sample of 200-500 domains from your SAM list, run them through a domain search to see how many return verified role-relevant contacts, and extrapolate. A sample that size gives you a coverage rate accurate to within a few points — far better than the round number someone typed into the model. Layering data enrichment on top tells you not just whether a contact exists but whether the title matches your buyer persona, which is the number that actually belongs in the formula.
Funnel conversion rates. Your CRM, last four quarters, filtered to the segment you are sizing. Segment matters: enterprise win rates and SMB win rates are different businesses wearing the same logo. If you are pre-revenue, borrow published benchmarks from G2 category reports or the sales research libraries at Gartner and flag them explicitly as assumptions in the model.

A practical note on coverage: many teams discover their reachability problem only after committing to a number. Running the B2B database check before the plan is signed turns a Q3 surprise into a Q1 line item. If coverage comes back at 45% instead of the 70% you assumed, you either buy better data or you cut the number — both are better than discovering it in month seven.
What mistakes make SOM numbers wrong?#
- Sizing in dollars instead of accounts. Dollar-first sizing lets you hide a fuzzy denominator. Account-first sizing forces you to name the companies.
- Ignoring reachability. An account with no findable contact is not in your obtainable market this year. Treating SAM as if it were fully contactable inflates SOM by 30-45% in most B2B lists.
- Using aspirational win rates. If your trailing-twelve-month win rate is 18%, model 18%. The 30% you hit in one lucky quarter is not a rate, it is a memory.
- No time bound. SOM without a window is meaningless. "Our SOM is $4M" — over what, a year or a decade? Always write "12-month SOM."
- Forgetting capacity constraints. A 4-rep team cannot work 40,000 accounts, no matter how large the reachable set is. Whichever ceiling is lower, that is the ceiling.
- Double-counting expansion. New-logo SOM and expansion revenue are separate models. Mixing them makes both unreadable.
The reachability mistake deserves extra weight because it compounds. Every downstream multiplication happens on an inflated base, so a 20-point coverage error becomes a 20% revenue miss before a single email is sent. This is also why bounce-heavy lists distort planning as much as they distort email deliverability — a contact you cannot land in an inbox never had a conversion rate to begin with.
How often should you recalculate SOM?#
Quarterly for the inputs, annually for the full model.
The account count moves slowly — companies are founded and acquired, but the universe of "North American mid-market SaaS" does not shift much in ninety days. What moves fast is everything about you: headcount, coverage, conversion rates, price. Rebuild the multipliers each quarter, keep the denominator stable, and you get a rolling forecast instead of an annual fiction.
Three triggers force an off-cycle rebuild:
- You change segments. New geography, new employee band, new vertical — the account count is now a different integer.
- Your ACV moves more than 20%. Pricing changes ripple through every layer at once.
- Your data source changes. Switching enrichment vendors changes your coverage rate, which changes reachable accounts, which changes SOM. Re-benchmark before you trust the new number.
One more discipline: version the model. Keep last year's SOM file next to this year's and diff the assumptions. The gap between "what we assumed" and "what happened" is the single most useful revenue operations artifact your team will produce, and it makes next year's estimate materially better. Sales planning frameworks from HubSpot make the same point from the quota-setting side: the value is in the retrospective, not the forecast.
What is the fastest way to get a defensible SOM?#
Start with reachability, because it is the input you can measure this week and the one most likely to be wrong.
Take 300 domains at random from your target segment, run a domain-level contact search, and record what fraction return a verified email at the right title. That single percentage — measured, not assumed — is the difference between a SOM your board accepts and one they quietly halve. Everything else in the formula either already exists in your CRM or is a headcount number you can read off an org chart.
Ready to measure your coverage rate instead of guessing it? Run your target account list through the Tomba Email Finder and see how many decision-makers you can actually reach before you commit to a number. The free tier gives you 25 searches a month — enough to sample a segment — and paid plans start at $49/mo on the Starter tier, with Growth at $99/mo for larger lists. Check the Tomba pricing page to match a plan to the size of your SAM, then build your SOM on data you can actually defend.
Related guides#
Ready to find emails that actually work?
Join 150,000+ professionals who stopped guessing and started sending. Free credits on signup — no credit card required.
Get the Tomba newsletter
Practical outbound tactics and product updates — once every two weeks.
About the author