How to Calculate TAM in 2026: Formulas, Data, and Examples
Most TAM slides are a top-down guess dressed up in a big number. Here are the three formulas that actually hold up, the data you need for each, and a worked bottom-up example you can rebuild this week.
TL;DR
- TAM (total addressable market) is the annual revenue you would earn if every company that could buy your product did buy it, at your price, forever. It is a ceiling, not a forecast.
- There are three ways to calculate it: top-down (analyst report × slice), bottom-up (accounts × ACV), and value theory (value created × capture rate). Bottom-up is the only one investors and boards consistently trust.
- The bottom-up formula is simple:
TAM = number of qualifying accounts × average annual contract value. The hard part is counting the accounts honestly. - Your account count is a data problem, not a math problem. Firmographic filters, a real company list, and verified contacts turn a guess into a number you can defend.
- Recalculate TAM every two quarters, and always show SAM and SOM next to it. A TAM with no SOM underneath it reads as fiction.
What is TAM, and how is it different from SAM and SOM?#
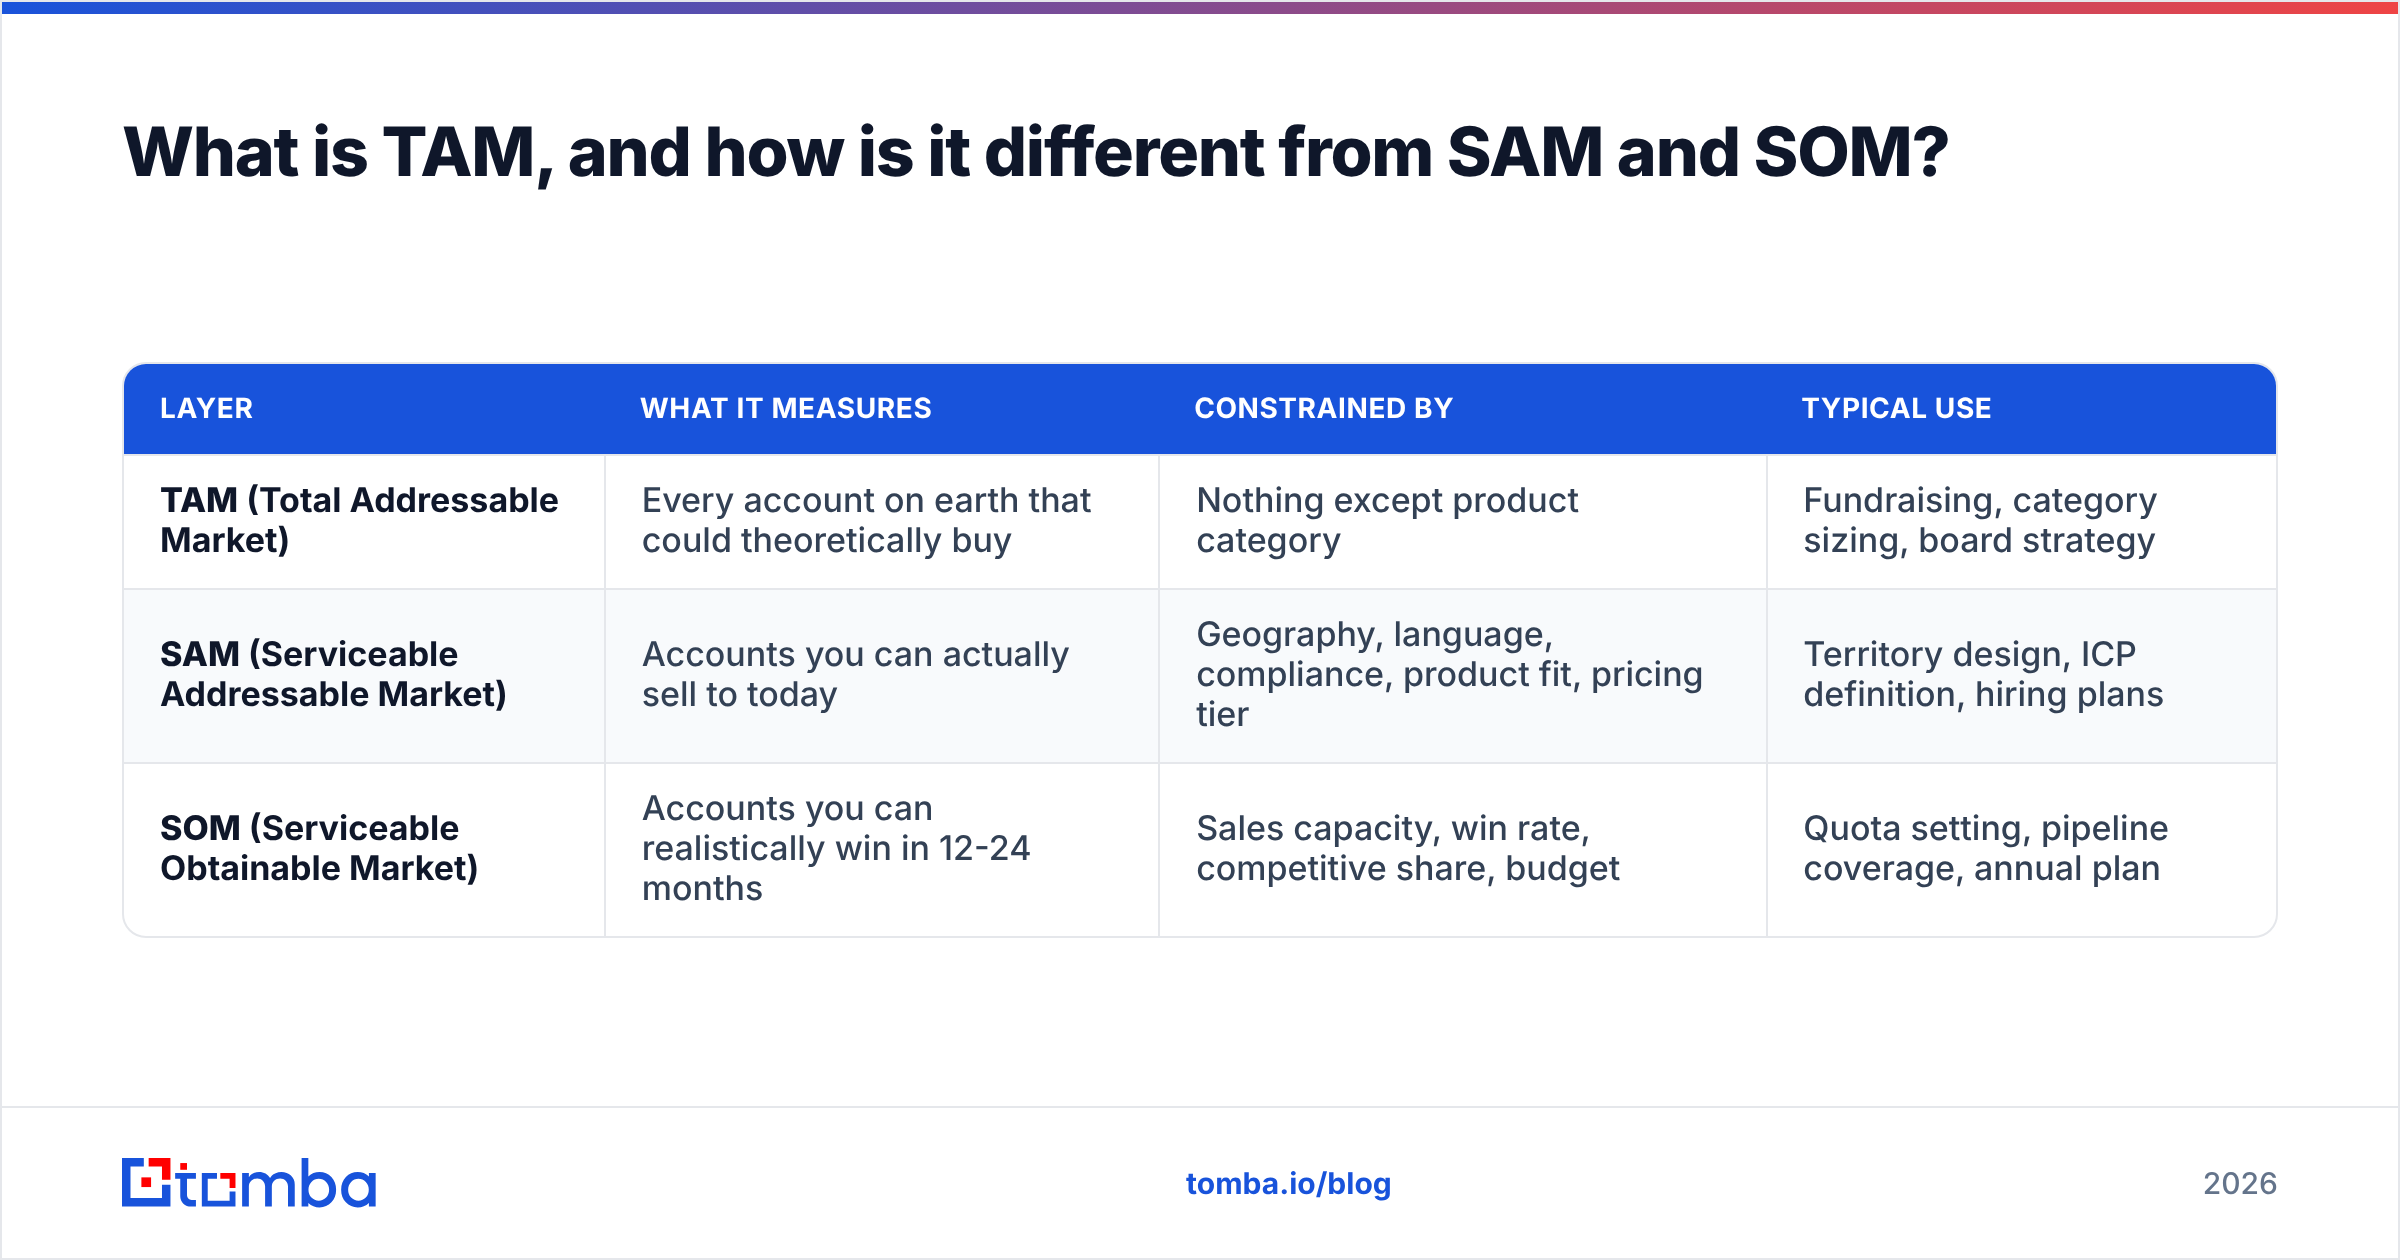
TAM is the total annual revenue opportunity for your category if you had 100% market share and no competitors, no geographic limits, and no sales capacity constraints. It answers one question: is this market big enough to build a company in?
The confusion starts when people use TAM when they mean SAM or SOM. The three are nested, and each one narrows the last:
| Layer | What it measures | Constrained by | Typical use |
|---|---|---|---|
| TAM (Total Addressable Market) | Every account on earth that could theoretically buy | Nothing except product category | Fundraising, category sizing, board strategy |
| SAM (Serviceable Addressable Market) | Accounts you can actually sell to today | Geography, language, compliance, product fit, pricing tier | Territory design, ICP definition, hiring plans |
| SOM (Serviceable Obtainable Market) | Accounts you can realistically win in 12-24 months | Sales capacity, win rate, competitive share, budget | Quota setting, pipeline coverage, annual plan |
A useful rule of thumb: SAM is often 10-40% of TAM, and SOM is often 1-10% of SAM in the first few years. If your SOM is 60% of your SAM, you have either mis-sized the market or you are describing a niche, not a category.
The Wikipedia entry on total addressable market is a decent neutral primer if you need to align a team on definitions before you start arguing about numbers.

How do you calculate TAM? The three methods#
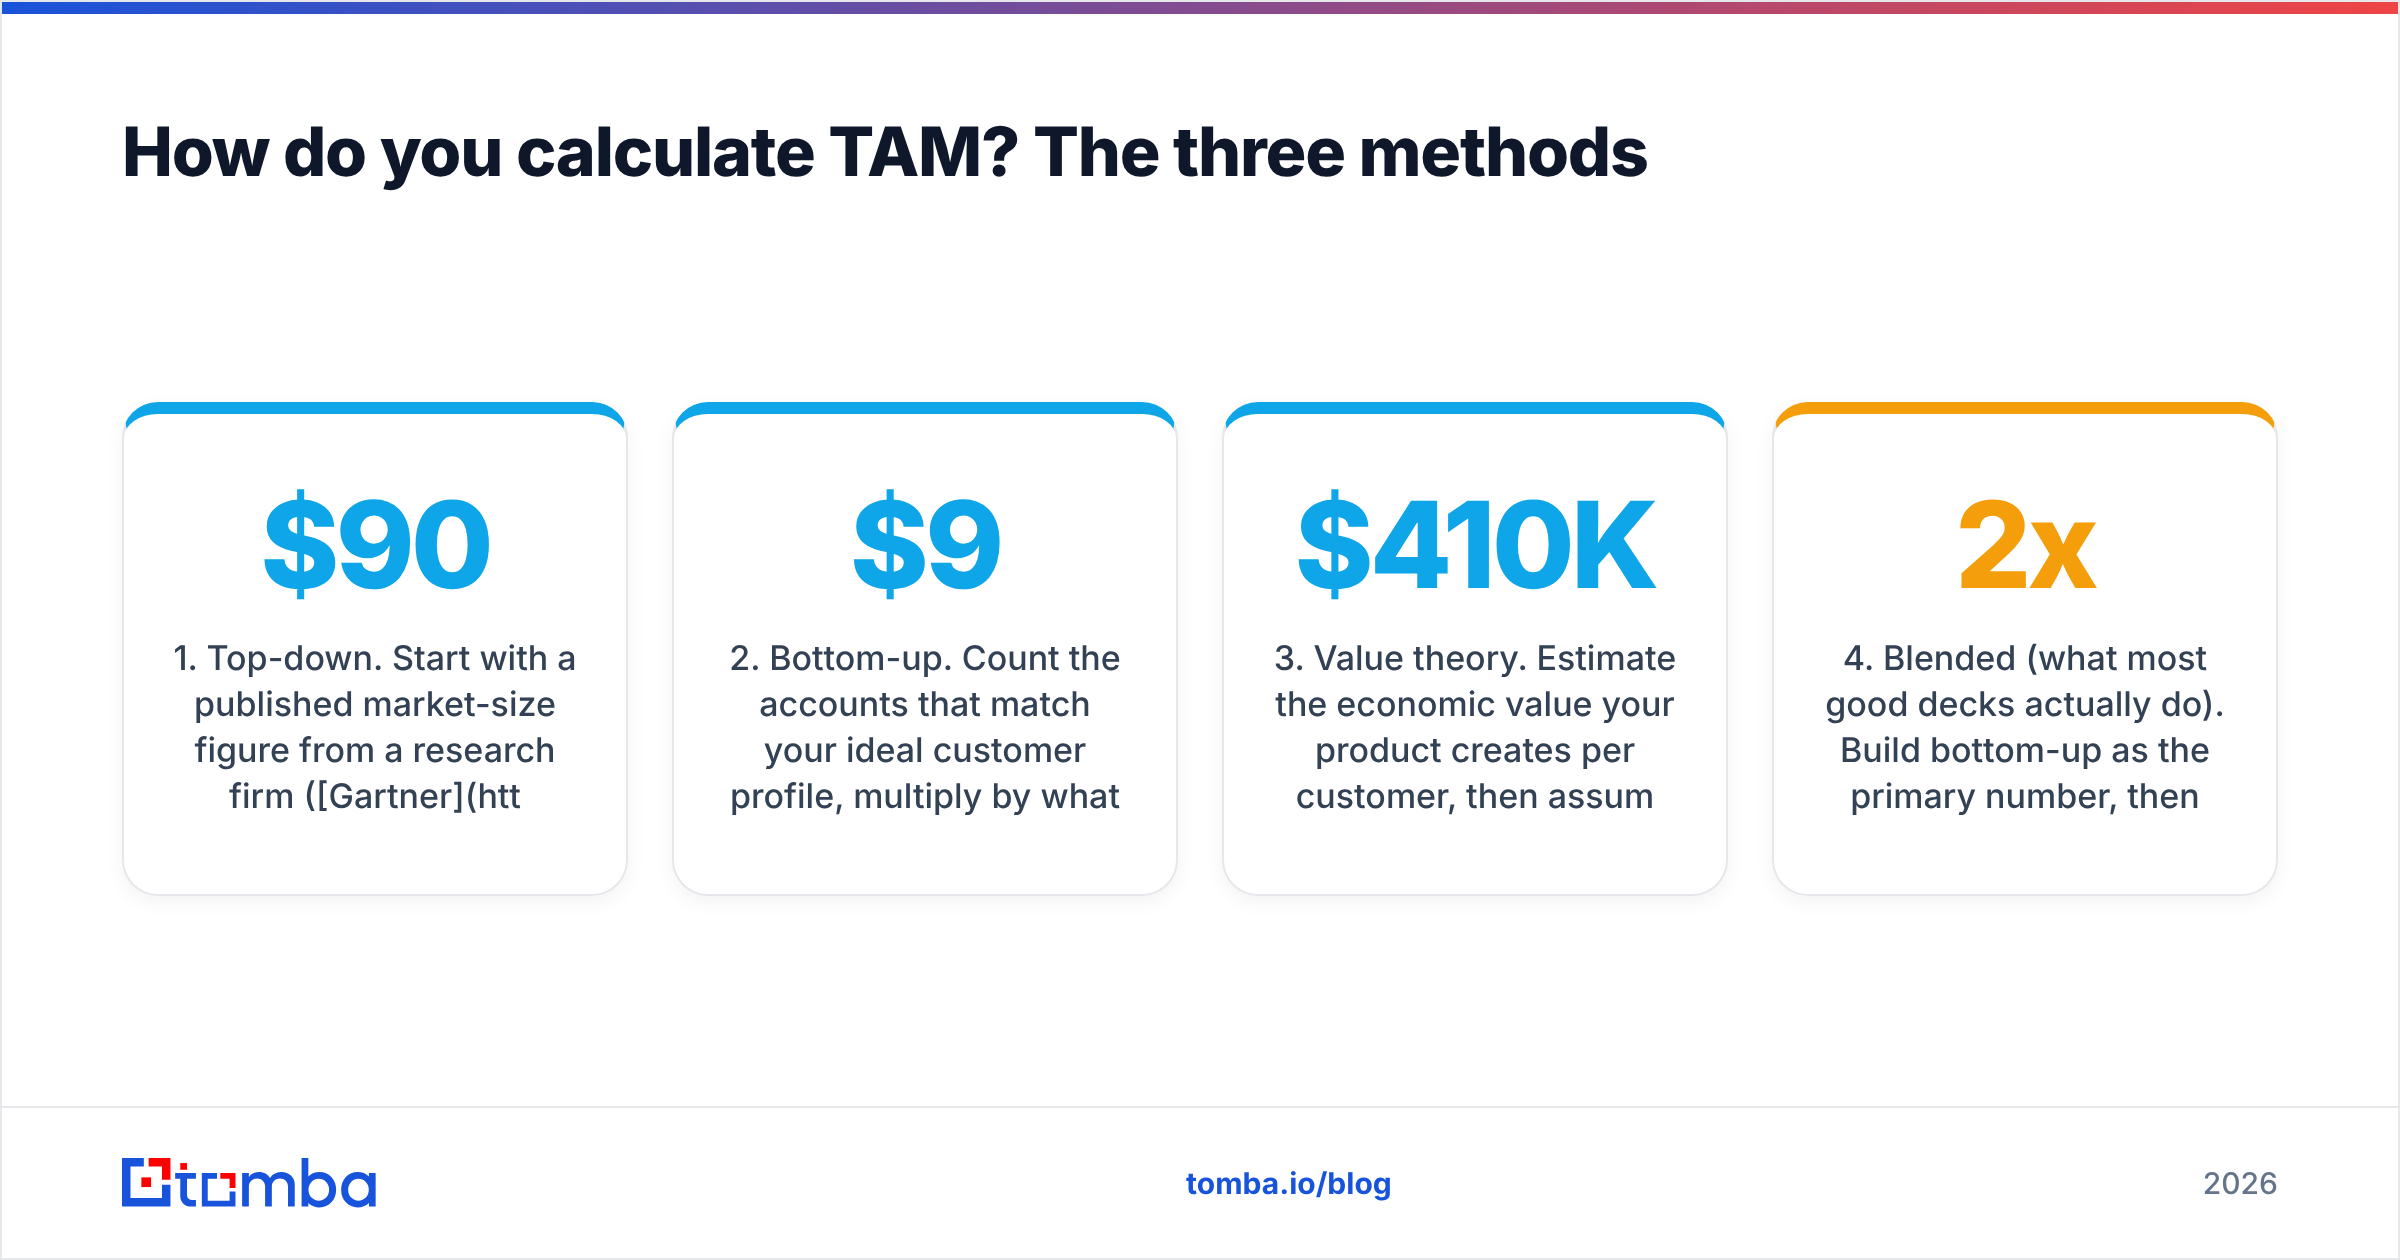
There are exactly three credible approaches. Pick based on what data you can actually get, not on which produces the biggest number.
Top-down. Start with a published market-size figure from a research firm (Gartner, Forrester, IDC, or an industry association), then multiply by the share of that market your product addresses. Example: "The global CRM market is $90B; we serve the SMB segment, roughly 18%, so our TAM is $16.2B." Fast, cheap, and almost always wrong at the edges because the analyst's category boundaries are not yours.
Bottom-up. Count the accounts that match your ideal customer profile, multiply by what each one would pay you per year. Example: "There are 61,000 US companies with 50-500 employees running Shopify Plus; our average contract is $9,400/yr; TAM = $573M." Slower, defensible, and the version a due-diligence team will ask for anyway.
Value theory. Estimate the economic value your product creates per customer, then assume you capture a fraction of it. Example: "We save a 200-person sales org $410K/yr in wasted rep time; at a 20% capture rate that's $82K per account; multiply by 34,000 qualifying orgs." Useful for genuinely new categories where no analyst report exists, and useful nowhere else.
Blended (what most good decks actually do). Build bottom-up as the primary number, then sanity-check it against a top-down figure. If they land within roughly 2x of each other, you are probably in the right neighborhood. If bottom-up says $400M and top-down says $30B, one of your assumptions is broken and you need to find out which before someone else does.
What is the actual TAM formula?#
The bottom-up formula is the one to memorize:
TAM = (Number of accounts matching your ICP) × (Average annual contract value)
Everything else is a variation:
- Seat-based products:
TAM = Total qualifying seats × Annual price per seat - Usage-based products:
TAM = Qualifying accounts × Average annual usage volume × Price per unit - Transactional / take-rate products:
TAM = Total addressable transaction volume × Your take rate - Multi-product companies: calculate TAM per product line and sum them, never one blended number. Blended TAMs hide the fact that one line is 90% of the opportunity.
The formula is trivial. Both inputs are where the work lives, and the account count is where nearly every bad TAM goes wrong.
What data do you need for a bottom-up TAM?#
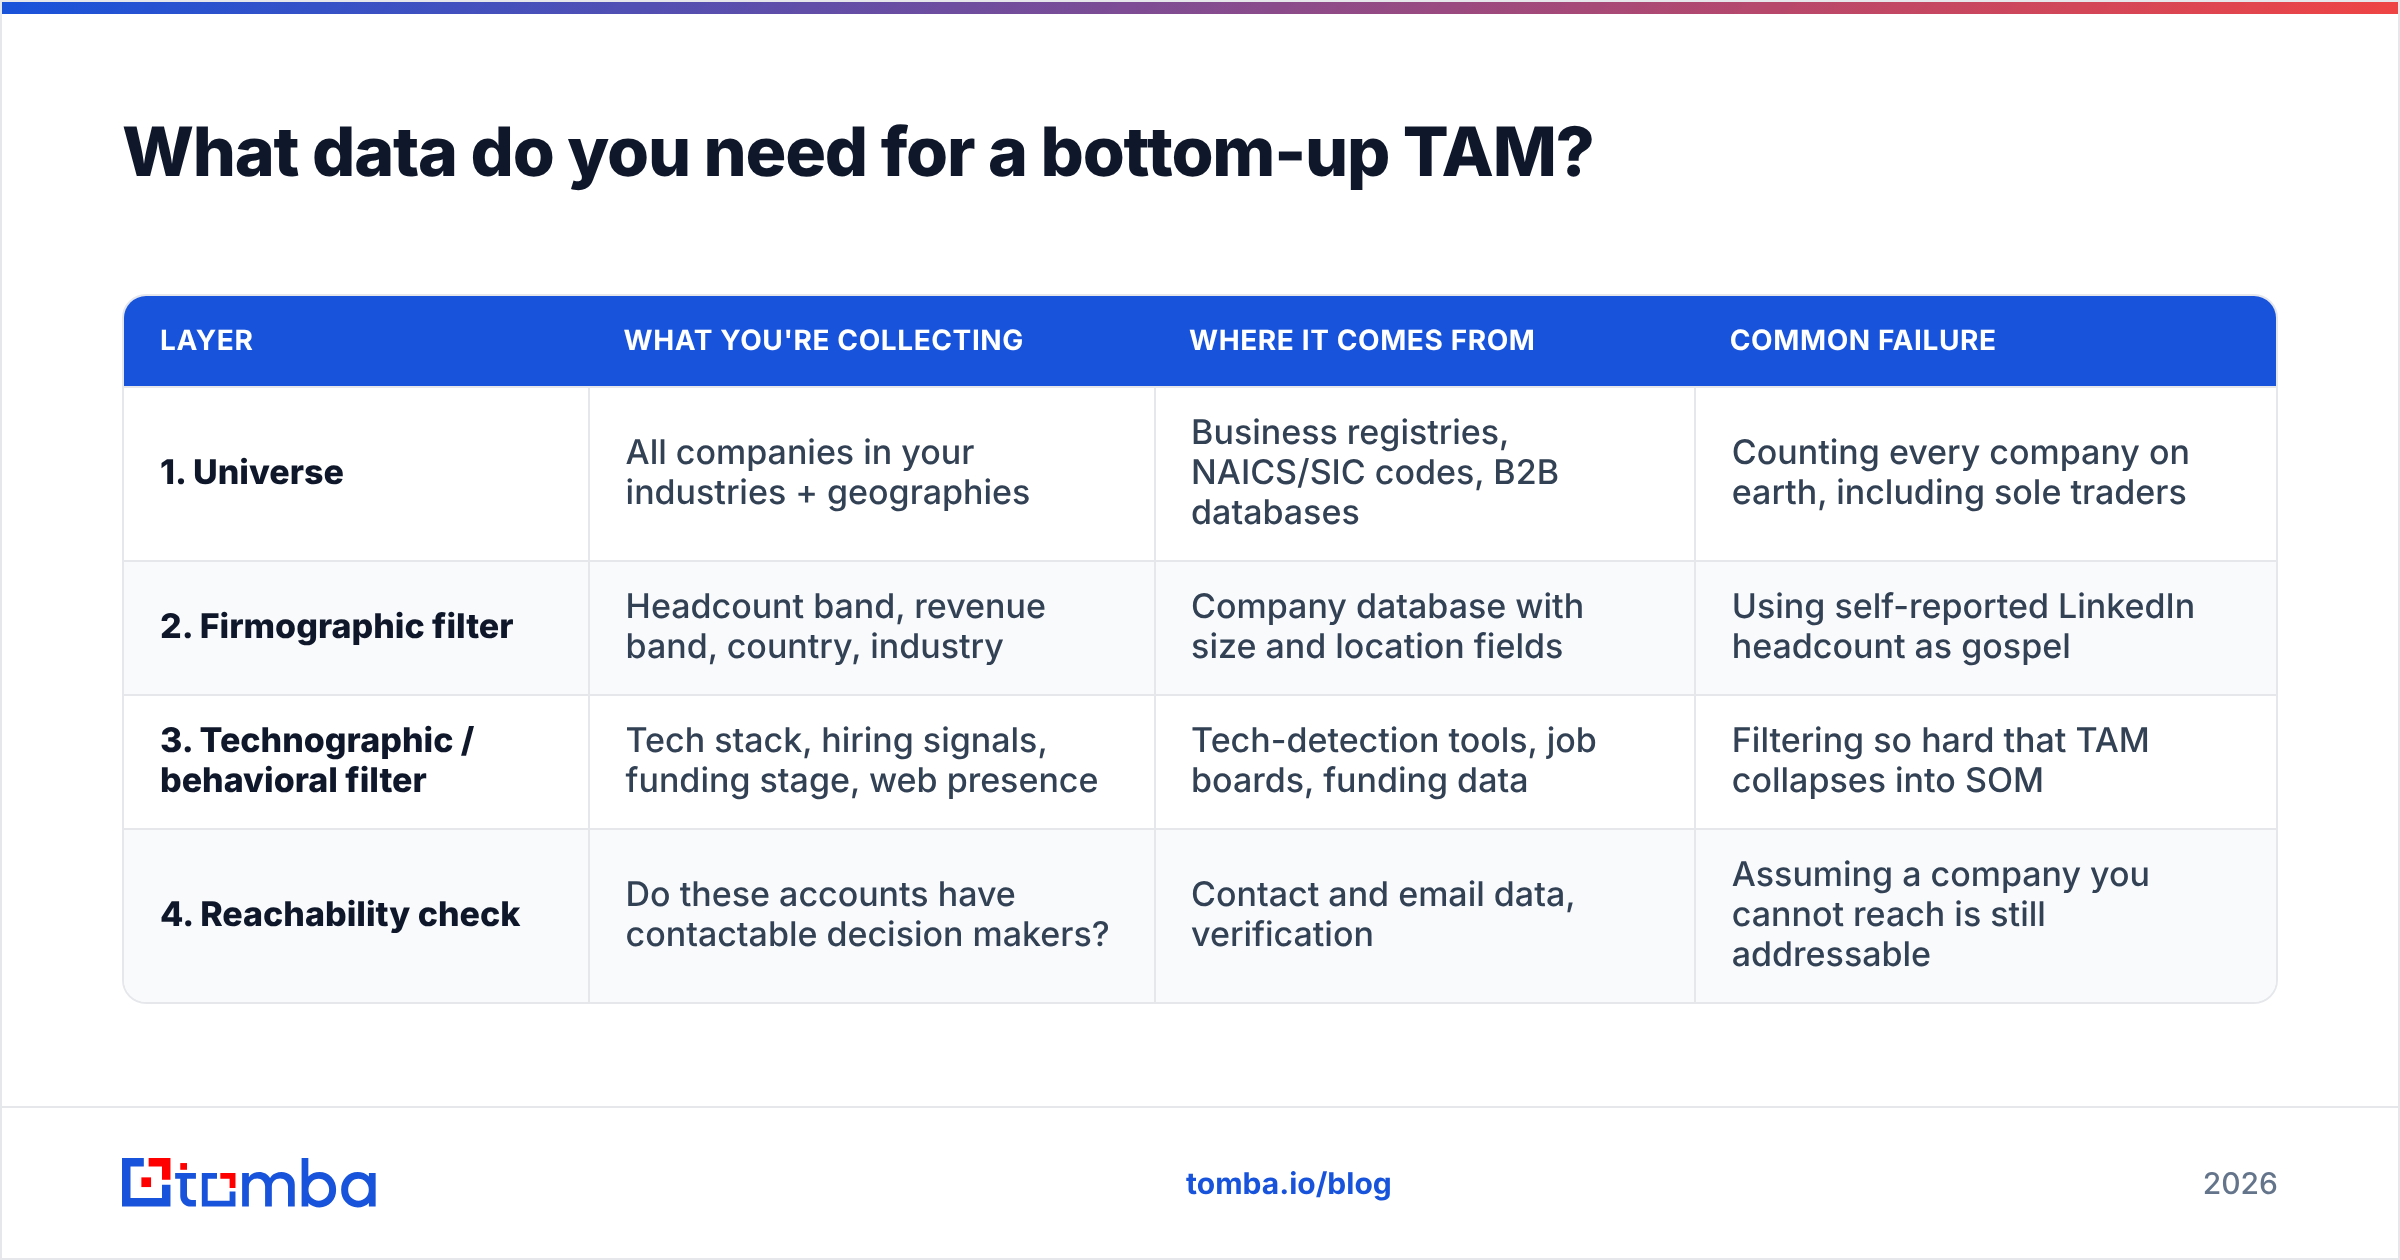
You need four data layers, in this order. Each one shrinks the number, which is the point.
| Layer | What you're collecting | Where it comes from | Common failure |
|---|---|---|---|
| 1. Universe | All companies in your industries + geographies | Business registries, NAICS/SIC codes, B2B databases | Counting every company on earth, including sole traders |
| 2. Firmographic filter | Headcount band, revenue band, country, industry | Company database with size and location fields | Using self-reported LinkedIn headcount as gospel |
| 3. Technographic / behavioral filter | Tech stack, hiring signals, funding stage, web presence | Tech-detection tools, job boards, funding data | Filtering so hard that TAM collapses into SOM |
| 4. Reachability check | Do these accounts have contactable decision makers? | Contact and email data, verification | Assuming a company you cannot reach is still addressable |
Layer 4 is the one teams skip and the one that separates a market model from a spreadsheet fantasy. If 30% of your "addressable" accounts have no findable buyer contact, your practical TAM is smaller than the slide says. Running your account list through a domain search to confirm each company actually has reachable role-based buyers is a five-minute check that saves a quarter of embarrassment.
For the count itself, a filterable B2B database is faster than scraping registries by hand: set your headcount, industry, and country filters, read the result count, and you have layer 2 done. Export in batches through a bulk email finder when you need the contact-level view for layer 4.
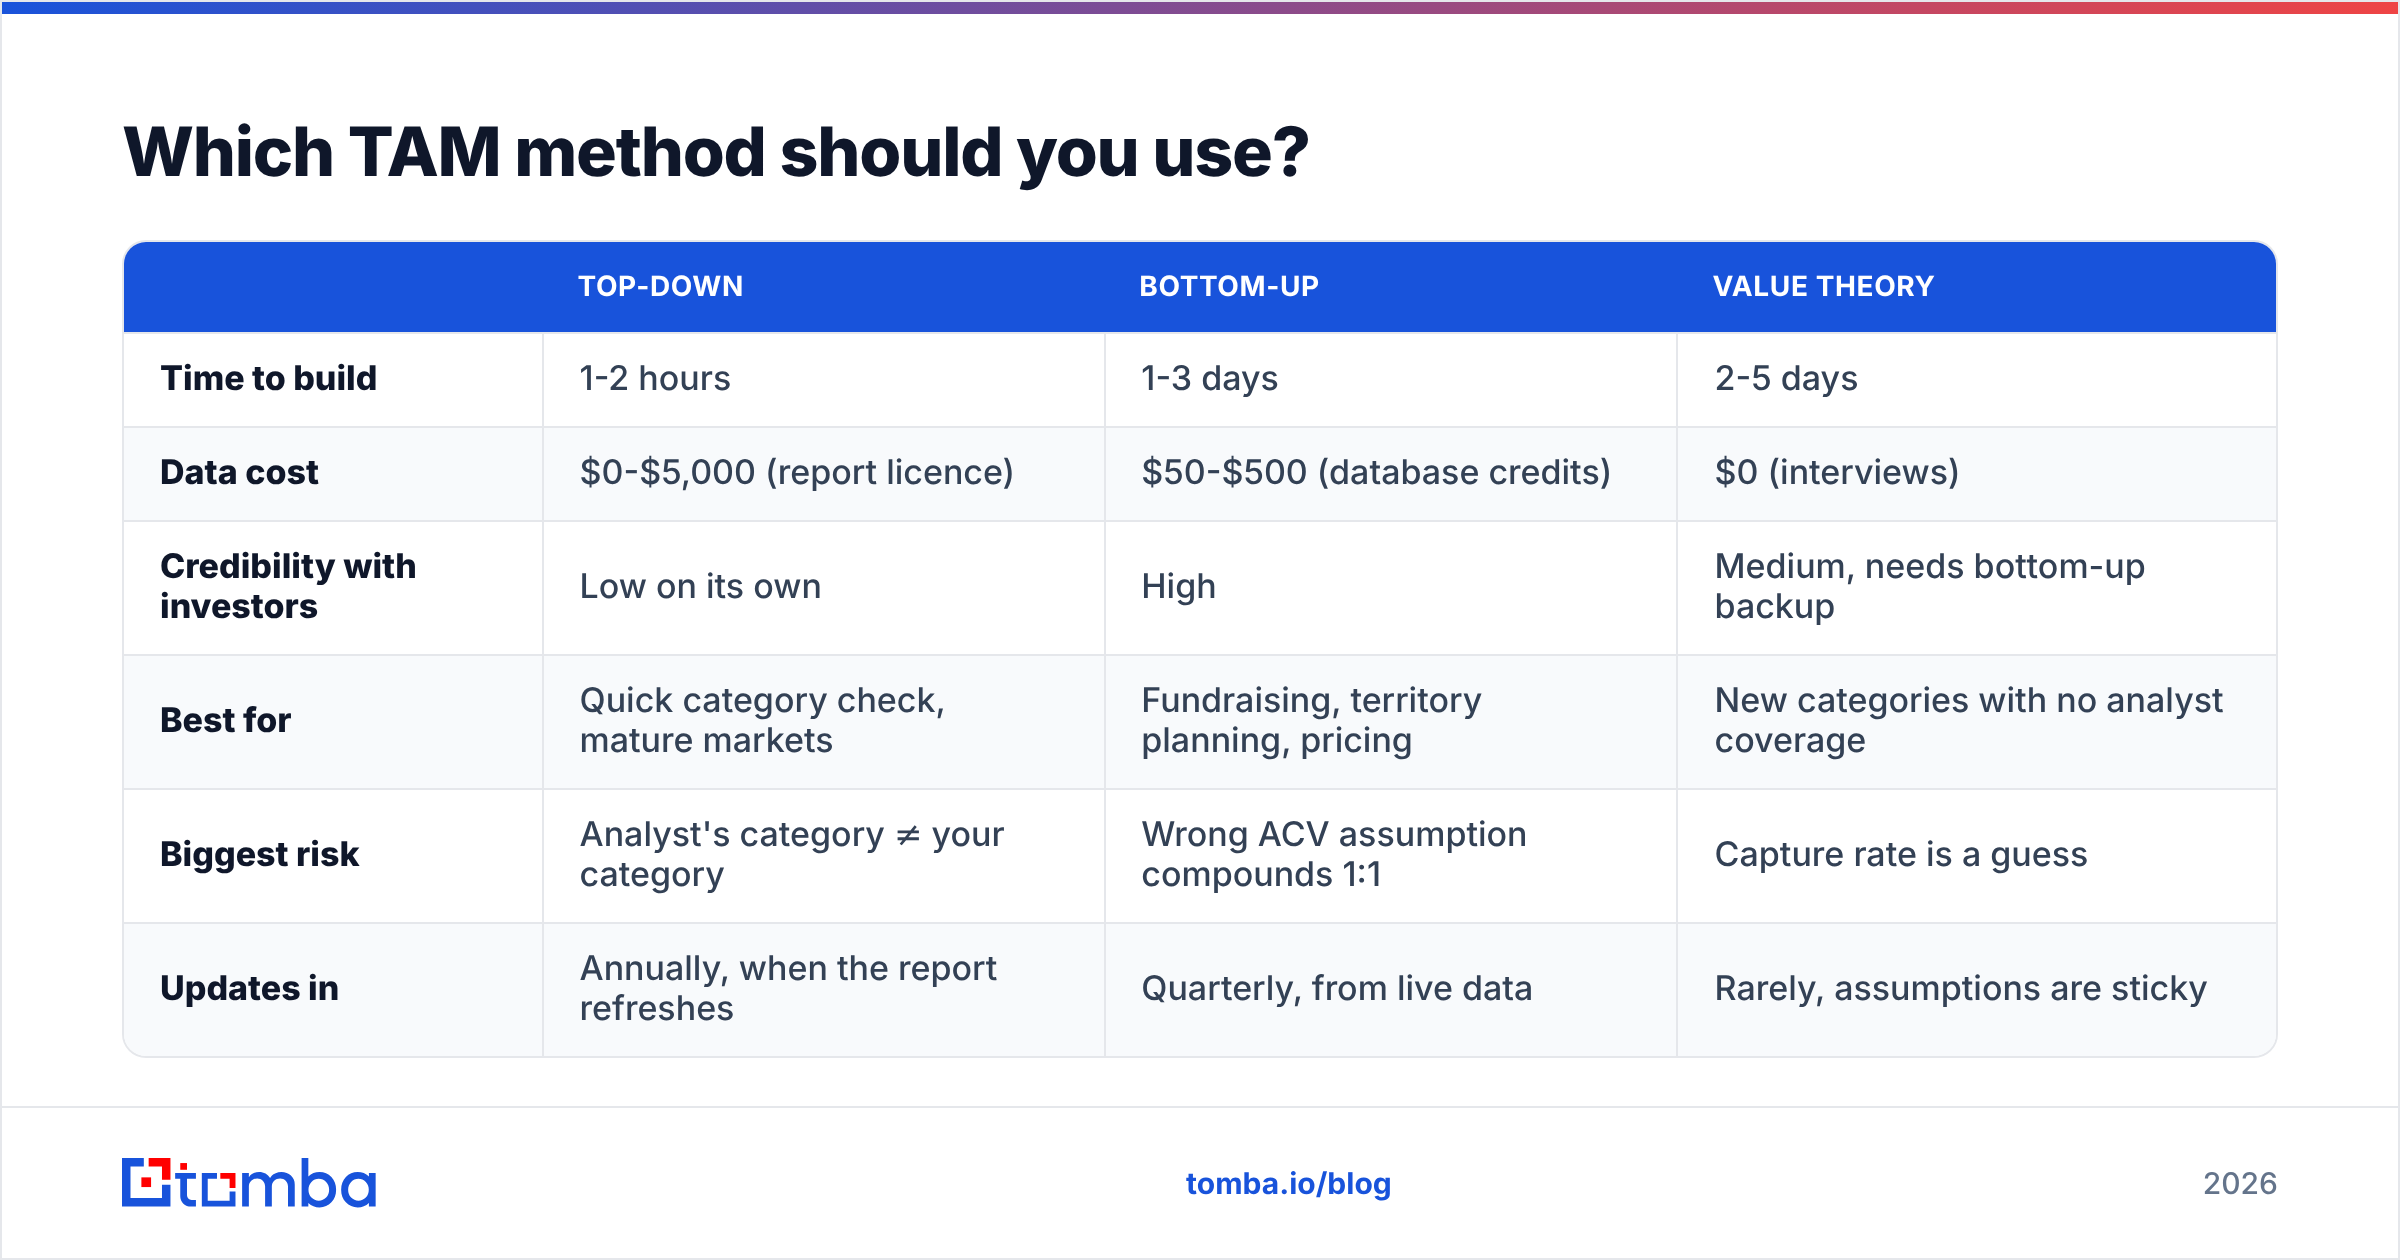
Which TAM method should you use?#
| Top-down | Bottom-up | Value theory | |
|---|---|---|---|
| Time to build | 1-2 hours | 1-3 days | 2-5 days |
| Data cost | $0-$5,000 (report licence) | $50-$500 (database credits) | $0 (interviews) |
| Credibility with investors | Low on its own | High | Medium, needs bottom-up backup |
| Best for | Quick category check, mature markets | Fundraising, territory planning, pricing | New categories with no analyst coverage |
| Biggest risk | Analyst's category ≠ your category | Wrong ACV assumption compounds 1:1 | Capture rate is a guess |
| Updates in | Annually, when the report refreshes | Quarterly, from live data | Rarely, assumptions are sticky |
If you have to pick one and defend it in a room, pick bottom-up. Top-down numbers get challenged in the first two minutes because everyone knows the analyst report is public and the slicing percentage was chosen after the fact.
How do you build a bottom-up TAM in one afternoon?#
Here is the process, compressed. Budget three to four focused hours for a first pass.
Step 1 — Write the ICP as filters, not adjectives. "Mid-market SaaS companies in North America" is an adjective. "Software companies, 50-500 employees, US/Canada, founded after 2010" is a filter set. If you cannot express it as database filters, you cannot count it.
Step 2 — Pull the raw account count. Apply your filters in a company database and record the count. Do this for each segment separately if your pricing differs by segment. Keep the raw number visible; you will need it to show your work.
Step 3 — Apply a qualification haircut. Not every company matching your filters is a real prospect. Some are subsidiaries double-counted, some are dormant, some are competitors. A 10-25% haircut is normal and honest. Document the rate and why.
Step 4 — Set ACV per segment. Use your actual closed-won average, not list price. If you have fewer than 20 closed deals, use list price for the plan tier that segment buys and flag it as an assumption. Never blend enterprise and SMB into one ACV.
Step 5 — Multiply and stack the segments. TAM = Σ (segment accounts × segment ACV). Three or four segment rows is usually enough granularity.
Step 6 — Derive SAM and SOM in the same sheet. Cut TAM to the geographies and product tiers you support today (SAM), then apply your realistic win rate and sales capacity (SOM). A model that only shows TAM is a model nobody will act on.
Step 7 — Verify reachability on a sample. Take 200 random accounts from your list, run them through an email verifier, and record what percentage yields at least one valid buyer contact. Apply that percentage as your reachability factor to the SAM. This is the single step that turns a market model into an outbound plan.

What does a worked TAM calculation look like?#
Say you sell a compliance automation tool to healthcare providers in the US, priced by facility.
- Universe: US healthcare provider organizations, NAICS 621 and 622 → 780,000 entities.
- Firmographic filter: 20+ employees, multi-site operations → 46,000 organizations.
- Technographic filter: running one of four EHR systems you integrate with → 21,500 organizations.
- Qualification haircut: 15% for duplicates, dormant entities, and government facilities you cannot serve → 18,275 organizations.
- ACV by segment: 3,100 large (avg $46,000), 6,900 mid (avg $18,000), 8,275 small (avg $7,200).
TAM = (3,100 × $46,000) + (6,900 × $18,000) + (8,275 × $7,200)
TAM = $142.6M + $124.2M + $59.6M = $326.4M
Then narrow it:
- SAM: you only support two of the four EHR integrations today and only sell in 38 states → roughly 52% of TAM → $169.7M.
- SOM (24 months): 14 AEs, 22 deals/AE/year, 24% win rate against your named-account list → $11.4M.
That third number is what the sales plan is built on, and it is the number a good board member will ask for first. A $326M TAM with a credible $11.4M SOM is far more fundable than a $40B TAM with no path underneath it. HubSpot's market research guidance is a reasonable companion read if you want a structured way to gather the qualitative inputs behind segment ACV.
What mistakes make a TAM number useless?#
- Using the analyst report's category, not yours. If the $90B "CRM market" includes services revenue and you sell software only, you have inflated the number by whatever services represents. Read the methodology footnote.
- Assuming everyone buys at list price. Discounting is real. Use closed-won ACV.
- Ignoring current spend. TAM should reflect what accounts can spend on the problem, not what they spend on you. If most of your prospects already pay a competitor, that spend is still in your TAM but not in your SOM.
- Counting companies you cannot reach. An account with no findable decision maker is not addressable in practice. Layer in a reachability factor.
- Never updating it. Headcount bands shift, categories consolidate, and your ACV changes every time you reprice. A TAM built two years ago is a historical artifact.
- Presenting one number with no range. Show a conservative, base, and aggressive case with the assumption that moves between them. It signals you understand the model rather than the output.
How often should you recalculate TAM?#
Twice a year for the full model, quarterly for the ACV input. The account count is relatively stable over six months; your average contract value is not, especially if you ship a new pricing tier or move upmarket. Keep the model in a live sheet with your filters documented at the top, so any RevOps analyst can rerun it in an hour instead of rebuilding from scratch.
Tie it to your revenue operations cadence: TAM refresh in the same cycle as territory and quota planning, so the market model and the sales plan never drift apart.
Turn your TAM model into a real account list#
A TAM number is only useful if you can hand the underlying list to a sales team. That means going from "18,275 qualifying organizations" to named accounts with verified decision-maker contacts.
That's the gap Tomba Email Finder closes. Filter to your ICP, pull the companies, then find and verify buyer emails at each one so your market model and your outbound list are the same file. The free tier gives you 25 searches a month to test the workflow on a sample of your account list; paid plans start at $49/mo on Starter and $99/mo on Growth when you're ready to build the full segment export. Full Tomba pricing is on the site, and the API is available if you want the account count refreshing itself inside your model.
Build the TAM bottom-up, verify that you can actually reach the accounts, and the number stops being a slide and starts being a plan.
Related guides#
Ready to find emails that actually work?
Join 150,000+ professionals who stopped guessing and started sending. Free credits on signup — no credit card required.
Get the Tomba newsletter
Practical outbound tactics and product updates — once every two weeks.
About the author