How to Calculate TAM SAM SOM: A 2026 Step-by-Step Guide
TAM, SAM, and SOM decide whether your GTM plan is credible or fiction. Here is the exact math, the data sources, and the mistakes that get decks rejected by investors.
TL;DR
- TAM is total annual revenue if every possible buyer bought from someone. SAM is the slice you can actually sell to given your product, geography, and pricing. SOM is what you can realistically win in 12–36 months.
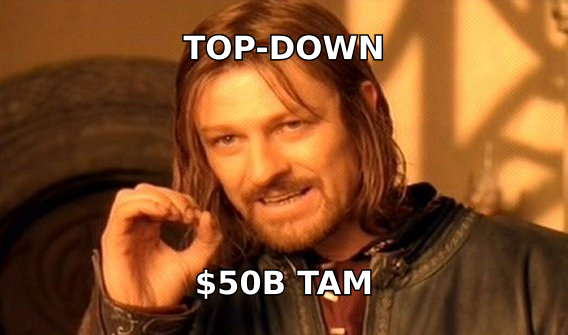
- Bottom-up beats top-down. Multiply real account counts by real contract values. A $50B TAM copied from an analyst PDF gets rejected in the first investor meeting.
- The bottleneck is almost never the formula. It is account counts you can defend — how many companies match your ICP, verified, not estimated.
- Use a three-layer method: count qualified accounts, multiply by ACV, then apply a defensible capture rate based on your pipeline math, not optimism.
- Recalculate quarterly. Your SAM changes every time you ship a feature, enter a country, or move upmarket.
What do TAM, SAM, and SOM actually mean?#
Think of it like a pizza. TAM is the whole pizza — every dollar spent in your category worldwide. SAM is the slice you can reach with the arm you have — the segment your product actually serves, in the countries you sell to, at the price you charge. SOM is the bite you can take in the next year or two given your headcount, budget, and win rate.
The technical version:
- TAM (Total Addressable Market) — annual revenue available if you captured 100% of demand for your category, globally, with no competition and no constraints. It sets ambition, not forecast.
- SAM (Serviceable Available Market) — the portion of TAM your current product, pricing, compliance posture, and go-to-market motion can serve. Filters: company size, industry, geography, tech stack, regulatory fit.
- SOM (Serviceable Obtainable Market) — the share of SAM you can win in a defined window, given competitors, sales capacity, and your historical conversion rates. This is the number that should tie back to your revenue plan.
- Why the nesting matters — SOM ⊂ SAM ⊂ TAM, always. If your SOM is 40% of your SAM in year one, your SAM is defined too narrowly or your capture assumptions are fantasy.
Most decks get thrown out at step 2. Founders quote a Gartner category number as TAM, then present SAM as "10% of TAM" with no filter logic. That is not a calculation. That is a guess wearing a suit.
How do you calculate TAM SAM SOM step by step?#
Here is the working method. Do bottom-up first, then sanity-check with top-down — never the reverse.
Step 1 — Define the buying unit. Is your customer a company, a department, a seat, or a location? A sales-tool vendor selling per-seat licenses to 20-person SDR teams has a completely different unit economics denominator than one selling a per-company platform fee. Pick one and stay consistent through all three numbers.
Step 2 — Count total accounts in the category (TAM).
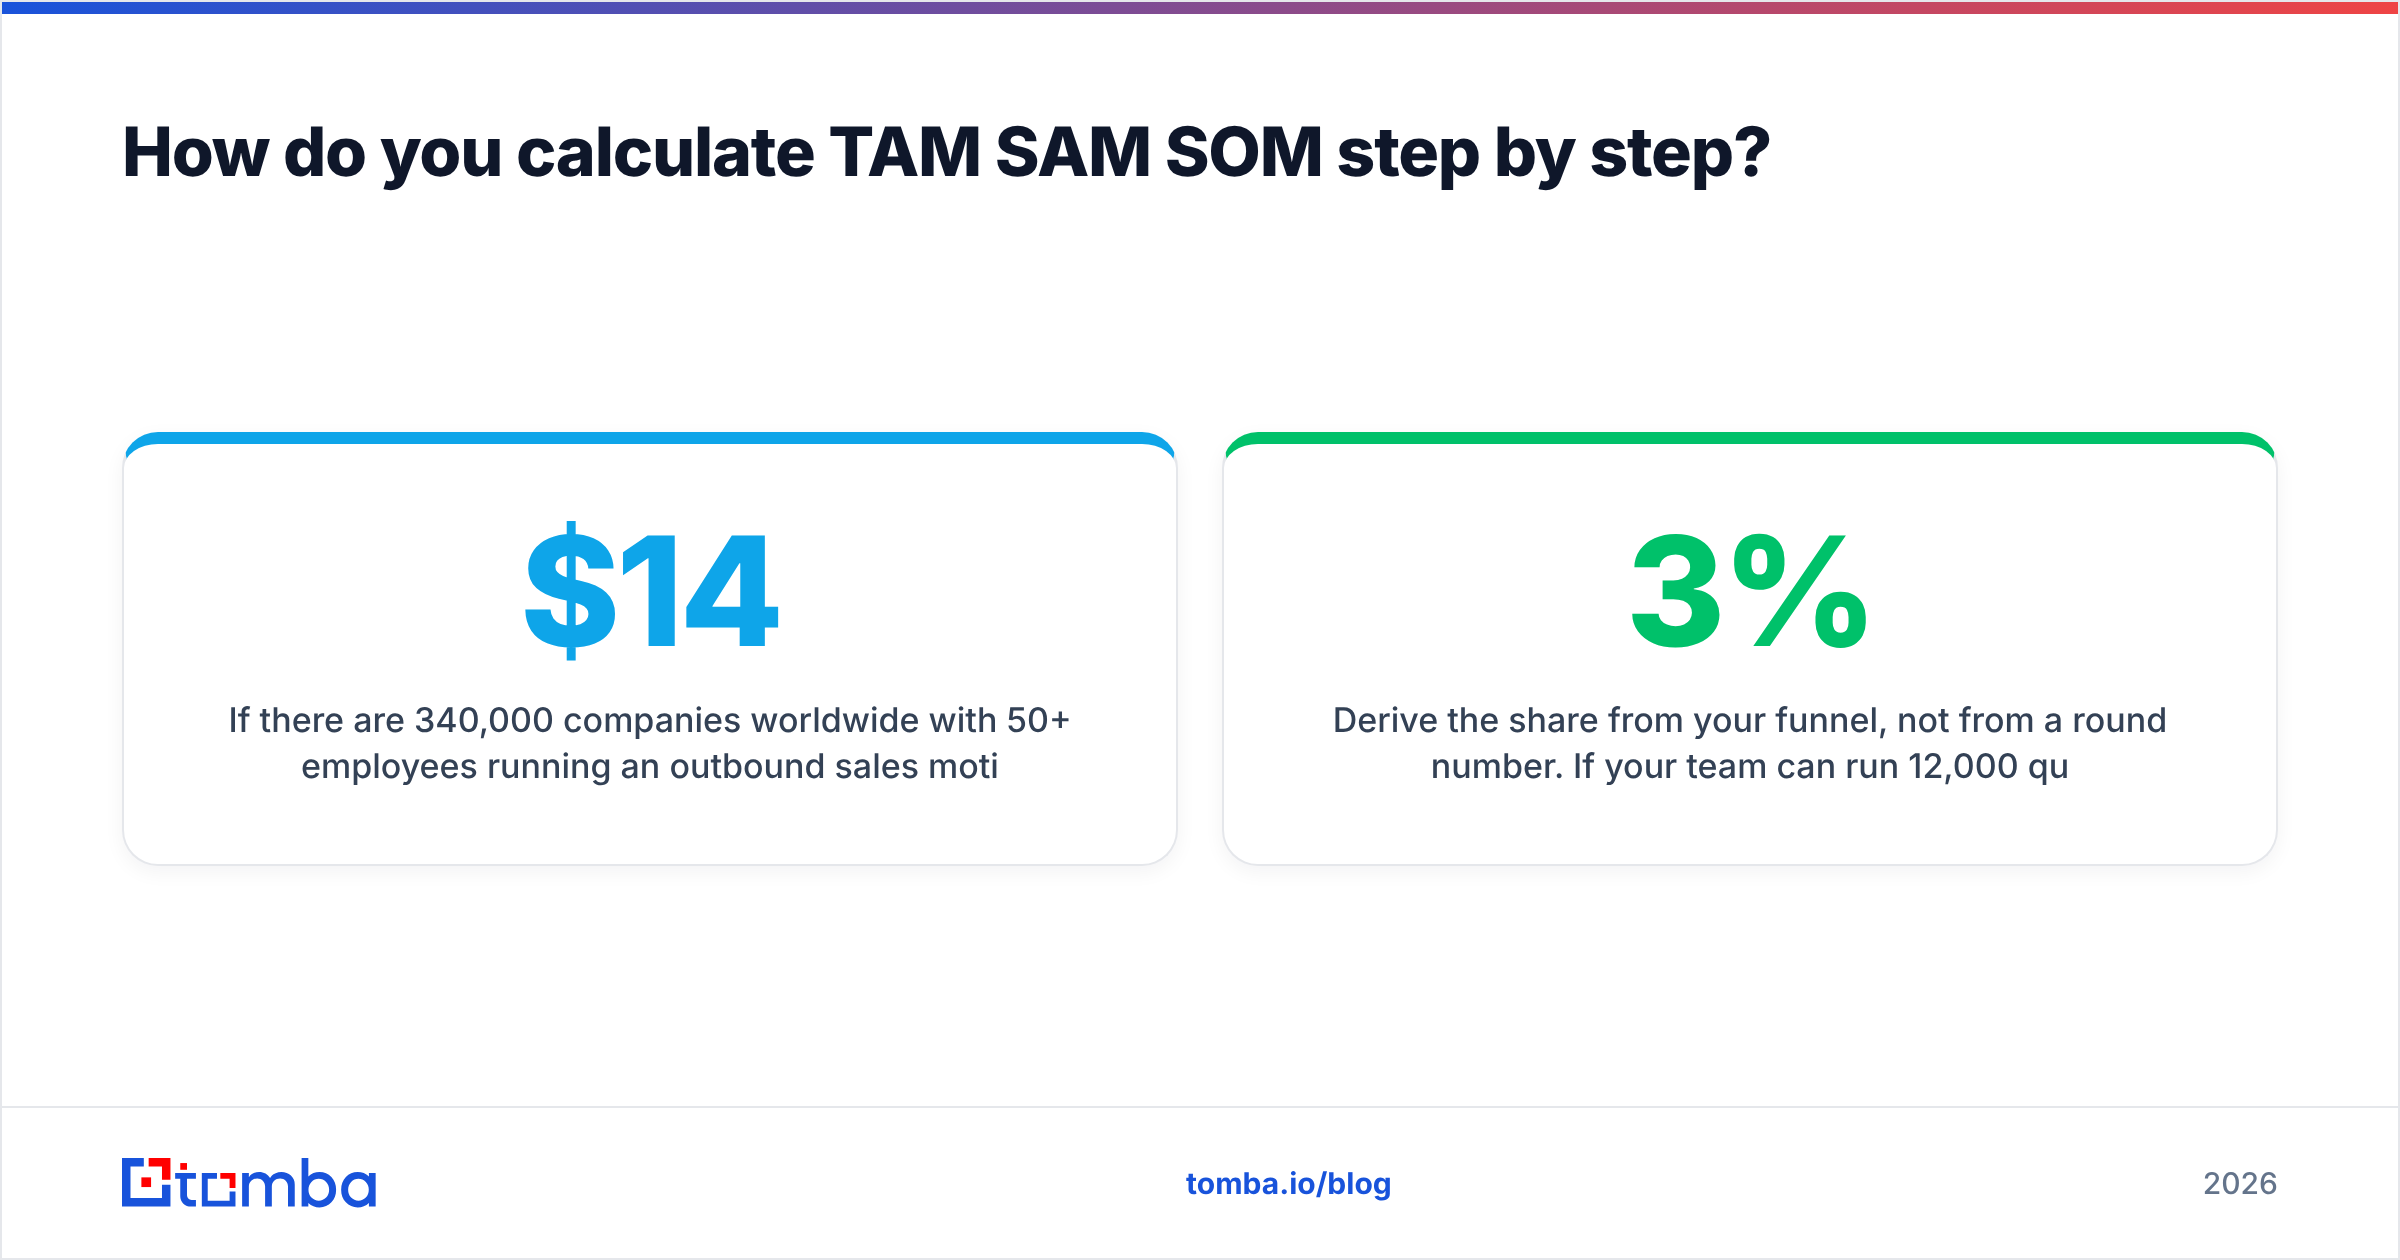
TAM = (Total number of buying units globally) × (Average annual revenue per unit)If there are 340,000 companies worldwide with 50+ employees running an outbound sales motion, and the average annual spend on prospecting data is $14,000, your TAM is roughly $4.76B. Note that this is a category number, not a you number.
Step 3 — Apply ICP filters to get SAM.
SAM = (Accounts matching your ICP filters) × (Your realistic ACV)Filters that actually shrink the number: headcount band, revenue band, industry (NAICS/SIC), country, language support, required integrations, tech stack, and compliance (SOC 2, HIPAA, GDPR data residency). If you only sell in North America and Western Europe and only support English, say so and cut the count.
Step 4 — Apply capture logic to get SOM.
SOM = SAM × (realistic market share you can win in the period)Derive the share from your funnel, not from a round number. If your team can run 12,000 qualified outbound touches a quarter, you book meetings on 3%, and you close 22% of meetings, your capacity ceiling is ~317 new customers per year. Multiply by ACV. That is a SOM you can defend, because every input is a number someone in your company already reports.
Step 5 — Cross-check top-down. Now go find the analyst number. If your bottom-up TAM is 8x larger or 8x smaller than the published category size, one of your assumptions is broken. Find it before an investor does.
Step 6 — Version it. Date every model, note the source of every input, and re-run quarterly.
What is the difference between top-down and bottom-up TAM?#
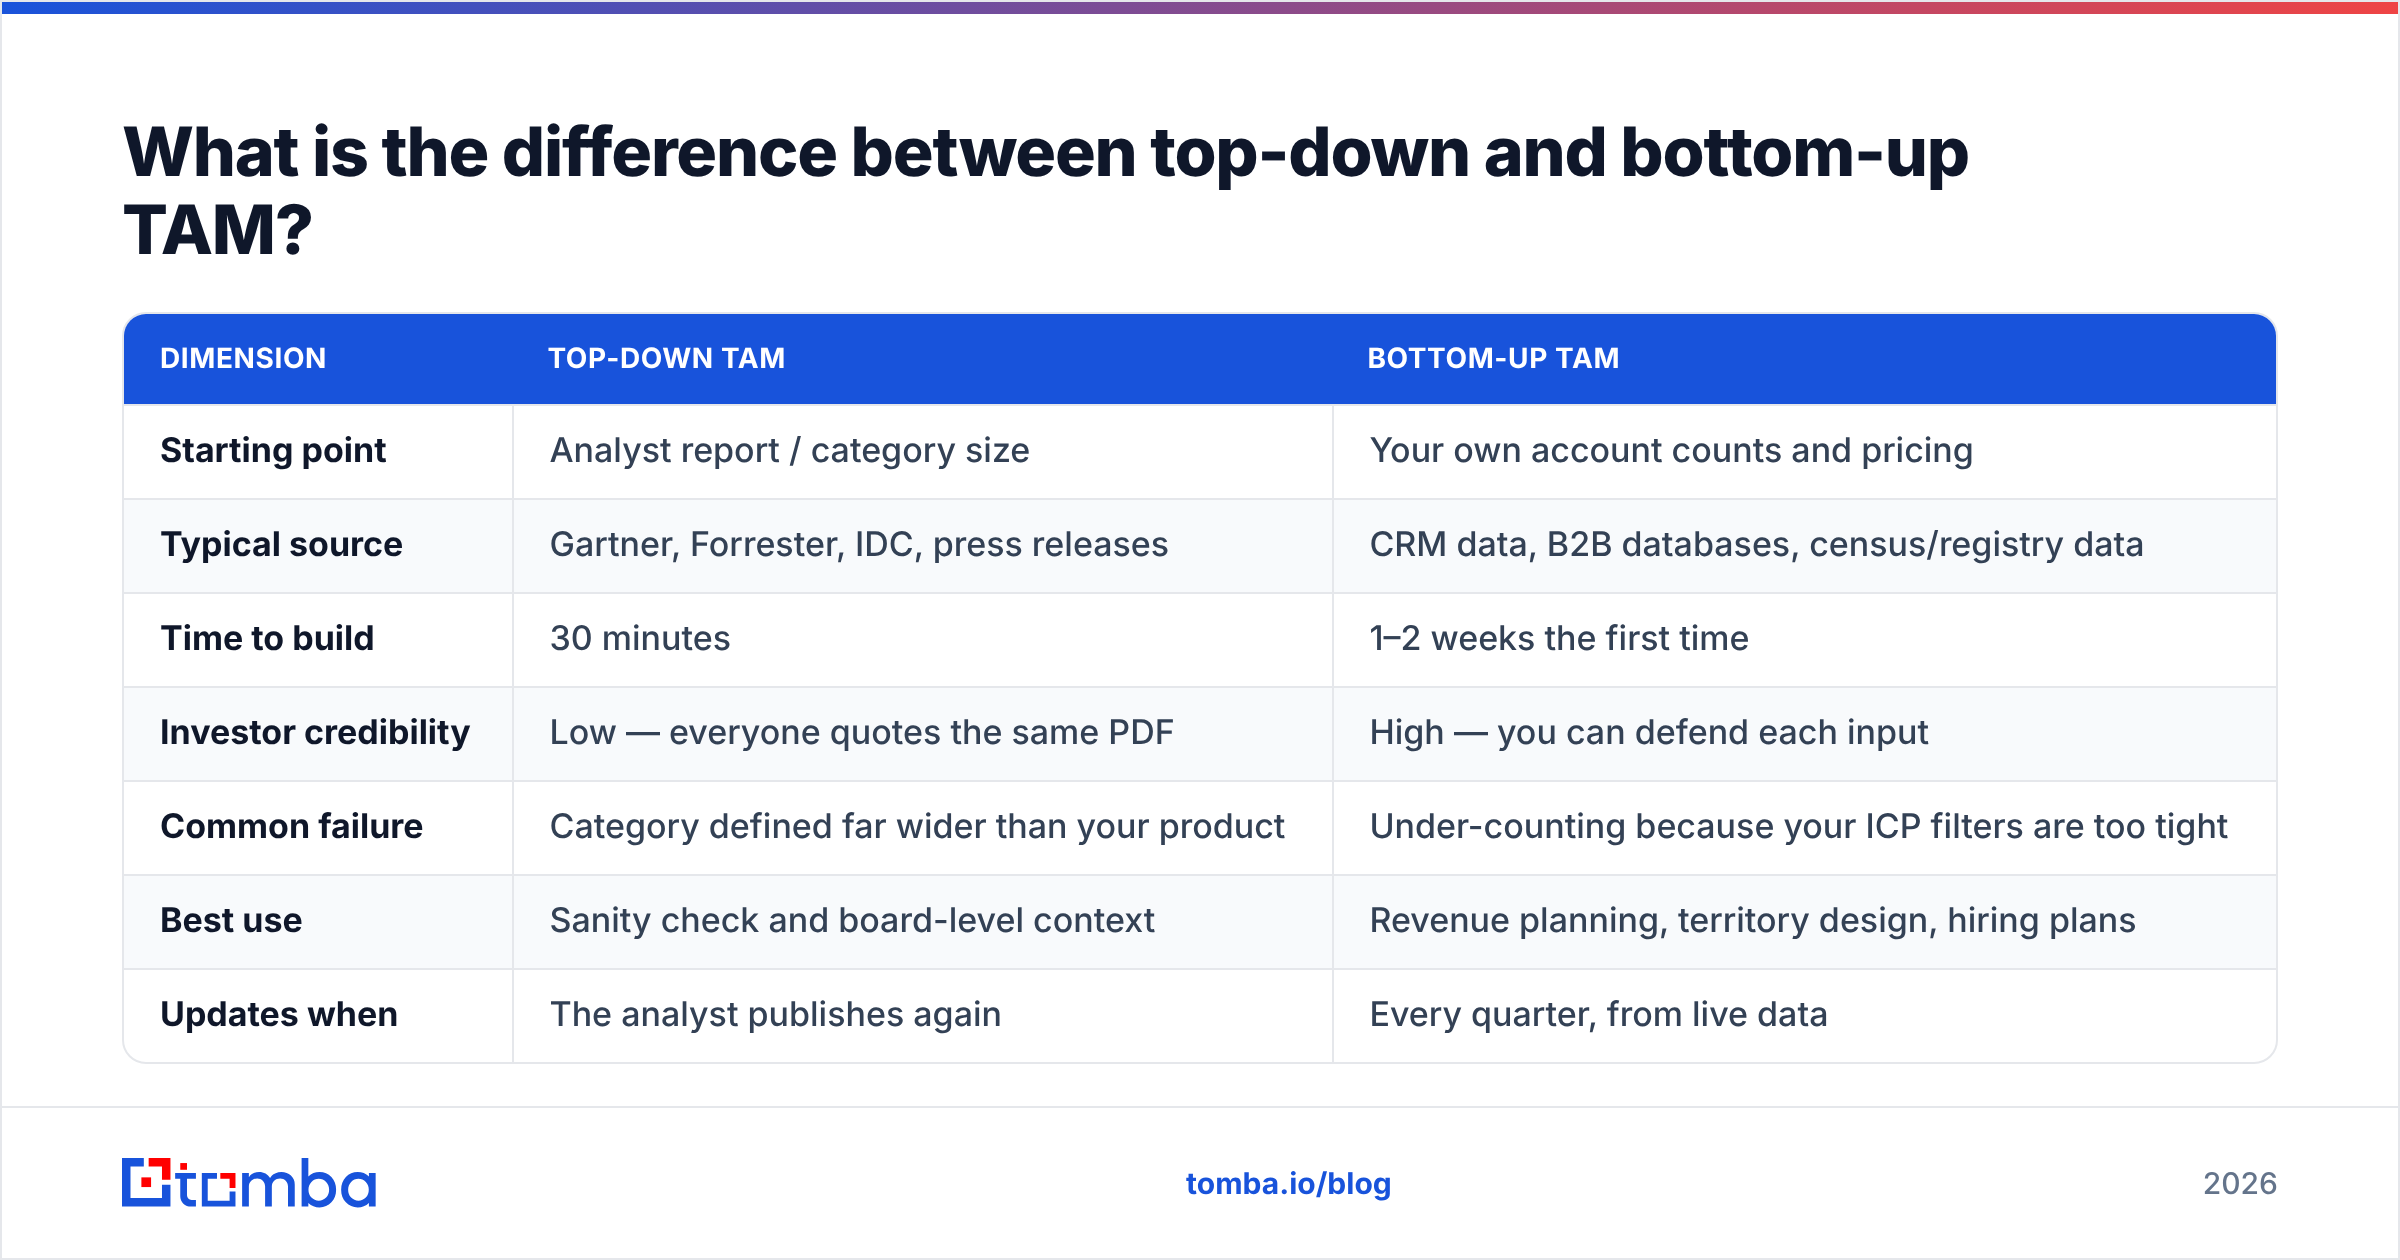
| Dimension | Top-down TAM | Bottom-up TAM |
|---|---|---|
| Starting point | Analyst report / category size | Your own account counts and pricing |
| Typical source | Gartner, Forrester, IDC, press releases | CRM data, B2B databases, census/registry data |
| Time to build | 30 minutes | 1–2 weeks the first time |
| Investor credibility | Low — everyone quotes the same PDF | High — you can defend each input |
| Common failure | Category defined far wider than your product | Under-counting because your ICP filters are too tight |
| Best use | Sanity check and board-level context | Revenue planning, territory design, hiring plans |
| Updates when | The analyst publishes again | Every quarter, from live data |
The honest position: you need both. Top-down alone is lazy. Bottom-up alone can miss adjacent demand you have not thought about. Analysts like Gartner and Forrester are useful for category boundaries and growth rates. They are not useful for your SOM, because they have never seen your win rate.
Where do you get the account counts that make the math credible?#
This is where most TAM models fall apart. The formula is trivial. Getting a defensible count of "companies matching my ICP" is the actual work.
Sources ranked by how well they hold up under scrutiny:
- Your own closed-won data — the single best source for ACV and for what your ICP actually is (as opposed to what your deck says it is). Pull median contract value by segment, not mean; one enterprise whale will distort everything.
- B2B contact and company databases — filterable by headcount, industry, geography, and tech stack. This is how you turn "SMBs in Europe" into an actual integer. A B2B database with firmographic filters lets you count matching accounts directly rather than estimating.
- Technographic filters — if your product only works alongside Salesforce, HubSpot, or Shopify, filter for it. This usually cuts SAM by 50–80% and makes your model far more believable.
- Government and registry data — the U.S. Census County Business Patterns, Eurostat, and Companies House give free headcount-band counts by industry. Free, slow, and coarse, but auditable.
- Review-platform category pages — G2 category listings tell you how many vendors compete and roughly how crowded the segment is, which feeds your capture-rate assumption.
Where teams cheat: they take a database's total record count and call it TAM. A database with 100M contacts does not mean 100M buying units. Contacts are people; TAM is spend. Collapse contacts to companies before you multiply by ACV, or you will overstate by an order of magnitude.
If you are building the account list yourself, domain search is the practical way to go from a company list to reachable decision-makers per account — which also gives you the second number you need: average buying-committee size per account.
How do you turn SOM into a revenue plan?#
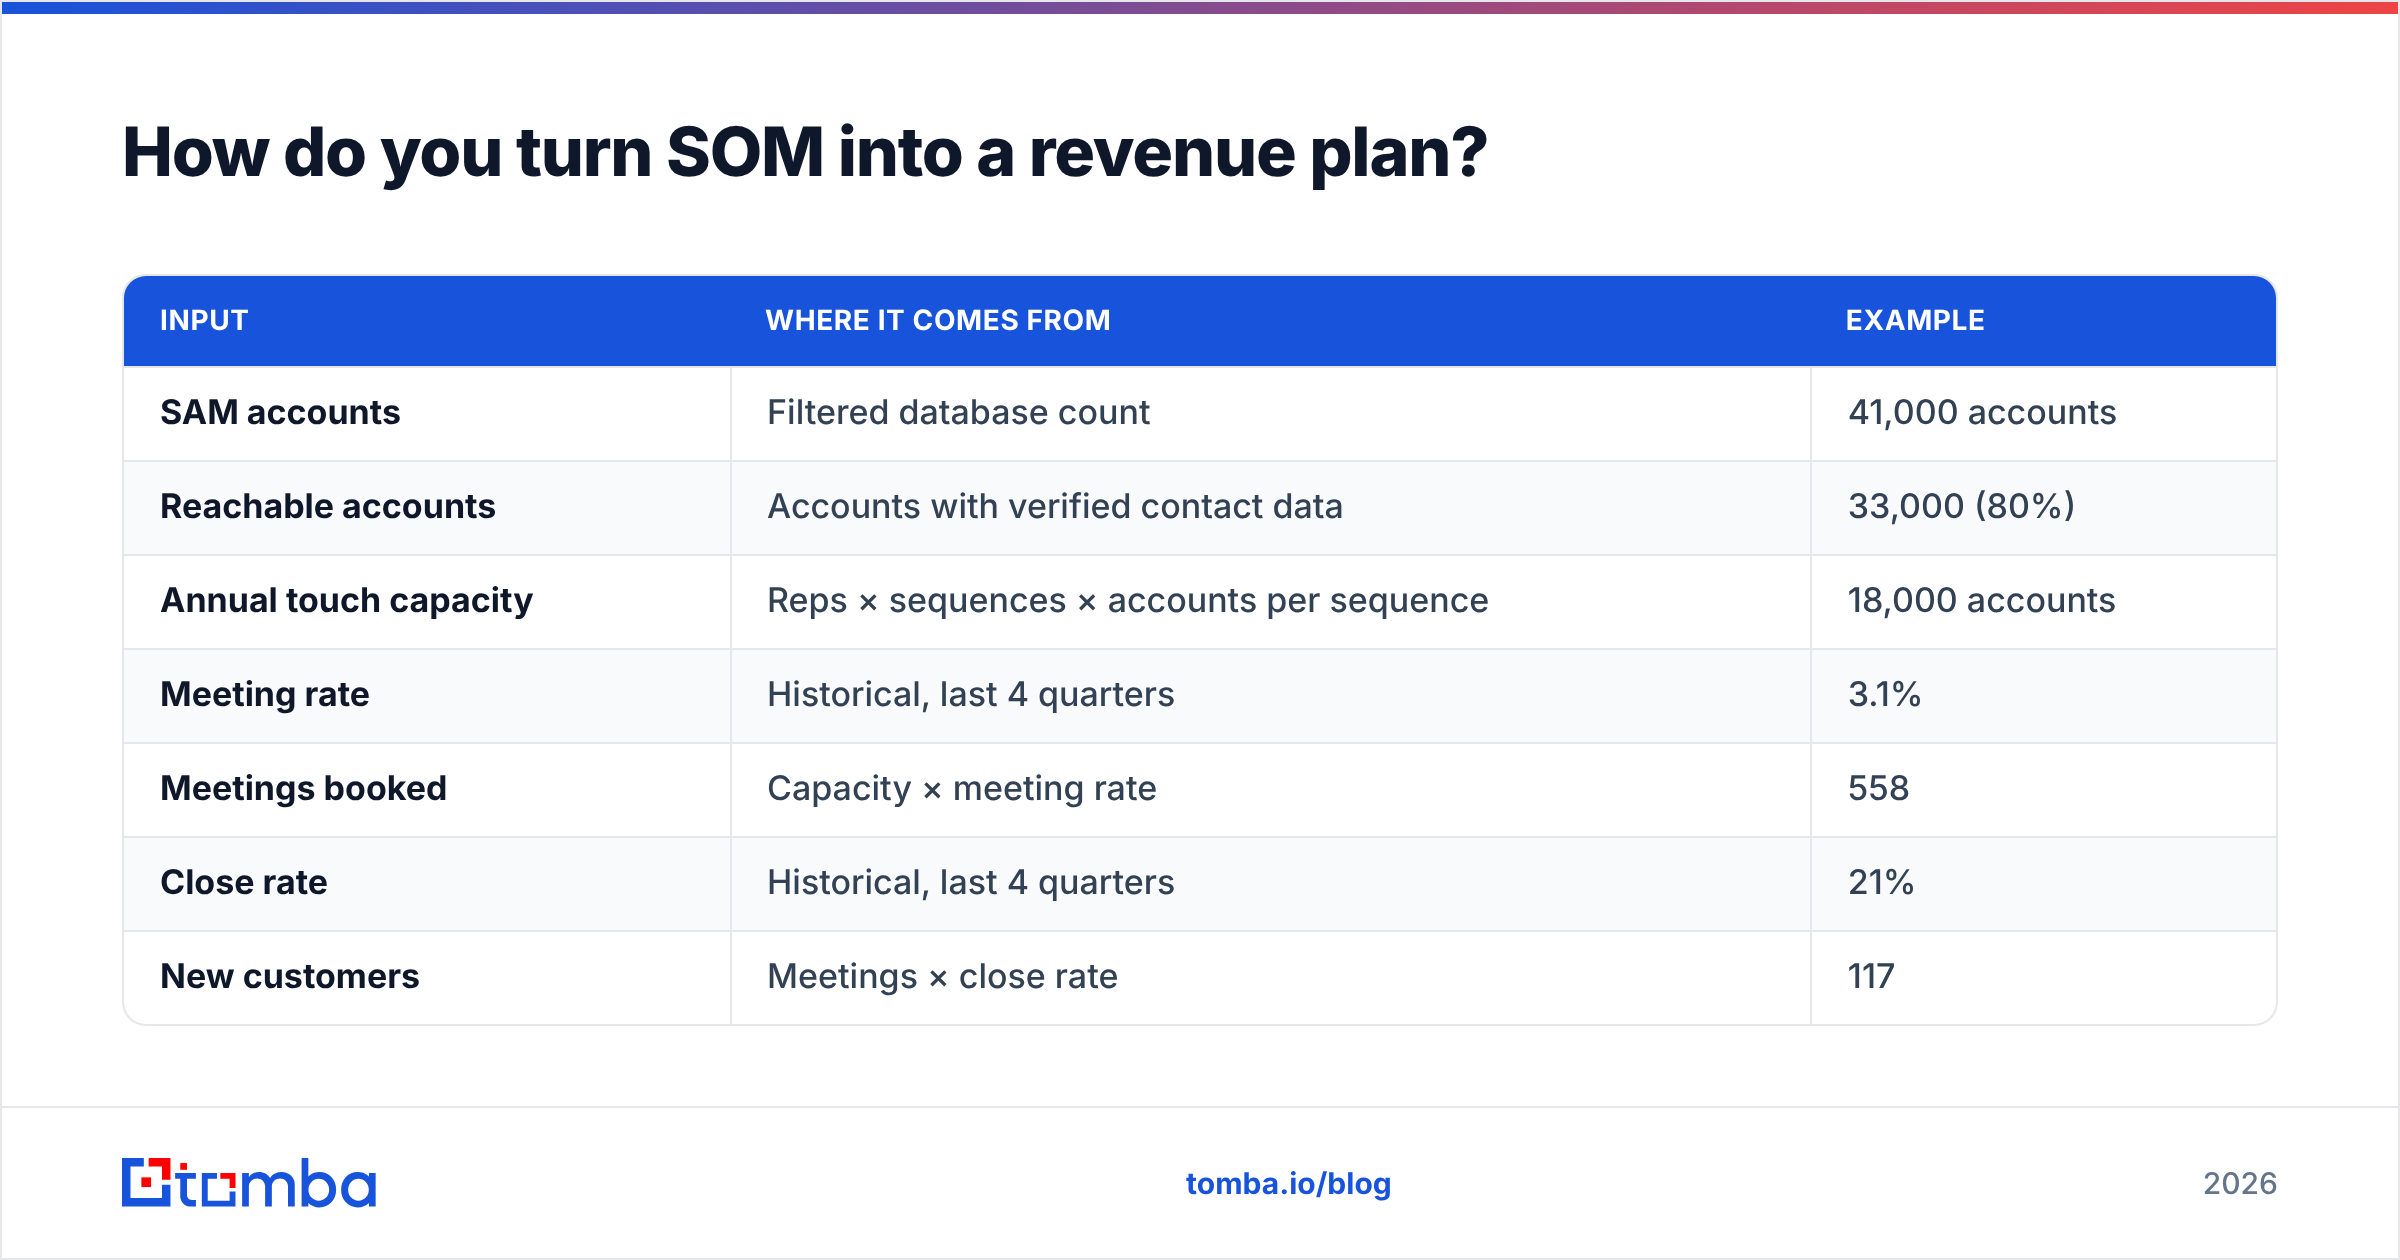
A SOM that does not connect to your quota model is decoration. Tie it down:
| Input | Where it comes from | Example |
|---|---|---|
| SAM accounts | Filtered database count | 41,000 accounts |
| Reachable accounts | Accounts with verified contact data | 33,000 (80%) |
| Annual touch capacity | Reps × sequences × accounts per sequence | 18,000 accounts |
| Meeting rate | Historical, last 4 quarters | 3.1% |
| Meetings booked | Capacity × meeting rate | 558 |
| Close rate | Historical, last 4 quarters | 21% |
| New customers | Meetings × close rate | 117 |
| ACV | Median closed-won | $11,400 |
| SOM (year 1) | Customers × ACV | $1.33M |
Two things fall out of this table immediately. First, "reachable accounts" is a real constraint — if 20% of your ICP has no findable contact data, that revenue is not obtainable this year, no matter what your SAM says. Second, the fastest lever is usually not more accounts; it is a higher meeting rate, which comes from better targeting and cleaner data rather than more volume.
This is also why email verification belongs in a market-sizing conversation at all. Bounce rate directly reduces your effective touch capacity. A list with 22% bad addresses means your 18,000-account capacity is really 14,000, and your SOM drops by a fifth before a single rep does anything wrong.
What are the most common TAM SAM SOM mistakes?#
- Defining the category too broadly. "We're in the $200B CRM market" when you sell a Chrome extension for LinkedIn prospecting. Investors read that as a signal you do not understand your own product.
- Using mean ACV instead of median. One outlier deal can double your model. Report both, plan with the median.
- Ignoring churn. TAM/SAM/SOM are usually annual-recurring numbers. If you churn 30% logo-annually, your year-two SOM is not additive.
- Confusing users with buyers. 500M professionals on LinkedIn is not a TAM. The companies paying for tools to reach them are.
- Forgetting competitive saturation. If three funded incumbents already own 60% of your SAM, your realistic capture rate in that segment is not 10%.
- Never updating it. A TAM model built at seed stage and shown at Series B is a credibility problem, not a shortcut.
- Presenting a single number. Show a range with stated assumptions. Conservative / base / aggressive, with the input that moves most between them clearly labeled.
How often should you rebuild the model?#
Quarterly for SOM, semi-annually for SAM, annually for TAM. SOM moves whenever headcount, win rate, or pricing changes — all of which happen every quarter in a growing company. SAM moves when you ship a major integration, add a language, or clear a compliance bar. TAM moves slowly and mostly because of category growth rates, so an annual refresh with a fresh analyst cross-check is enough.
Practically, keep the model in a spreadsheet with three tabs: raw account counts (with a refresh date and source per row), assumption inputs (ACV, rates, capacity), and outputs. When someone challenges a number in a board meeting, you should be able to click to the cell it came from in under ten seconds. That is the actual test of whether your market sizing is real.
For teams that rebuild the account layer often, pulling counts through an API rather than re-exporting CSVs saves the most time. The Tomba API and bulk email finder let you refresh both the account count and the reachable-contact count on a schedule, so the "reachable accounts" line in your SOM table stays honest instead of decaying quietly between quarters.
Which approach should you use if you're pre-revenue?#
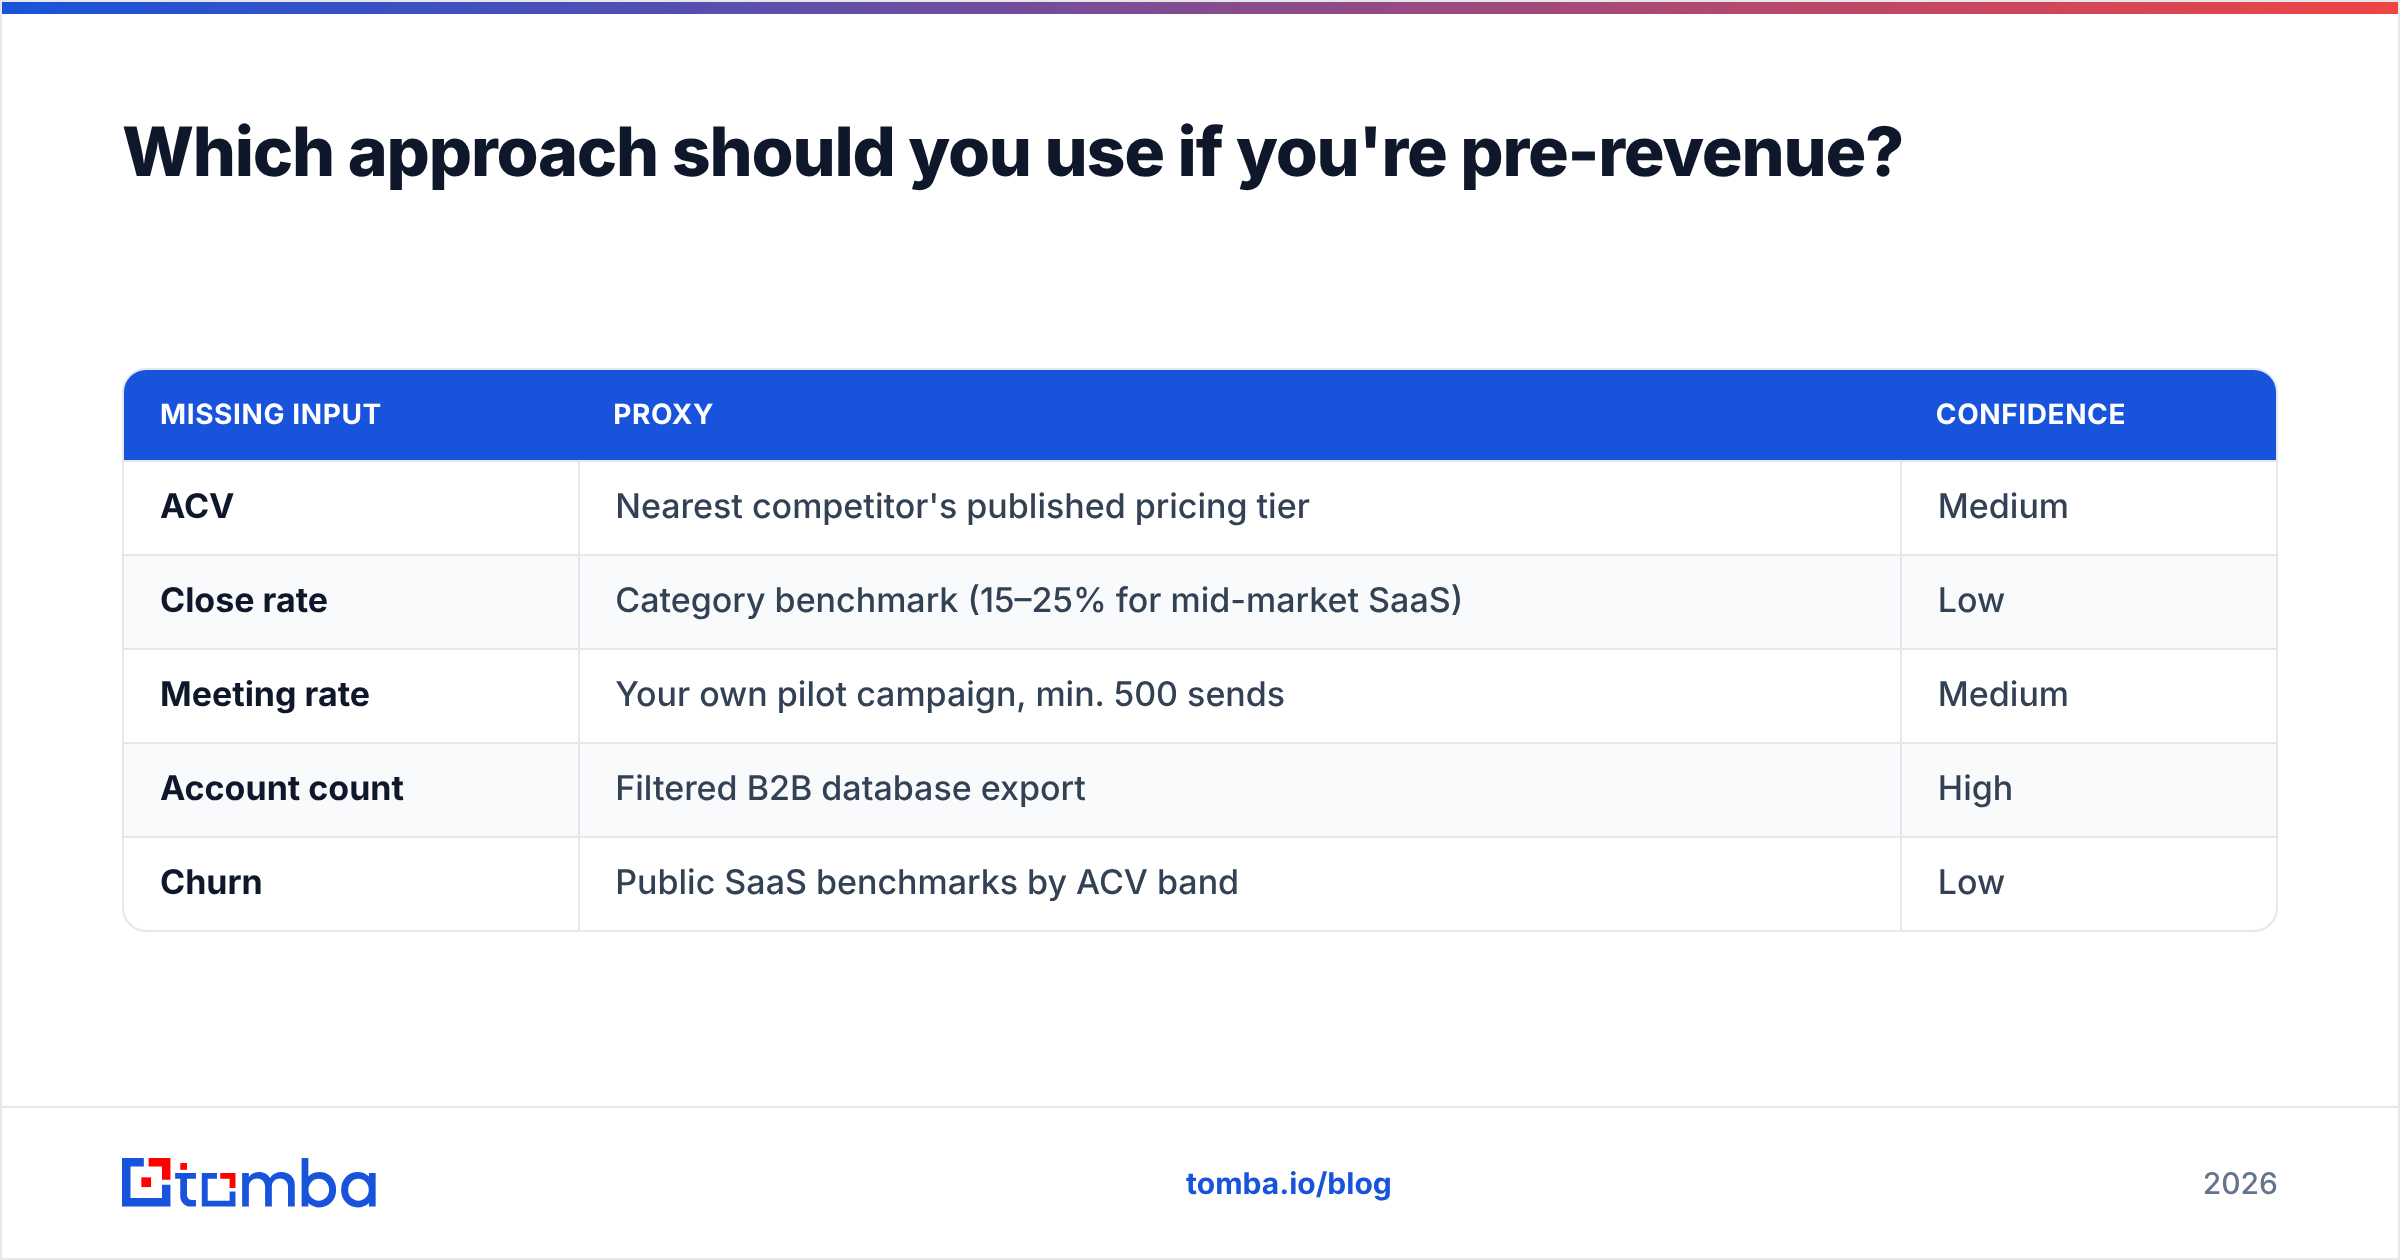
If you have no closed-won data, substitute proxies and label them clearly:
| Missing input | Proxy | Confidence |
|---|---|---|
| ACV | Nearest competitor's published pricing tier | Medium |
| Close rate | Category benchmark (15–25% for mid-market SaaS) | Low |
| Meeting rate | Your own pilot campaign, min. 500 sends | Medium |
| Account count | Filtered B2B database export | High |
| Churn | Public SaaS benchmarks by ACV band | Low |
Run one real 500-contact outbound campaign before you present a SOM. It costs almost nothing and replaces your two lowest-confidence assumptions with observed data. That single move does more for your credibility than any amount of spreadsheet polish. For competitive pricing anchors, vendor pricing pages — including Tomba pricing at $49/mo Starter, $99/mo Growth, and $249/mo Pro — are public and citable, which beats guessing at what a segment will pay.
Build the account layer before you build the model#
Every credible TAM SAM SOM model rests on one thing: a defensible count of companies that match your ICP, and a defensible count of how many of those you can actually reach. The formulas take an afternoon. The data layer is the work.
Start with the reachable half. Use the Tomba Email Finder to turn your filtered ICP account list into verified decision-maker contacts, so the "reachable accounts" line in your SOM table is a measured number instead of an assumption. The free tier gives you 25 searches a month to test the method on a sample before you commit to a full build — enough to see whether your ICP is as reachable as your model claims.
Related guides#
Ready to find emails that actually work?
Join 150,000+ professionals who stopped guessing and started sending. Free credits on signup — no credit card required.
Get the Tomba newsletter
Practical outbound tactics and product updates — once every two weeks.
About the author