How to Calculate Total Addressable Market (TAM) in 2026
TAM math breaks when your inputs are guesses. Here are three methods to calculate total addressable market, the formulas behind each, and how to sanity-check the number before a board meeting.
Most TAM slides are wrong because the inputs are guesses. Learning how to calculate total addressable market means counting two things well. First, how many accounts fit your ICP. Second, what each one pays you in a year. This guide covers the three methods, a worked example, and the checks investors run on the number.
TL;DR
- Bottom-up beats top-down. Multiply real account counts by real average contract value. Top-down analyst reports are a sanity check, not a source of truth.
- TAM, SAM, SOM are three different numbers. Conflating them is the fastest way to lose credibility in a board deck or a Series A pitch.
- The formula is simple; the inputs are the hard part. TAM = (number of qualified accounts) × (annual contract value). Everything difficult lives inside those two variables.
- Your account count should be verifiable. If you can't produce a list of the companies inside your TAM — with domains and contacts — the number is fiction.
- Refresh TAM every two quarters. Pricing changes, ICP shifts, and new segments move the number more than most teams assume.
What is total addressable market, really?#
Total addressable market (TAM) is a ceiling, not a forecast. It is the revenue you would earn in one year if every company that could buy your product bought it from you at today's price. No competitors. No sales-capacity limits. No churn.
Think of it like the seating capacity of a stadium. TAM is every seat in the building. SAM is the seats in the sections your ticketing partner actually sells. SOM is the seats you'll fill next season, given your marketing budget and the weather. Investors ask about the stadium; operators plan around next season.
Where teams go wrong is treating TAM as a marketing statistic instead of an operating input. A good TAM tells you how many accounts your SDR team must touch, how to split territories, and whether a new segment is worth a quota-carrying rep. A bad TAM tells you nothing, except that someone once read a Gartner press release.
The three-layer breakdown:
- TAM (Total Addressable Market) — every company on earth that fits your product category, at your price. Global, unconstrained.
- SAM (Serviceable Addressable Market) — the slice you can serve today, given geography, language, compliance, and integrations. If you can't invoice in euros, EMEA isn't in your SAM yet.
- SOM (Serviceable Obtainable Market) — the share of SAM you can win in a set window, usually 3 years, given your headcount, brand, and competition. Typically 1–10% of SAM for an early-stage company.
- Pipeline coverage — the operational layer nobody puts in the deck. SOM divided by your average deal size gives you a target account count, and that number should drive territory design.

Which method should you use to calculate TAM?#
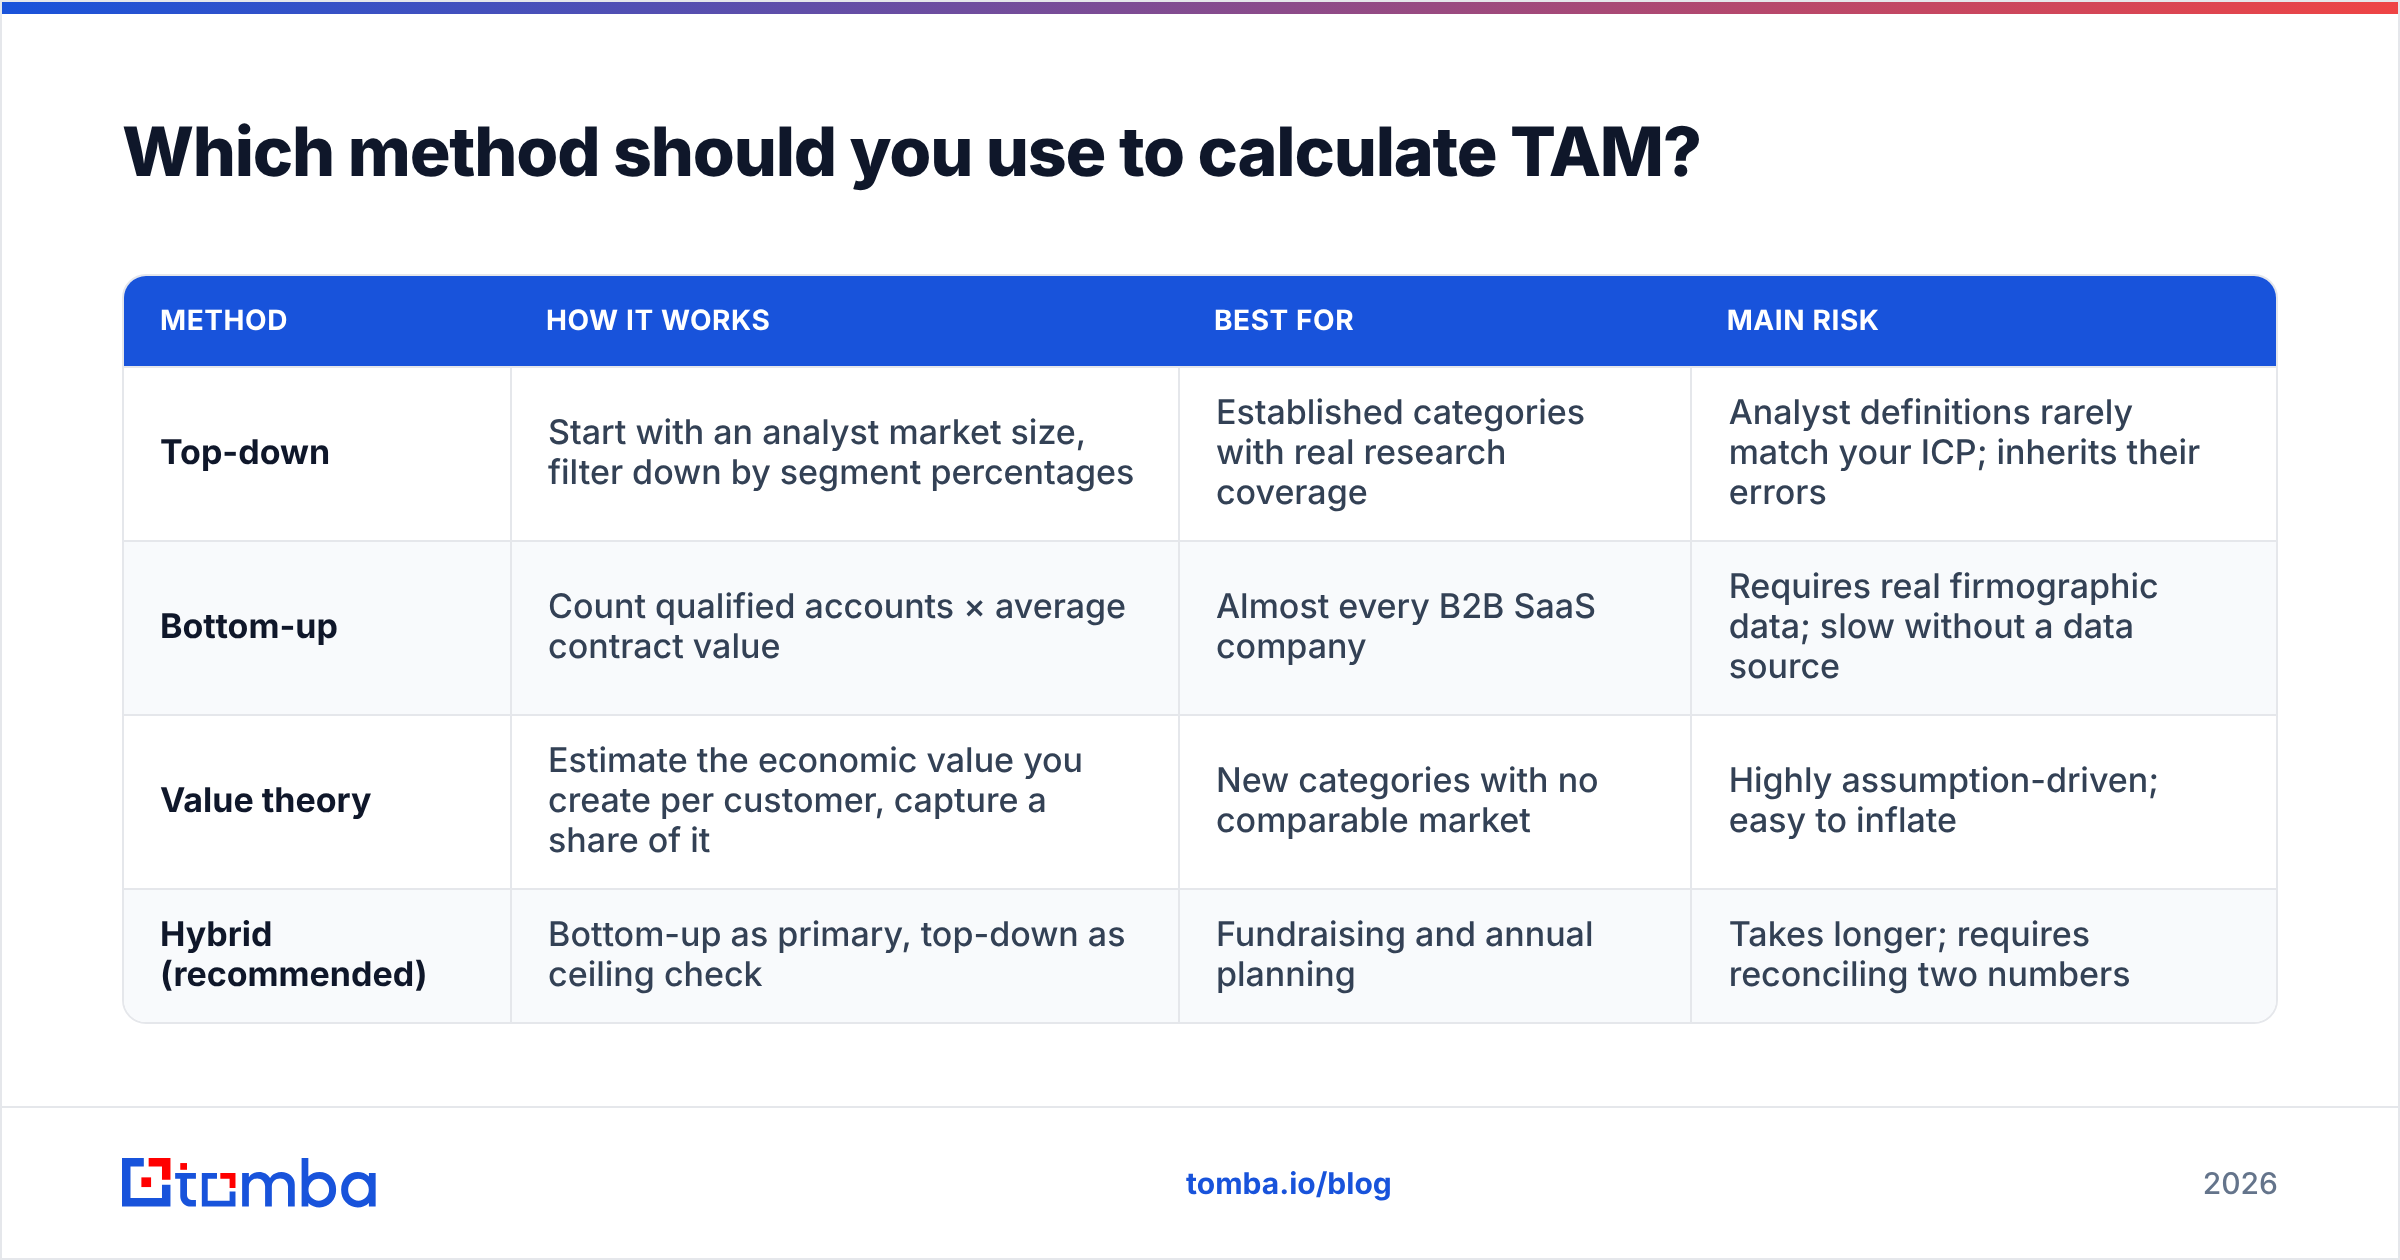
There are three accepted answers to how to calculate total addressable market. Serious GTM teams run at least two and compare.
| Method | How it works | Best for | Main risk |
|---|---|---|---|
| Top-down | Start with an analyst market size, filter down by segment percentages | Established categories with real research coverage | Analyst definitions rarely match your ICP; inherits their errors |
| Bottom-up | Count qualified accounts × average contract value | Almost every B2B SaaS company | Requires real firmographic data; slow without a data source |
| Value theory | Estimate the economic value you create per customer, capture a share of it | New categories with no comparable market | Highly assumption-driven; easy to inflate |
| Hybrid (recommended) | Bottom-up as primary, top-down as ceiling check | Fundraising and annual planning | Takes longer; requires reconciling two numbers |
Top-down is the fast one. You find a market-size report — say, the global sales-engagement software market — and multiply down: total market × your geography share × your segment share × your product's slice. It takes an afternoon. The problem is that you inherit the analyst's category definition, and it almost never matches your ICP. If a report bundles CRM, dialers, and email tooling into one figure, filtering it down to "companies who would buy our thing" is guesswork wearing a suit.
Bottom-up is the one that survives diligence. You build a list of real companies matching your ICP, count them, and multiply by what they'd pay. It's slower and it's correct. Better still, the artifact you produce — an actual account list — is directly usable by sales. Top-down produces a slide. Bottom-up produces a target list.
Value theory applies when your category doesn't exist yet. Say you save a 200-person support team 15 hours a week. Put a dollar value on that saving. Assume you can capture 10–20% of it in price. Then multiply across every company with a support team that size. It works for genuinely new products. Everywhere else it is dangerous, because every input is a judgment call.
How to calculate total addressable market bottom-up#
Five steps. Do them in order.
Step 1 — Define your ICP precisely enough to filter a database. "Mid-market SaaS companies" isn't a filter. "US and Canada, software vertical, 50–500 employees, has a marketing-automation tool installed, raised institutional funding" is. Write it as a set of firmographic and technographic conditions you could hand to a data provider. If your definition can't be turned into filters, it's a vibe, not an ICP.
Step 2 — Count the accounts that match. This is where most TAM models quietly fail. Teams estimate "there are probably 40,000 of them." Don't estimate — count. Pull the actual company list from a B2B database, deduplicate it, and remove the obvious noise: holding companies, dead domains, franchises counted 400 times. Your count should be a number you can export to CSV.
Step 3 — Determine realistic annual contract value. Use your actual closed-won ACV, not list price. If you have fewer than 20 closed deals, segment by tier and use list price with a discount haircut. For B2B SaaS, 15–25% is typical. Weight by segment: enterprise accounts at $40k and SMB at $4k can't share one average without distorting the whole model.
Step 4 — Multiply, then segment. TAM = Σ (accounts in segment × ACV for that segment). Always compute it per segment rather than as one blended figure. A blended number hides the fact that 80% of your TAM might sit in a segment you have no product-market fit in.
Step 5 — Pressure-test against top-down. Now run the quick analyst-report version. If your bottom-up number is 4x the published category size, one of your assumptions is broken — usually account count or ACV. If it's 100x smaller, your ICP filter is too tight. Reconciling the gap is the actual analytical work.
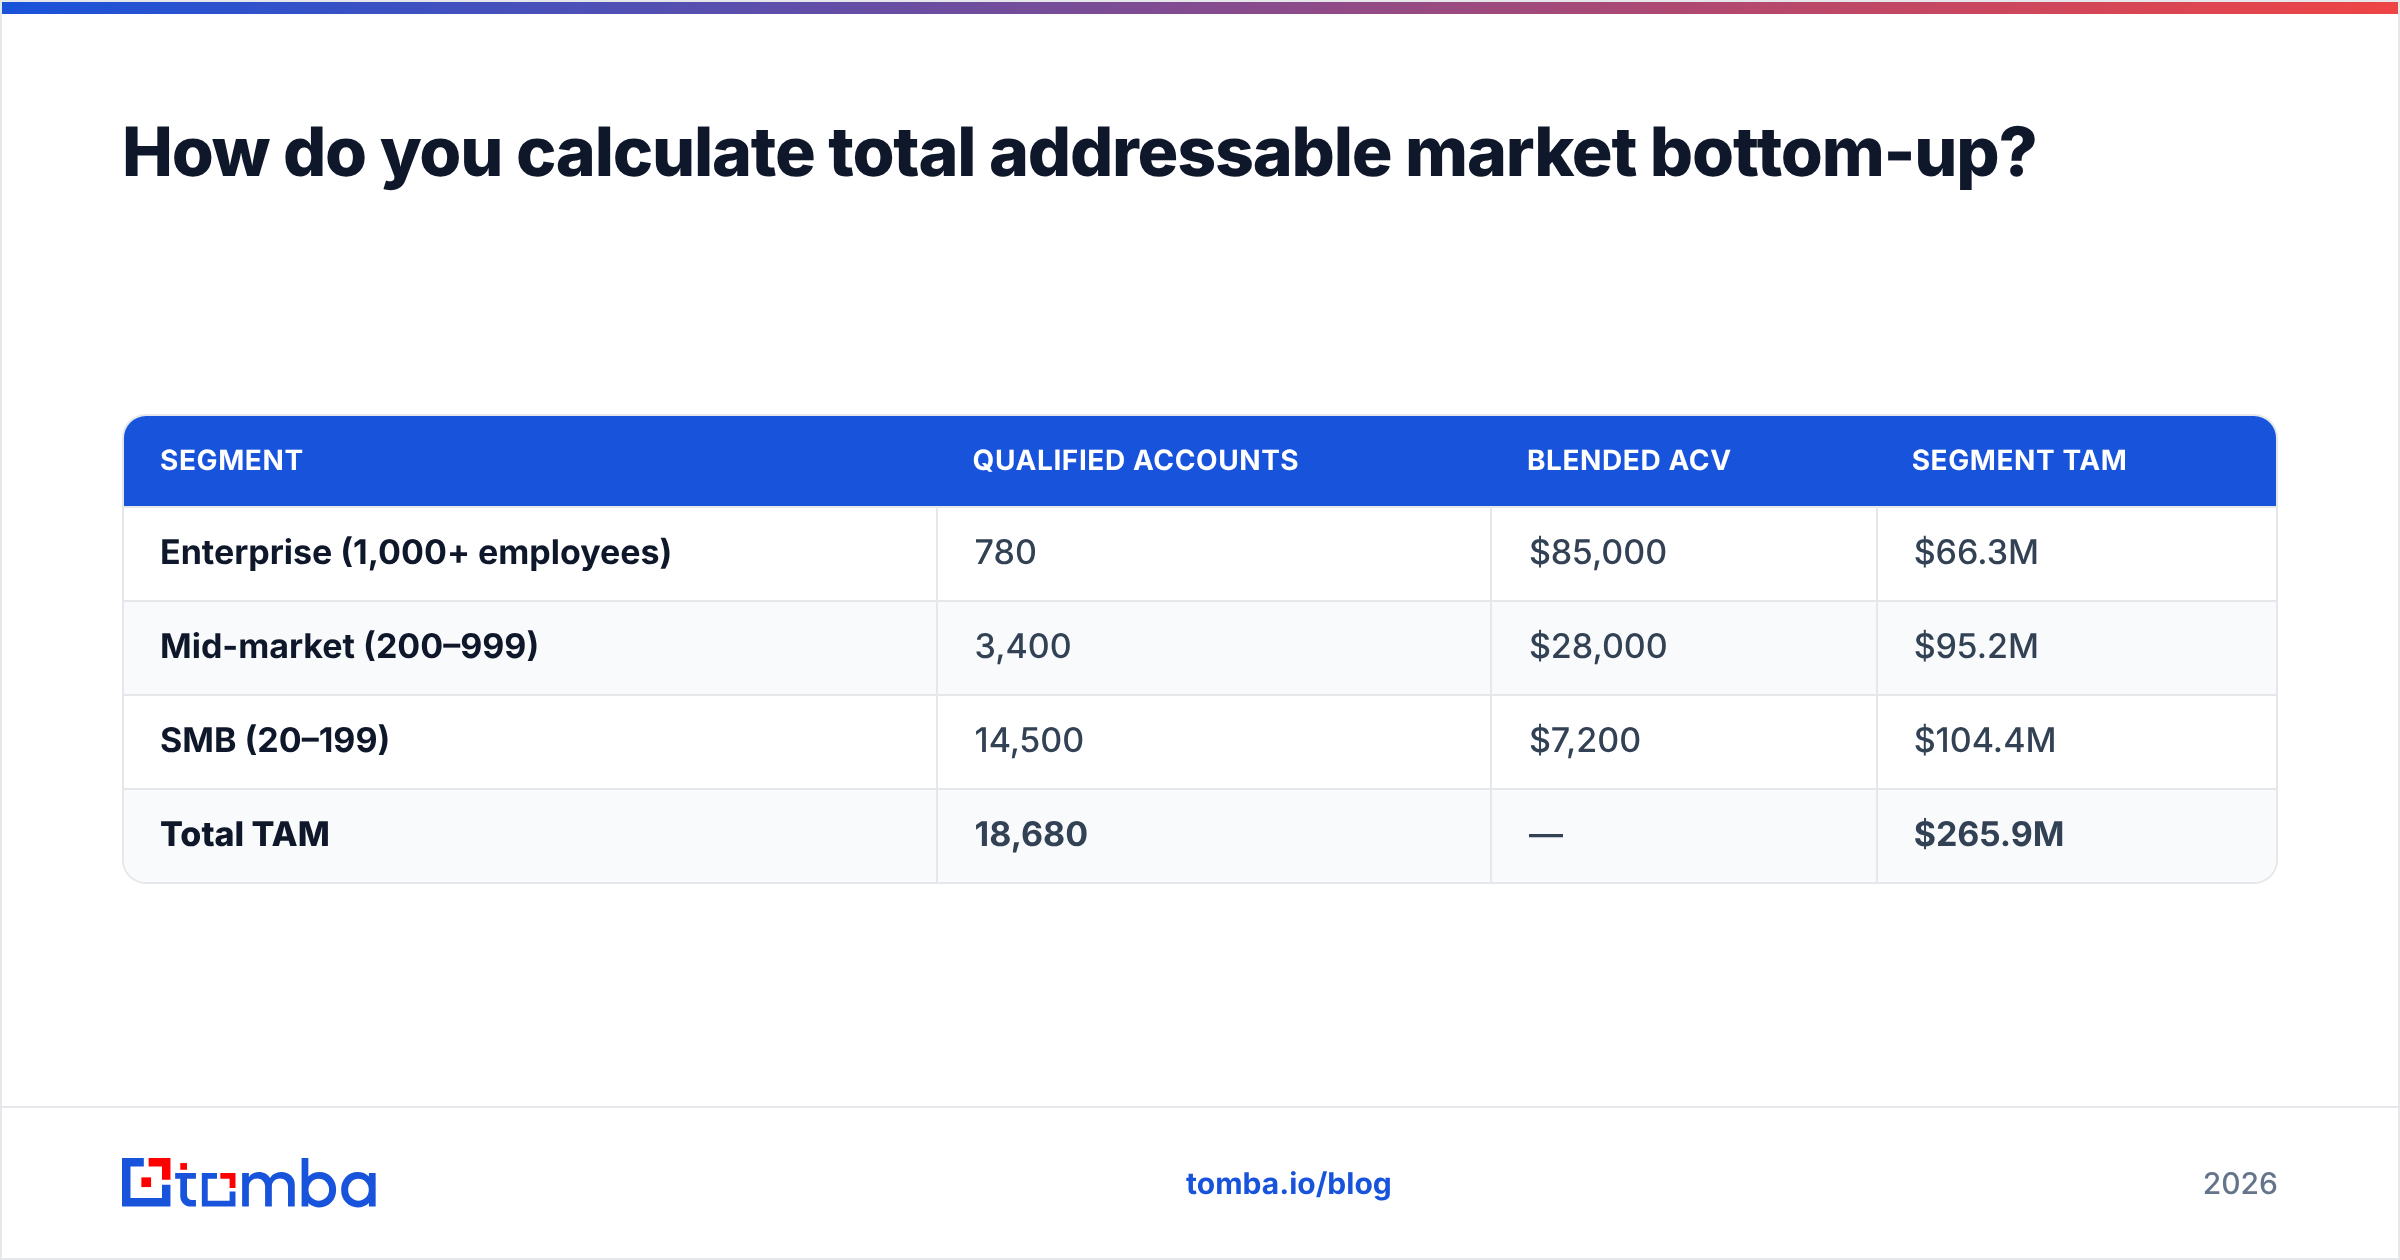
Worked example. You sell a compliance tool to fintechs in North America:
| Segment | Qualified accounts | Blended ACV | Segment TAM |
|---|---|---|---|
| Enterprise (1,000+ employees) | 780 | $85,000 | $66.3M |
| Mid-market (200–999) | 3,400 | $28,000 | $95.2M |
| SMB (20–199) | 14,500 | $7,200 | $104.4M |
| Total TAM | 18,680 | — | $265.9M |
That's a defensible $266M TAM with an account list behind every row. Compare it to the number you'd get by taking a $12B "global RegTech market" and multiplying by guessed percentages. Notice which one you'd rather defend in a partner meeting.
Where do you get the account data to count?#
Your TAM is only as good as your account list. That makes the data layer the whole model, not a footnote. Three practical sources:
Public and semi-public registries. Company registries, SEC filings, and industry association member lists are free and authoritative, but slow to assemble and rarely deep on firmographics. Good for regulated verticals where a licensing body publishes a complete roster.
Commercial B2B databases. Providers like BookYourData, ZoomInfo, and Apollo let you filter by firmographics and export counts directly. Most will show you a match count before you buy, which is exactly what a bottom-up TAM needs. Check G2 for coverage comparisons by region before committing — coverage varies wildly outside North America.
Domain-level enrichment. If you already have a partial list — conference attendees, website visitors, a scraped directory — the faster path is enriching what you have. Run domains through a domain search to confirm the company is live and staffed, then use data enrichment to fill in headcount, industry, and tech stack. Dead domains and shell entities inflate account counts more than any other single error.
One discipline is worth adopting: your TAM account list and your outbound target list should be the same file. When they diverge, one of two things is true. Either your TAM includes companies sales has written off, or sales is working accounts outside the model. Both are worth catching. If your list is large, a bulk email finder turns the TAM file into a working prospect list without a second data-cleaning cycle.

How do TAM, SAM, and SOM differ in practice?#
| Dimension | TAM | SAM | SOM |
|---|---|---|---|
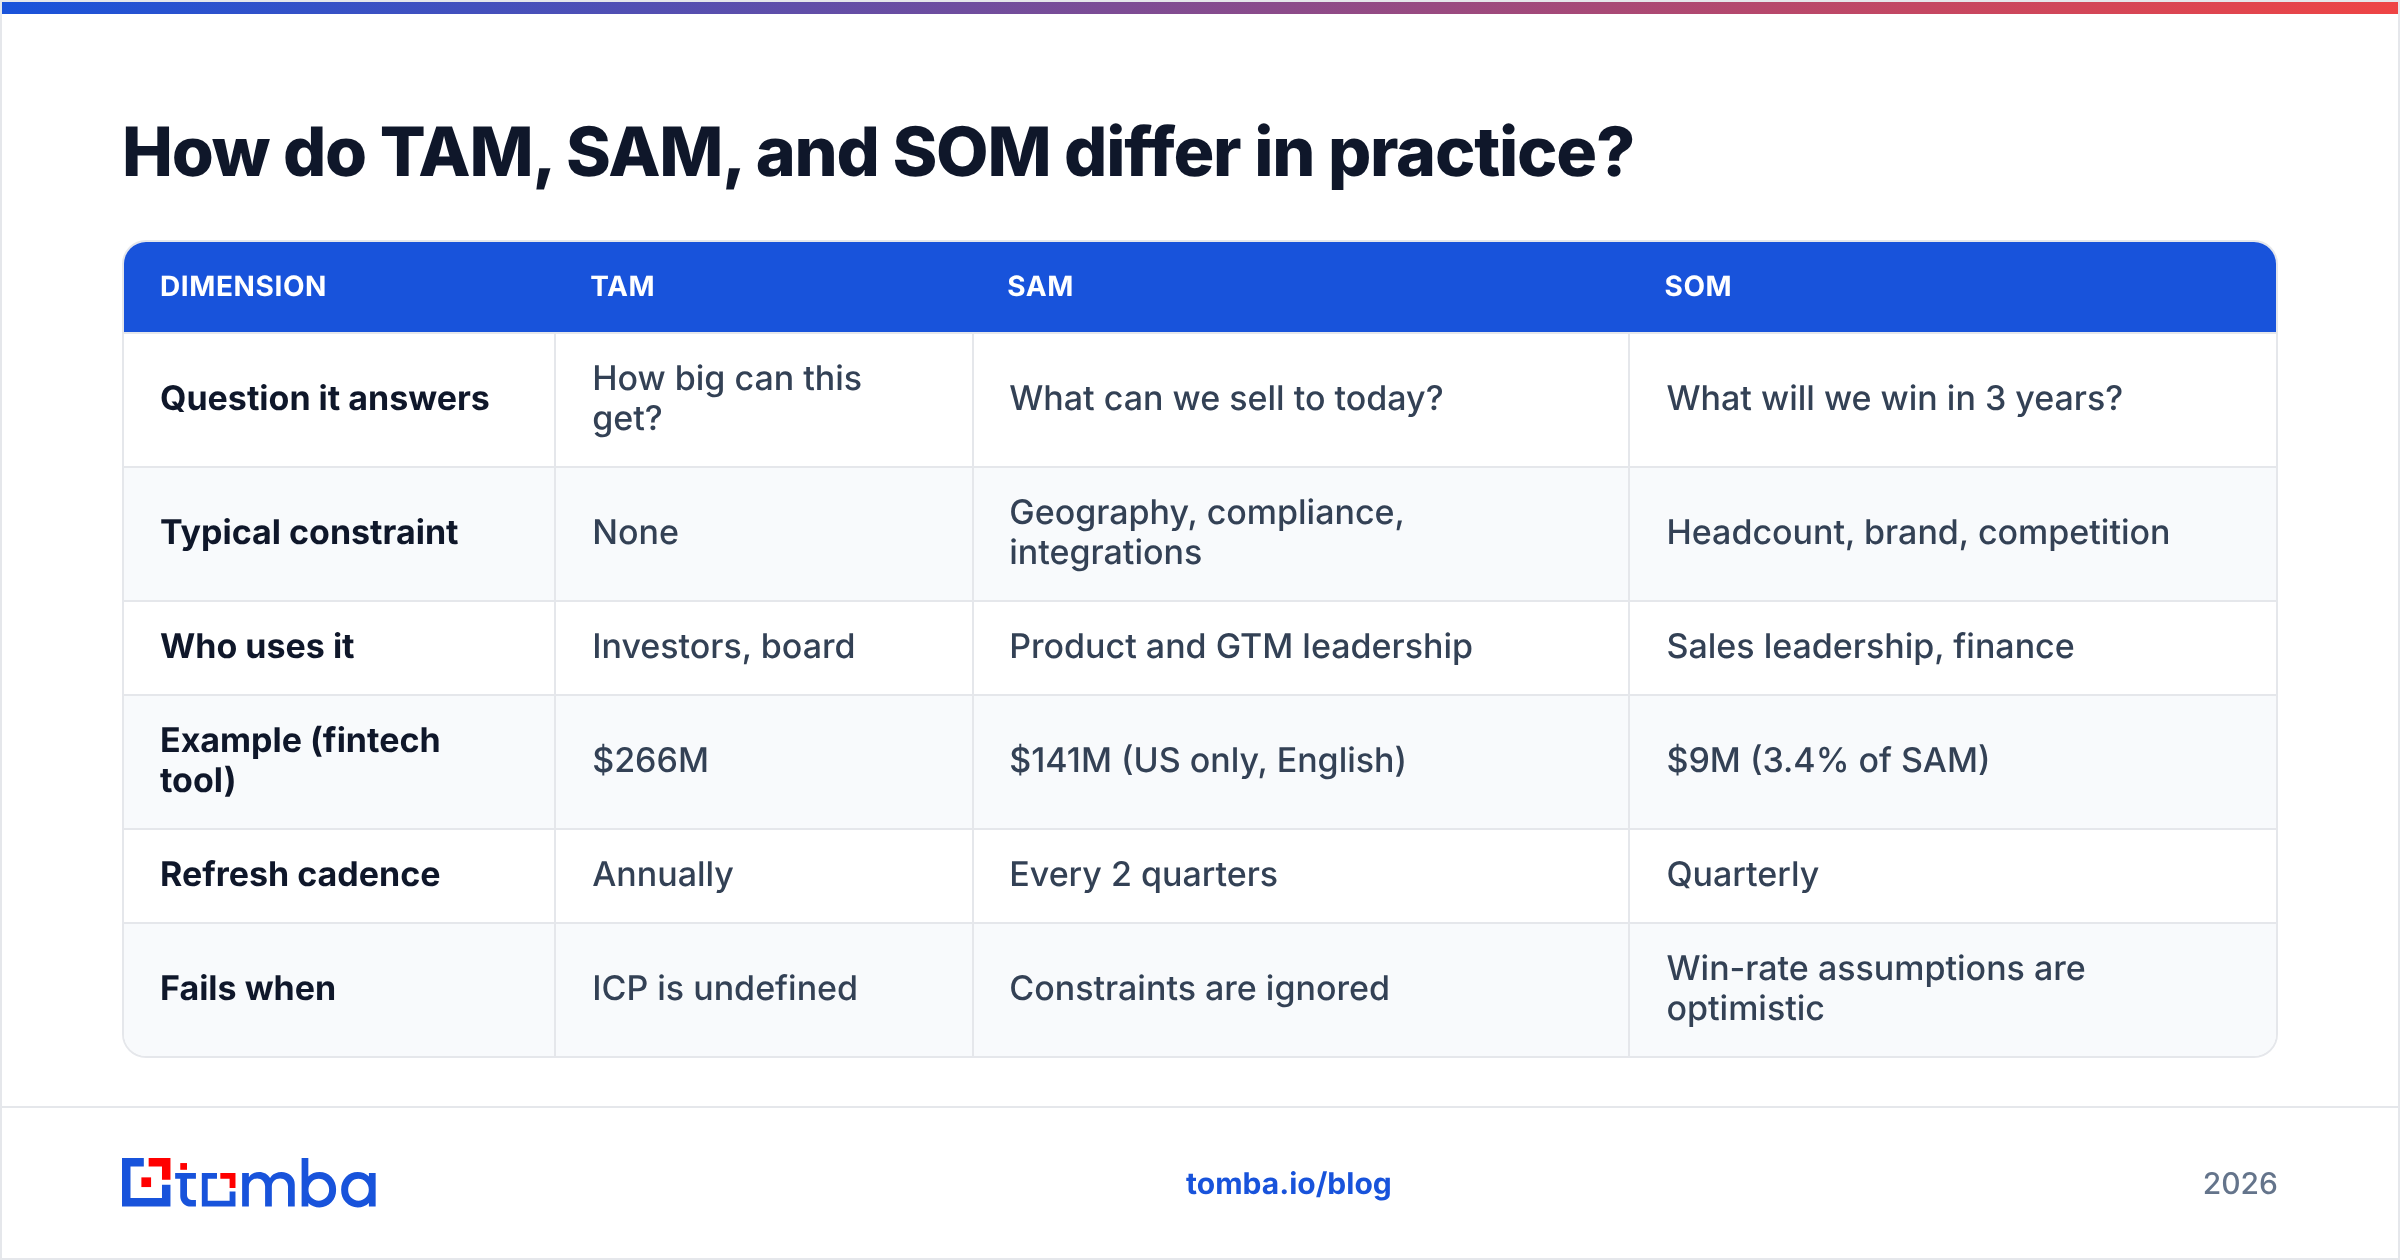
| Question it answers | How big can this get? | What can we sell to today? | What will we win in 3 years? |
| Typical constraint | None | Geography, compliance, integrations | Headcount, brand, competition |
| Who uses it | Investors, board | Product and GTM leadership | Sales leadership, finance |
| Example (fintech tool) | $266M | $141M (US only, English) | $9M (3.4% of SAM) |
| Refresh cadence | Annually | Every 2 quarters | Quarterly |
| Fails when | ICP is undefined | Constraints are ignored | Win-rate assumptions are optimistic |
The most common mistake in fundraising decks is presenting TAM where SAM belongs. Any competent investor asks the same first question: what portion of that can you reach this year? If you can't answer with a SAM number and its constraints, the TAM number stops being credible too.
The second most common mistake is a SOM with no derivation. "We'll capture 5% of the market" isn't an estimate; it's a wish. Derive SOM from capacity instead: reps × meetings per rep per year × win rate × ACV. That produces a number tied to hiring plans, which is what the board wants to interrogate. If you already track win rate by segment, you have most of the inputs.
What makes a TAM number fall apart in diligence?#
Six failure modes, roughly in order of frequency:
- Circular sourcing. Your TAM cites a blog post that cites a press release that cites an analyst report. Trace every top-down input to a primary source.
- Unverified account counts. A filter returned 47,000 rows, so you wrote 47,000. Dedupe first. Dead domains and franchise records inflate raw counts by 15–30%.
- List-price ACV. If your real ACV is 22% below list, modeling at list price inflates TAM by 22%.
- Stale ICP. You built the model when you sold to marketing teams. You now sell to RevOps. Nobody rebuilt it.
- Double-counted segments. "Enterprise" and "financial services" overlap. Segment along two axes and you count the same companies twice.
- No geography constraint. Global TAM, US pipeline, and an EMEA-inclusive SAM in one deck, with no explanation of the jumps.
The fix for most of these is the same: keep the underlying account list, not just the summary number. A TAM you can drill into is a TAM you can defend. Frameworks from HubSpot's revenue-planning resources and standard market-sizing methodology are useful scaffolding, but neither substitutes for your own verified account list.
How often should you recalculate TAM?#
Knowing how to calculate total addressable market is half the job. Knowing when to redo it is the other half. Full rebuild annually; targeted refresh every two quarters. Trigger an off-cycle recalculation whenever any of these happen:
- You change pricing. A 20% price increase moves TAM 20% — mechanically, immediately.
- You ship a feature that unlocks a segment. SOC 2 compliance, a new language, or a major integration can expand SAM overnight.
- Your ICP shifts. Look at your last 20 closed-won deals. If the median company profile has moved, your model describes a market you no longer sell to.
- A competitor exits or consolidates. Doesn't change TAM, but materially changes SOM.
- You enter a new geography. New SAM, new constraints, usually new ACV assumptions.
In practice, the TAM model should be a living spreadsheet with a refreshable account list underneath. Not a slide someone rebuilt for the last board meeting. Teams doing revenue operations well treat the account list as infrastructure: it feeds TAM, territory design, and outbound targeting from one source.
What should you do with the number once you have it?#
Three things, in order of value:
Territory design. Divide your SAM account list by rep capacity. If you have 3,400 mid-market accounts and 4 AEs, each rep owns 850. That tells you immediately whether you need more reps or a tighter ICP.
Segment prioritization. Rank segments by TAM per unit of sales effort, not raw TAM. The SMB segment in the example above has the largest TAM but likely the worst CAC payback. Raw size is the least interesting property of a segment.
Outbound targeting. The account list is already built. Convert it into a contactable list by finding decision-maker contacts at each domain, then verifying them before they enter a sequence. Sending to a stale list from a TAM export is a reliable way to damage email deliverability before the campaign starts.
That last step is where most TAM projects stall. The model gets built, presented, and then filed, because turning 18,000 company names into 18,000 verified contacts is tedious work.
It doesn't have to be. Once your TAM account list exists, run the domains through Tomba Email Finder to pull decision-maker contacts at scale, then verify them so your bounce rate stays under 2%. The free tier gives you 25 searches to test the workflow. Starter is $49/mo and Growth is $99/mo when you're ready to process a full TAM export. See Tomba pricing for the full breakdown. The point isn't the tooling — it's that a TAM you can email is a TAM that actually does something.
Related guides#
Ready to find emails that actually work?
Join 150,000+ professionals who stopped guessing and started sending. Free credits on signup — no credit card required.
Get the Tomba newsletter
Practical outbound tactics and product updates — once every two weeks.
About the author