How to Calculate Win Rate: Formula, Benchmarks, and Fixes
Most teams calculate win rate wrong and then optimize against a number that lies. Here is the exact formula, the three variants that matter, 2026 benchmarks, and how to fix a broken denominator.
TL;DR
- Win rate = deals won ÷ deals closed (won + lost) × 100. Using all opportunities created as the denominator is the single most common mistake and it understates your true number by 20-40%.
- Three variants matter: closed win rate, opportunity win rate, and cohort win rate. Each answers a different question. Pick one per dashboard and never mix them in the same chart.
- Median B2B SaaS win rate sits in the 15-25% band depending on ACV and segment. Anything above 40% usually means you are under-qualifying the top of funnel, not selling brilliantly.
- Win rate collapses when your data does. Bad contact data means fake meetings, ghost opportunities, and a denominator stuffed with deals that were never real.
- Fix the inputs first: clean contacts, a written opportunity-creation rule, and mandatory loss reasons. Then optimize the rate.
What is win rate and why does the denominator decide everything?#
Win rate is the percentage of sales opportunities you close as customers. That definition sounds trivial until you try to write the SQL.
Think of it like a batting average. Nobody counts at-bats where the player is still standing in the on-deck circle. But that is exactly what most CRM dashboards do — they sweep open pipeline into the denominator, and the number sinks for reasons that have nothing to do with selling ability.
The core formula:
Win Rate = (Deals Won ÷ (Deals Won + Deals Lost)) × 100Only closed deals belong in the denominator. An opportunity sitting in "Negotiation" for 90 days is not a loss yet — it is an unresolved bet. Including it makes today's win rate a function of how much open pipeline you happen to be carrying, which is noise.
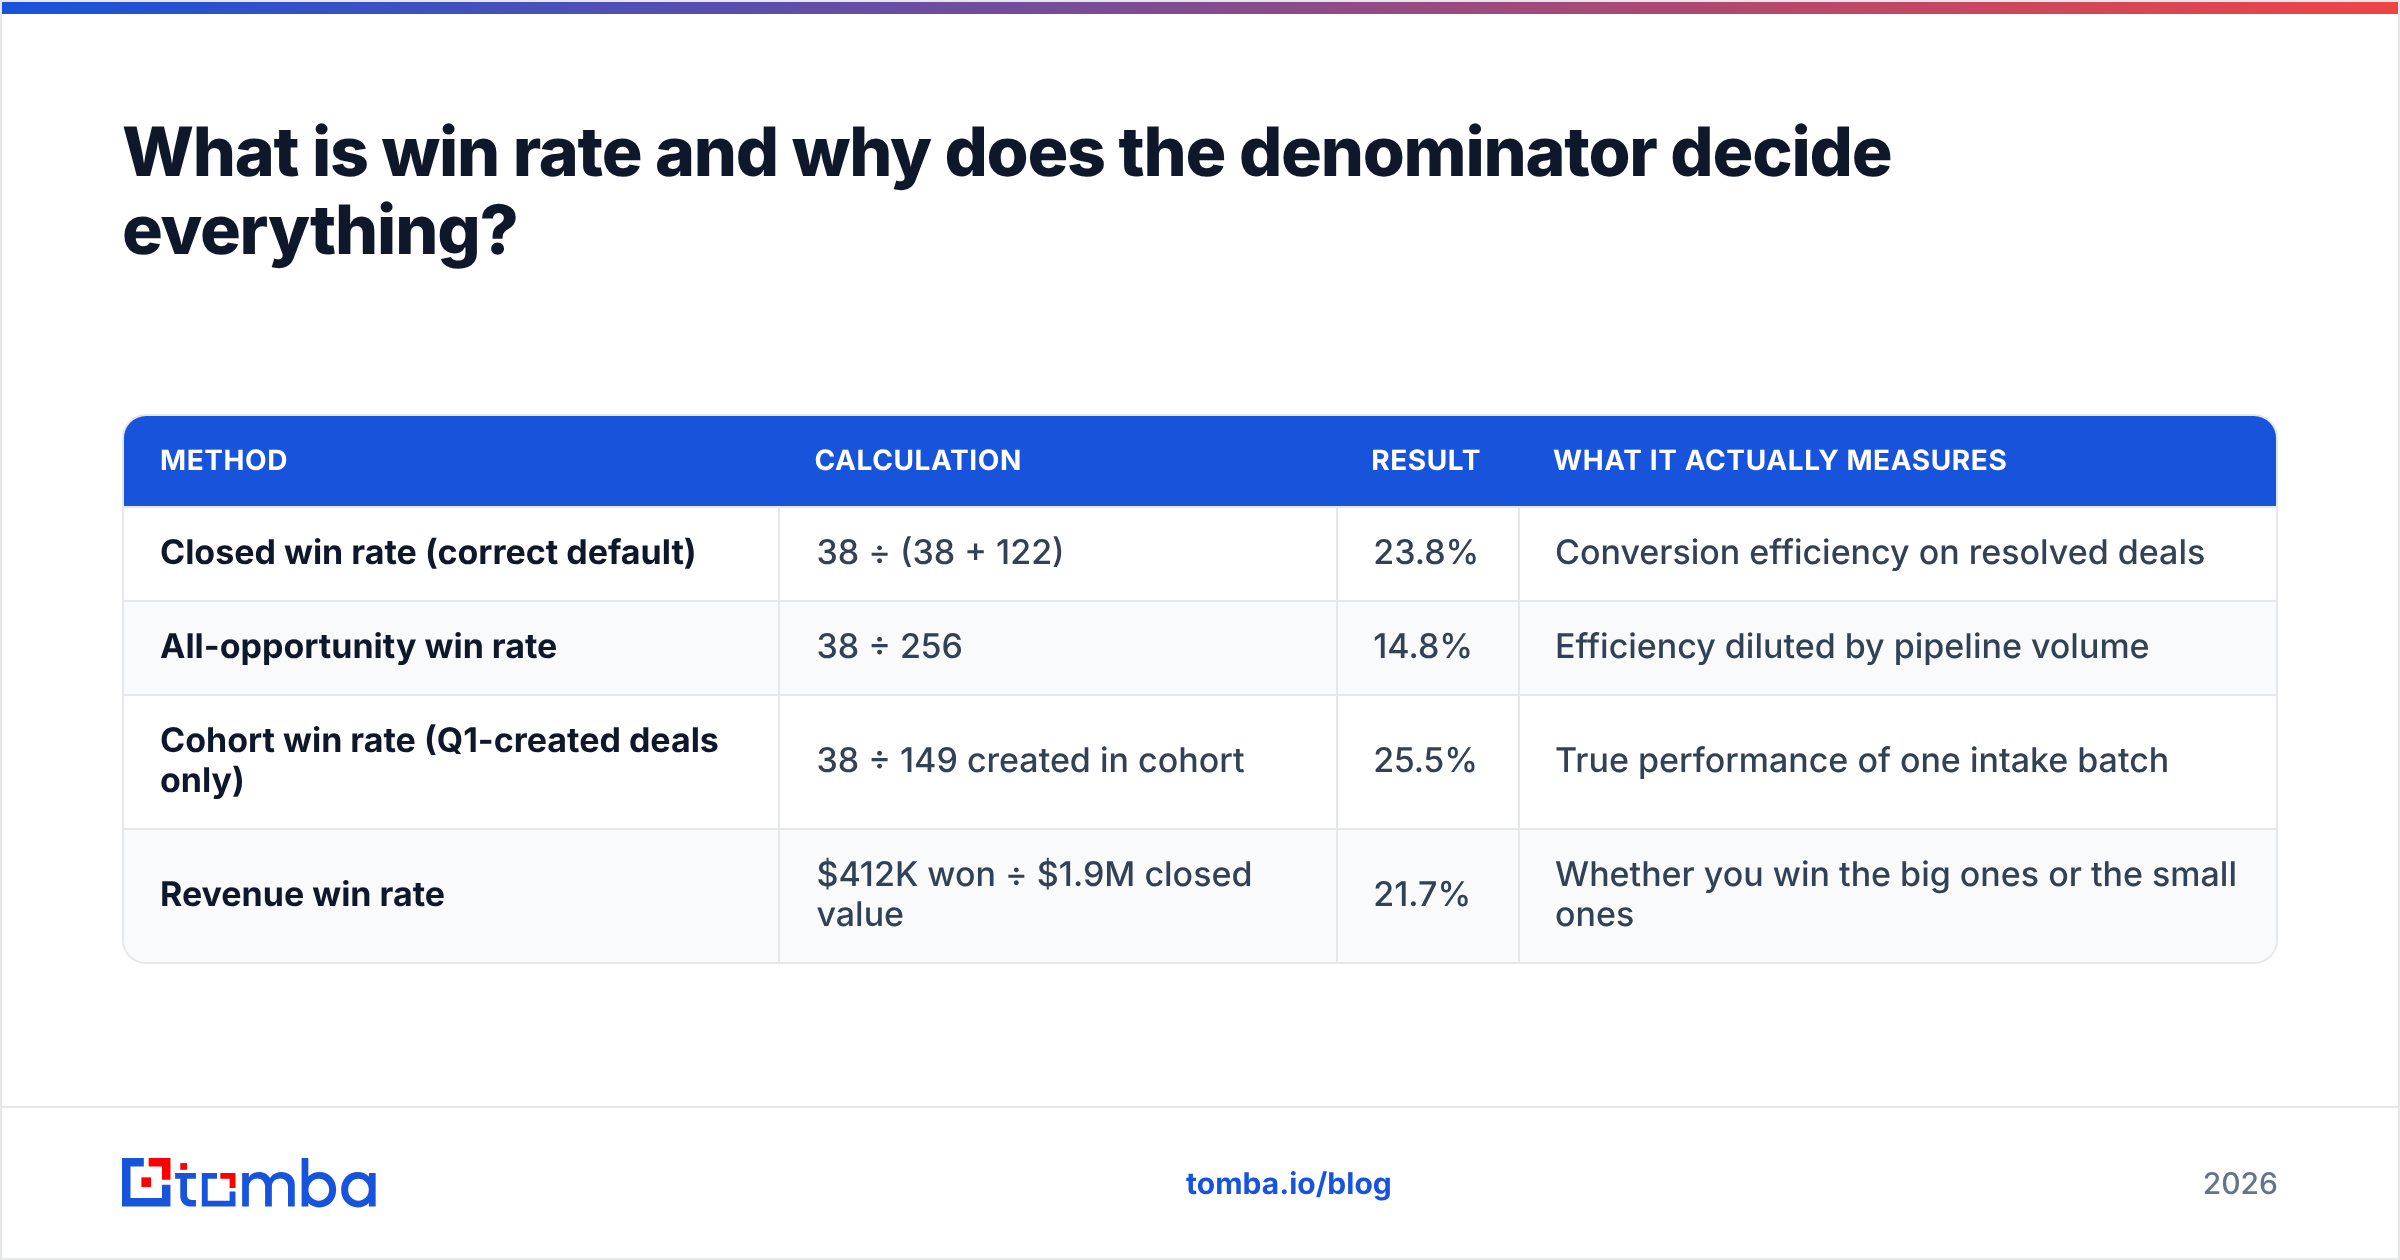
Here is the arithmetic with real numbers. A team closes a quarter with 38 won, 122 lost, and 96 still open.
| Method | Calculation | Result | What it actually measures |
|---|---|---|---|
| Closed win rate (correct default) | 38 ÷ (38 + 122) | 23.8% | Conversion efficiency on resolved deals |
| All-opportunity win rate | 38 ÷ 256 | 14.8% | Efficiency diluted by pipeline volume |
| Cohort win rate (Q1-created deals only) | 38 ÷ 149 created in cohort | 25.5% | True performance of one intake batch |
| Revenue win rate | $412K won ÷ $1.9M closed value | 21.7% | Whether you win the big ones or the small ones |
Four numbers, one quarter, a 10.7-point spread. That spread is why "our win rate is 15%" is a meaningless sentence without the formula attached.
Which win rate formula should you use?#
Use all three, for different jobs. Just label them.
Closed win rate — your default board metric. Won ÷ (won + lost). Fast to compute, updates weekly, comparable across teams. The weakness: it lags, because a deal created in January might not resolve until June.
Cohort win rate — the honest one. Take every opportunity created in a fixed window, wait until 95% of them resolve, then measure. This is the only variant that tells you whether a change you made in March actually worked. The weakness: you need a full sales-cycle-plus buffer before the number is trustworthy.
Revenue-weighted win rate — won ACV ÷ total closed ACV. Two teams can post identical 22% deal win rates while one lands $40K contracts and the other lands $6K ones. Revenue weighting exposes that instantly.
Stage-to-stage conversion — technically not a win rate, but the diagnostic that makes win rate actionable. If your overall rate dropped from 24% to 18%, stage conversion tells you whether the leak is at discovery, at demo, or at procurement.
Segment-split win rate — the same formula run separately for inbound vs outbound, SMB vs enterprise, new logo vs expansion. A blended company win rate is an average of populations that behave nothing alike, and averages of unlike things are lies.
The practical rule: report closed win rate to executives, cohort win rate to whoever owns process changes, and revenue win rate to finance. Never let two of them share a y-axis.
What is a good win rate in 2026?#
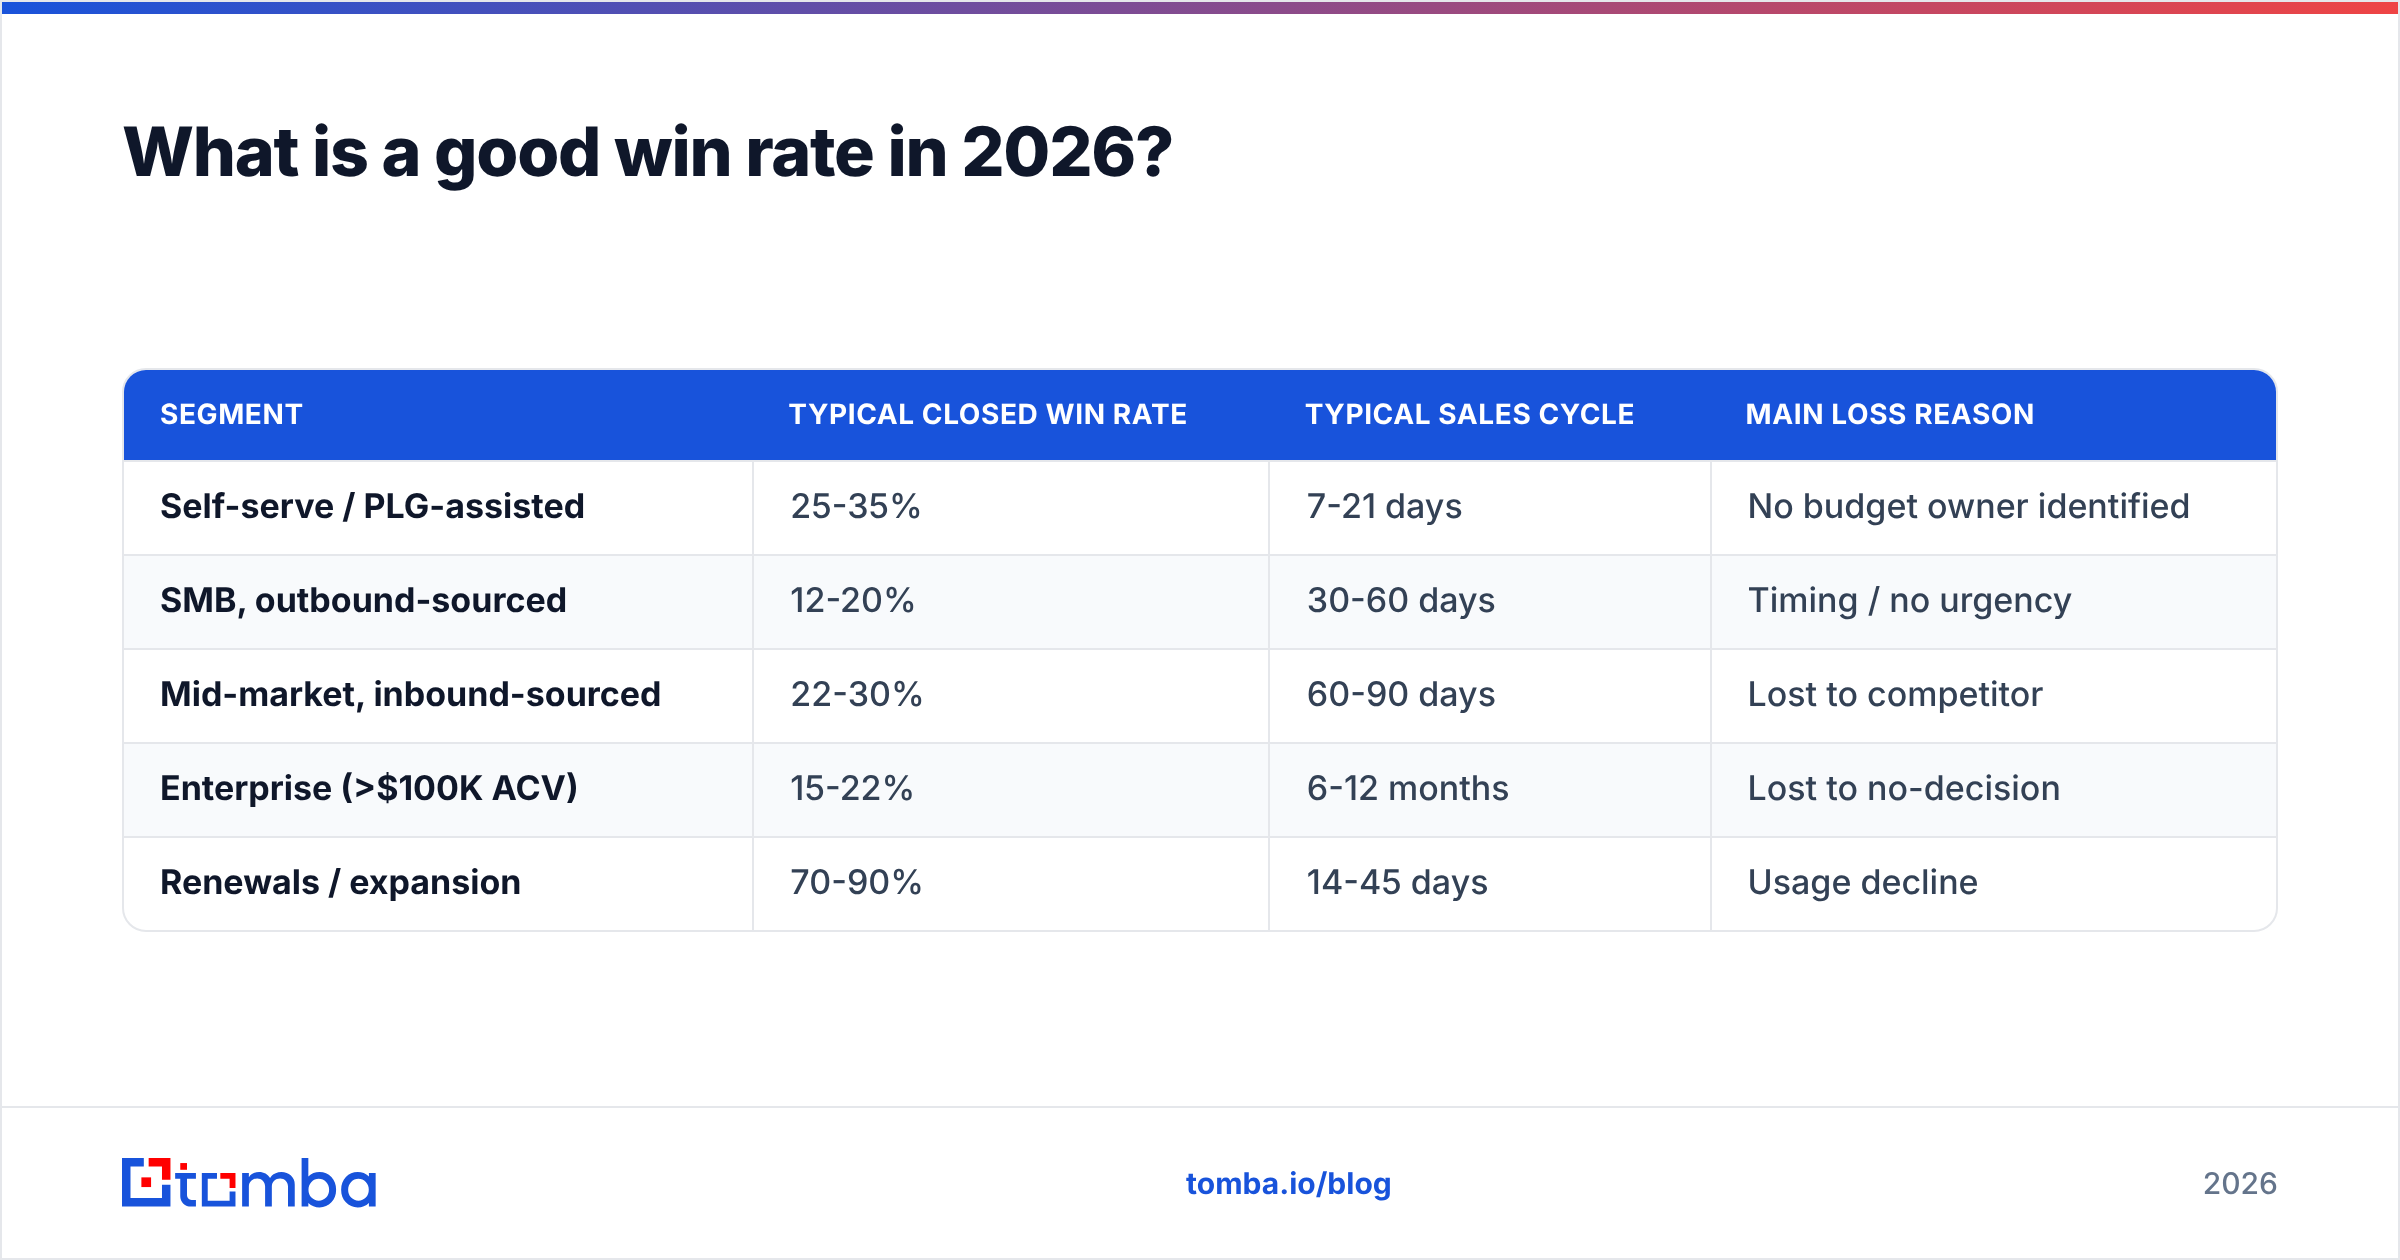
Depends almost entirely on deal size and lead source, and the honest answer is that public benchmarks vary widely by methodology. Directional ranges that hold up across most B2B software teams:
| Segment | Typical closed win rate | Typical sales cycle | Main loss reason |
|---|---|---|---|
| Self-serve / PLG-assisted | 25-35% | 7-21 days | No budget owner identified |
| SMB, outbound-sourced | 12-20% | 30-60 days | Timing / no urgency |
| Mid-market, inbound-sourced | 22-30% | 60-90 days | Lost to competitor |
| Enterprise (>$100K ACV) | 15-22% | 6-12 months | Lost to no-decision |
| Renewals / expansion | 70-90% | 14-45 days | Usage decline |
Two things fall out of that table.
First, inbound beats outbound on win rate more or less universally — because the buyer self-selected. If your outbound win rate is higher than inbound, your inbound qualification is broken, not your outbound genius.
Second, "lost to no-decision" dominates enterprise. Gartner's research on B2B buying has repeatedly found that the status quo is the most common competitor, not a rival vendor. That reframes the fix: you do not beat no-decision with a feature battle card, you beat it with a cost-of-inaction case.
And be suspicious of a very high number. A 45% company-wide win rate on outbound-sourced pipeline almost always means reps are only creating opportunities they already know they will win — sandbagging the denominator. Your win rate looks great while total revenue flatlines.
How do you calculate win rate step by step?#
Six steps. Do them in order; skipping step one poisons everything downstream.
Step 1 — Write down what an opportunity is. One sentence, in the CRM field help text, agreed by sales and RevOps. Something like: "An opportunity exists when a decision-influencer has confirmed a business problem and agreed to a next meeting." If reps interpret this differently, your win rate is comparing different things across territories.
Step 2 — Pick your window. Closed win rate uses close date. Cohort uses created date. Mixing them (deals closed this quarter ÷ deals created this quarter) produces a number that can exceed 100% and regularly does in badly-built dashboards.
Step 3 — Exclude the junk. Duplicates, test records, deals disqualified within 48 hours of creation, and opportunities on contacts that bounced. That last category is bigger than most teams expect — see the next section.
Step 4 — Run the formula. Won ÷ (won + lost) × 100. Round to one decimal. Anything more precise is false confidence.
Step 5 — Split it. By source, by segment, by rep tenure band, by product line. A single blended figure hides every actionable insight it contains.
Step 6 — Attach loss reasons. A win rate without a reason distribution is a thermometer with no diagnosis. Make the loss-reason field required on close, keep the picklist under eight options, and audit it monthly for "Other" abuse.
If you run this in a spreadsheet before the CRM report exists, the formula in Google Sheets is =COUNTIF(Status,"Won")/(COUNTIF(Status,"Won")+COUNTIF(Status,"Lost")). Format as percent. Many teams pull the raw list into Google Sheets alongside contact data and calculate there while the reporting layer catches up.
Why does bad contact data destroy your win rate math?#
Because it corrupts both the numerator's ceiling and the denominator's honesty.
Trace the chain. A rep works a list where 22% of the email addresses are stale. Those emails bounce or go nowhere. The rep, under activity quota, logs the outreach anyway and — in a lot of orgs — creates an opportunity off a soft signal to keep pipeline coverage looking healthy. Three weeks later it dies as "no response."
You now have a denominator inflated with deals that never had a live human on the other end. Your win rate drops. Leadership responds by coaching discovery calls. But discovery was never the problem; the contact was never reachable.
The measurable version of this: bounce rate correlates tightly with junk opportunities. Teams that run every list through an email verifier before sequencing typically see fewer opportunities created and a higher win rate — same revenue, cleaner denominator, better decisions.
Three data hygiene moves that move win rate without touching sales technique:
- Verify before you sequence. A validated address means a real inbox, which means the non-reply is a genuine signal about interest rather than a delivery failure. Sender reputation compounds here too — see how email deliverability interacts with reply rates.
- Enrich before you qualify. Knowing headcount, tech stack, and funding stage before the first call lets reps disqualify early. Early disqualification keeps the denominator clean; late disqualification pollutes it.
- Find the actual decision-maker, not the first name you found. A deal worked against a non-buyer is a structurally unwinnable deal that still counts as a loss. Using a proper email finder to reach the economic buyer directly is a win-rate intervention disguised as a prospecting tactic.

How do you improve win rate once you can measure it?#
Start with the losses you should never have started.
Kill deals faster. The single highest-leverage change most teams can make is a hard disqualification gate at day 14. If there is no confirmed budget owner, no articulated problem, and no next step on the calendar, close it as disqualified — not as lost. Disqualified deals leave the denominator; lost deals stay in it. This is not gaming the metric, provided the rule is written down and applied uniformly. It is what the metric was always supposed to measure.
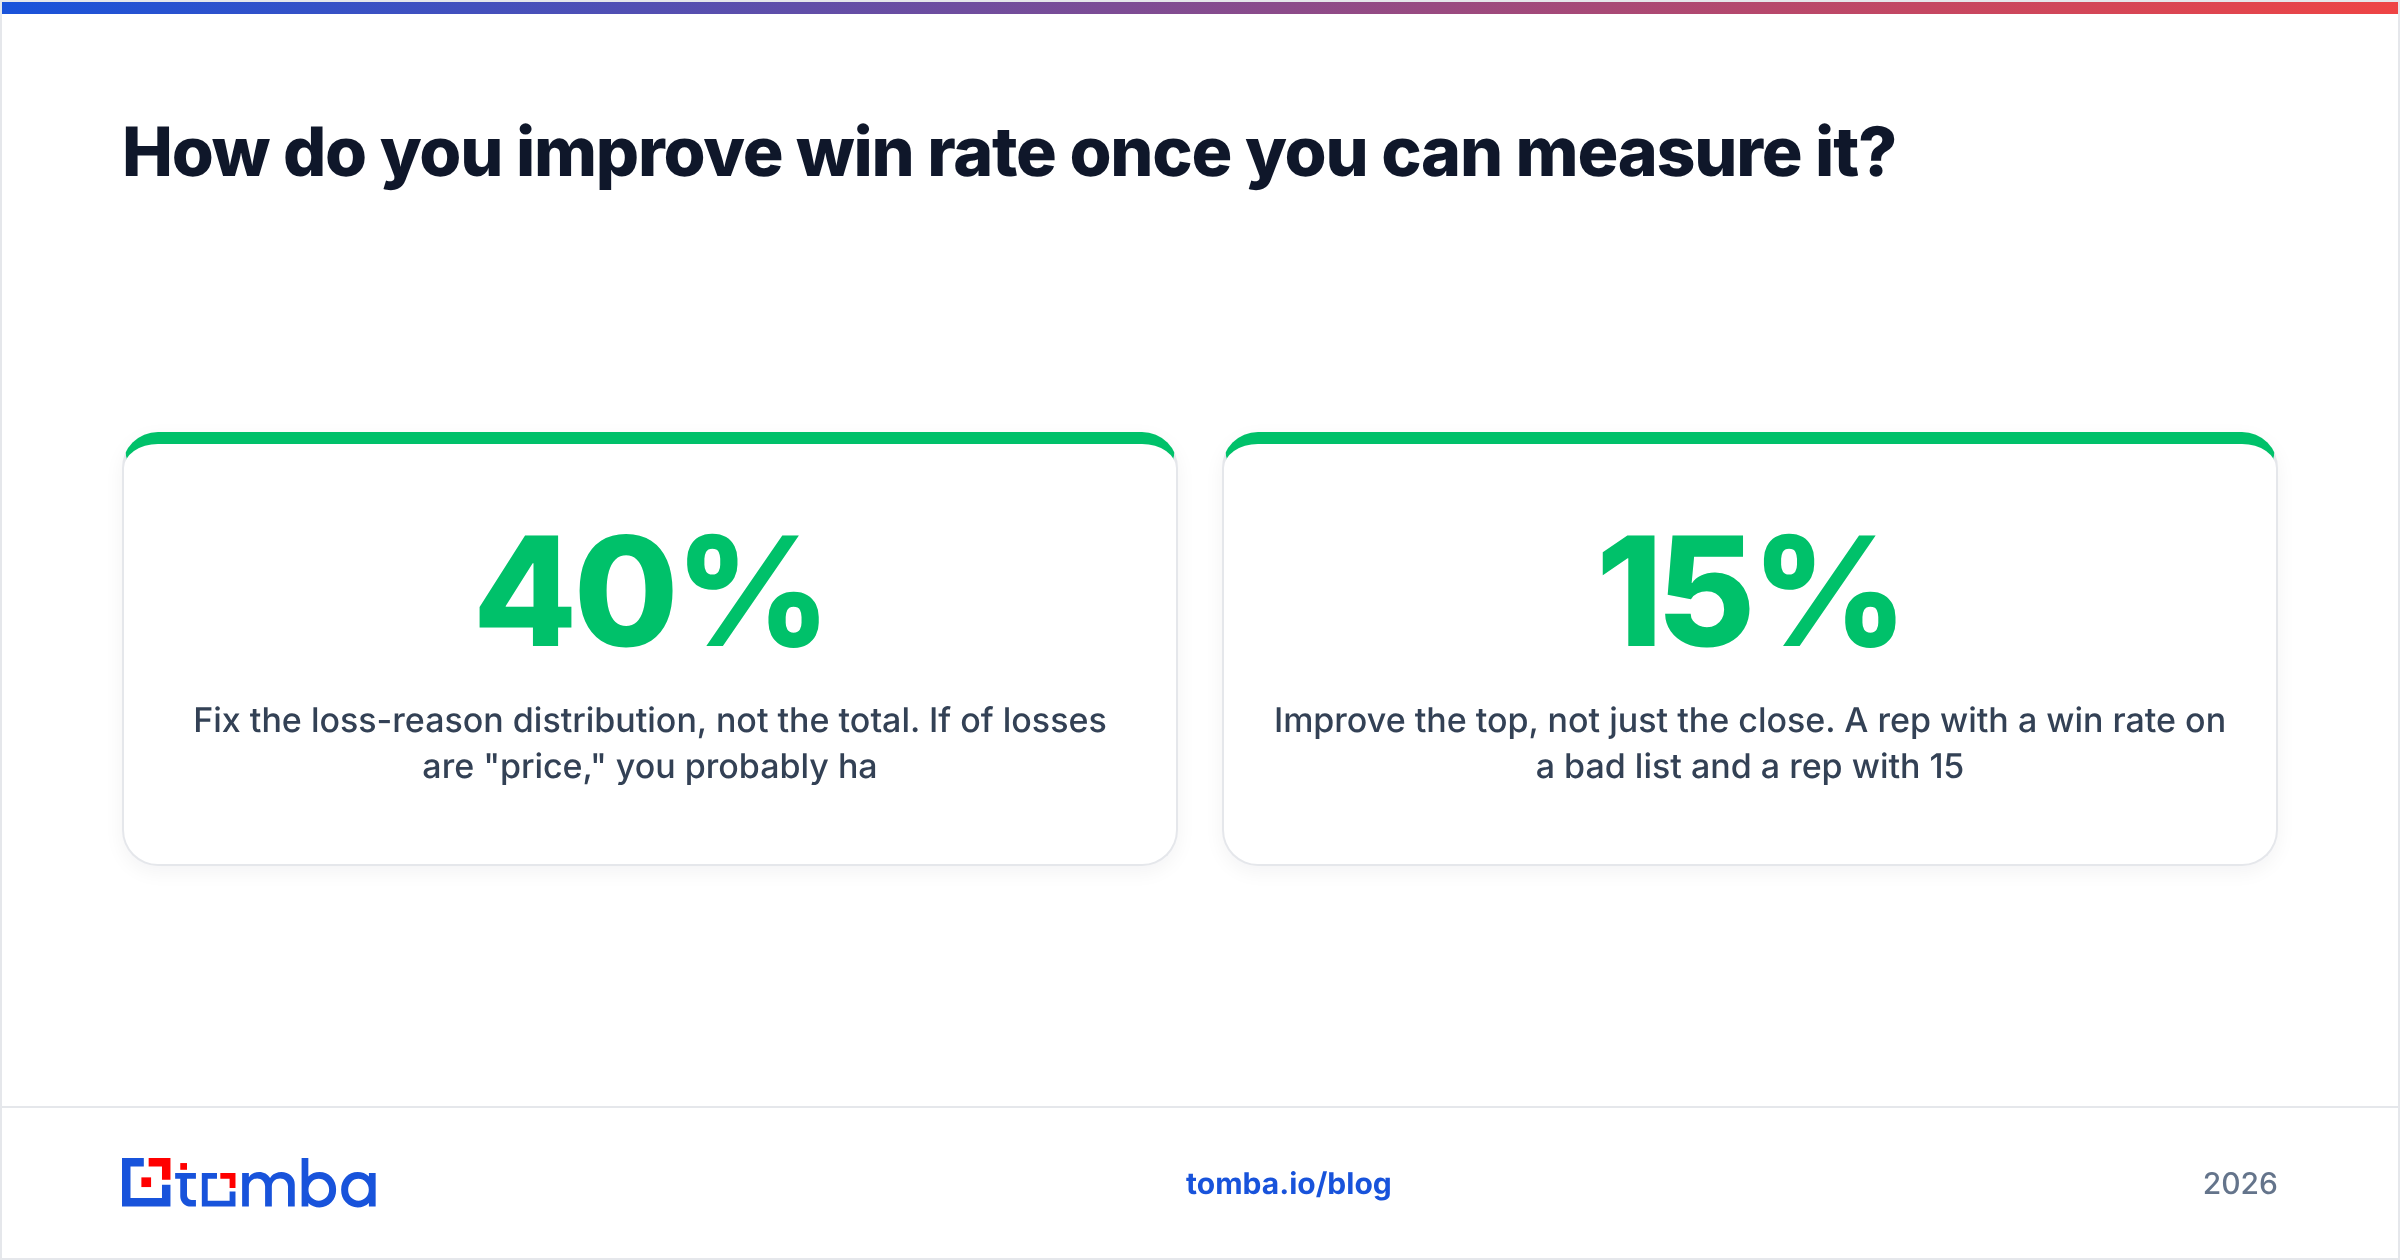
Fix the loss-reason distribution, not the total. If 40% of losses are "price," you probably have a value-articulation problem or a targeting problem, not a pricing problem. If 40% are "no decision," you have an urgency problem. If 40% are "lost to competitor," pull the competitor names and check whether you are losing to one specific rival — that is a battle card gap, and it is fixable in two weeks.
Compress the cycle. Win rate and cycle length move together. Deals that stall die. HubSpot's sales research and most CRM vendors' own benchmark reports converge on the same finding: the probability of closing declines sharply after a deal exceeds roughly 1.5× your median cycle. Build an alert at that threshold.
Improve the top, not just the close. A rep with a 15% win rate on a bad list and a rep with 15% on a great list are not equally skilled. Before running a sales-technique intervention, check whether the source data changed. Pulling contacts from a verified B2B database rather than a scraped list changes win rate by more than most enablement programs do.
Instrument the handoff. Where SDR-created opportunities convert far worse than AE-created ones, the problem is usually the acceptance criteria between the two roles, not either role's ability. Track win rate by opportunity creator and the gap becomes obvious in a single chart.
How should you report win rate to leadership?#
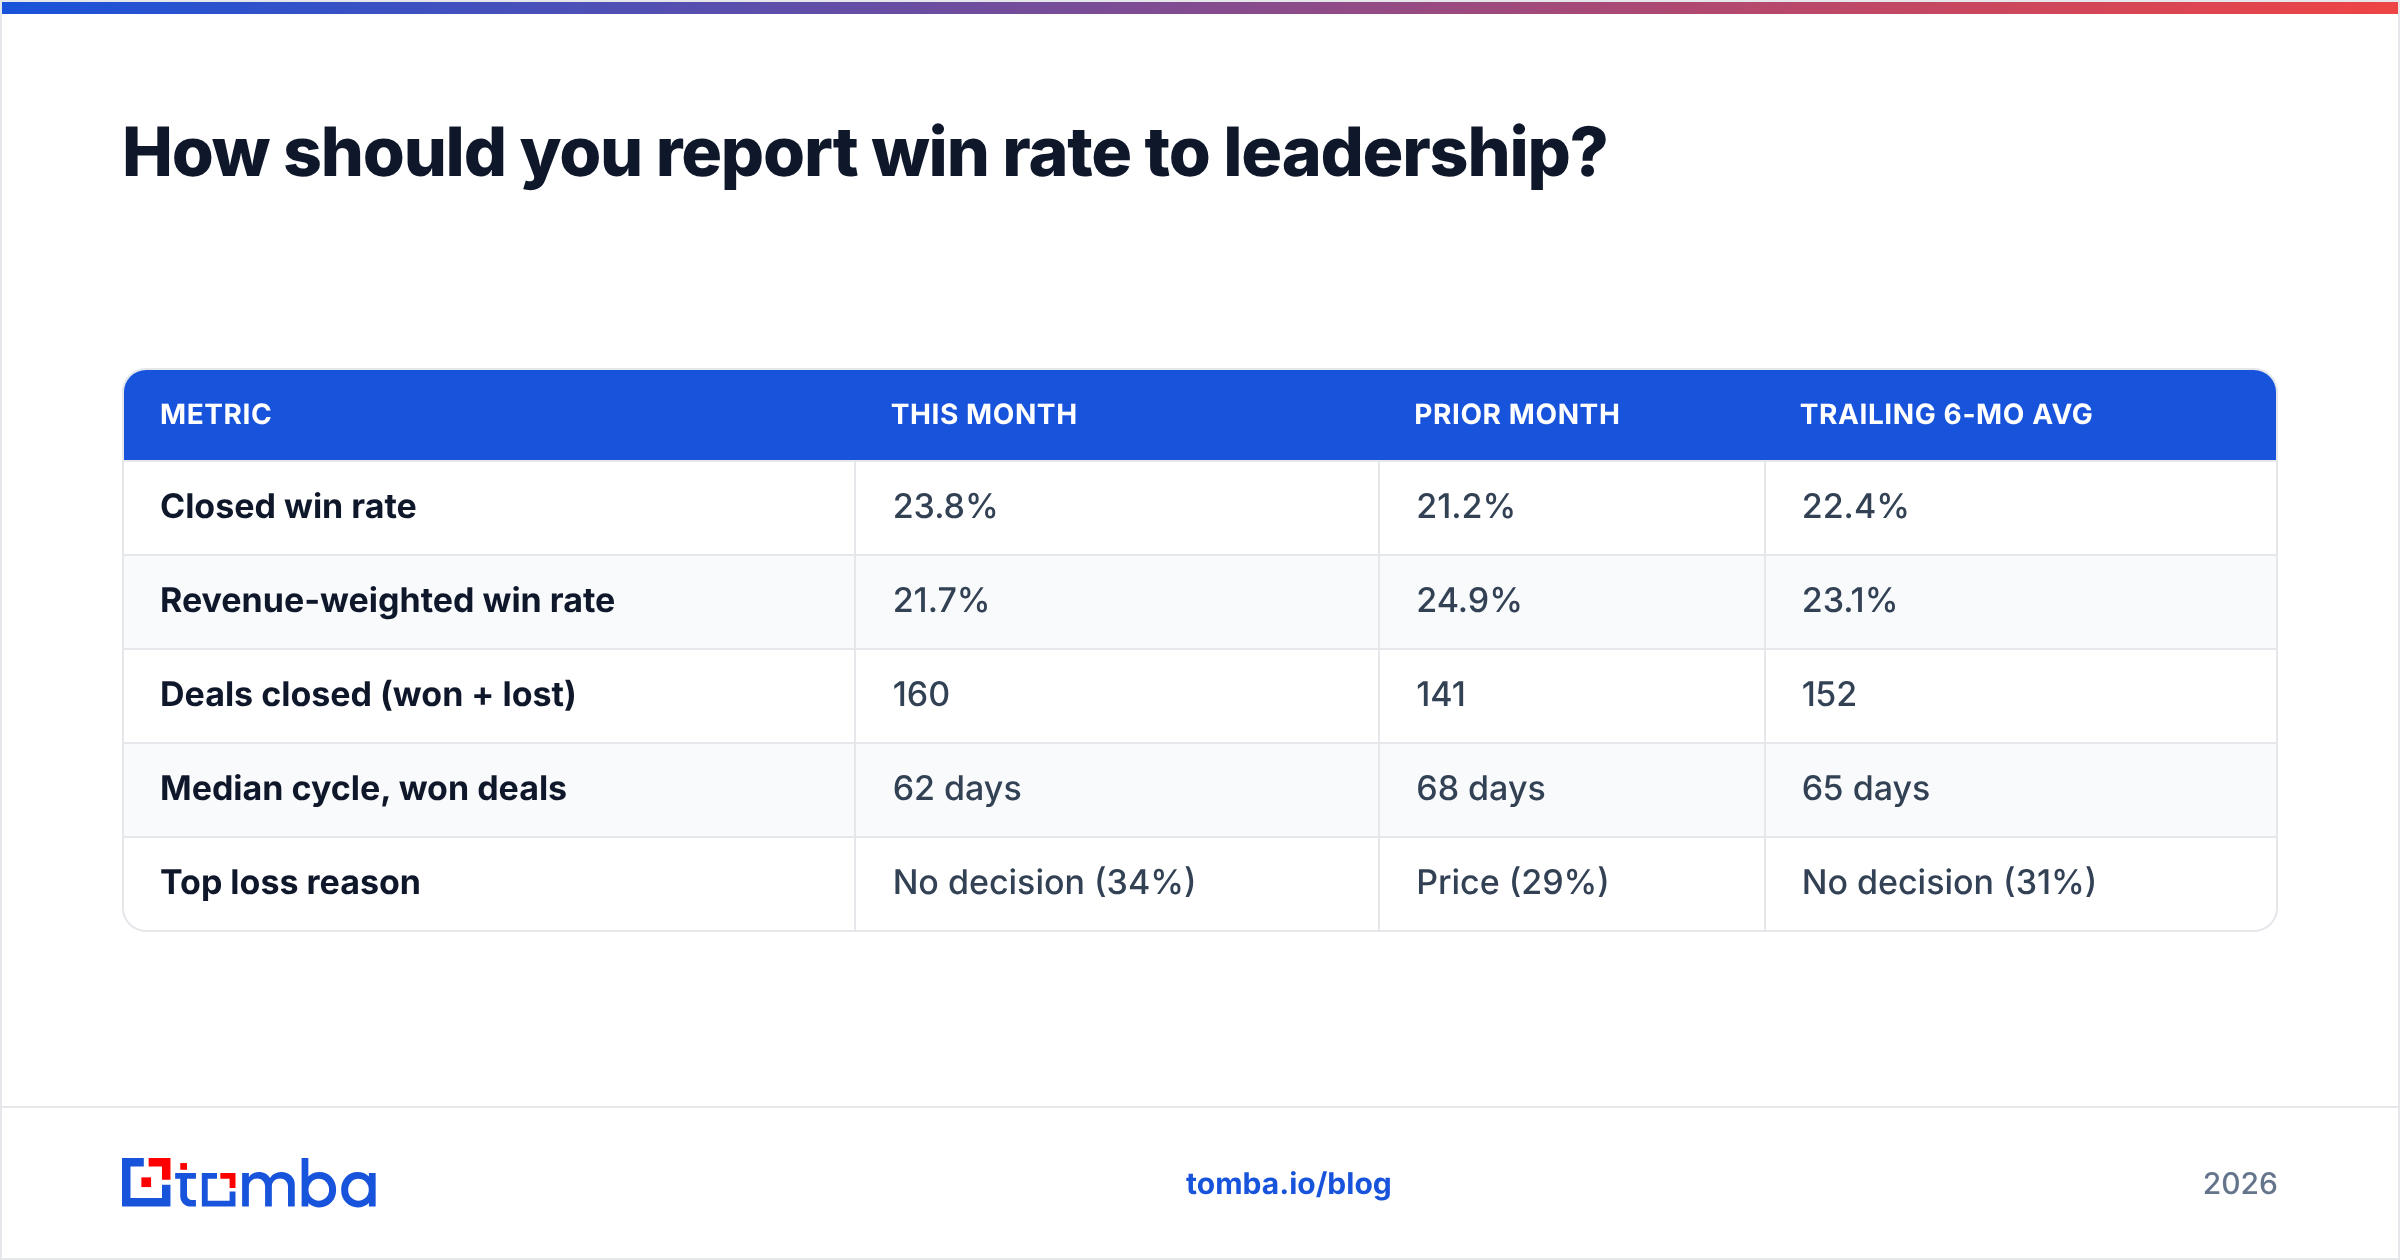
Keep it boring and consistent. A useful monthly view has five lines:
| Metric | This month | Prior month | Trailing 6-mo avg |
|---|---|---|---|
| Closed win rate | 23.8% | 21.2% | 22.4% |
| Revenue-weighted win rate | 21.7% | 24.9% | 23.1% |
| Deals closed (won + lost) | 160 | 141 | 152 |
| Median cycle, won deals | 62 days | 68 days | 65 days |
| Top loss reason | No decision (34%) | Price (29%) | No decision (31%) |
The divergence between deal win rate and revenue win rate in that example is the story: the team won more deals but smaller ones. A single-line report would have shown 23.8% and been read as good news.
Two reporting disciplines worth enforcing. First, never restate history — if you change the opportunity definition, start a new series and annotate the chart, do not retroactively rebuild. Second, always publish the denominator next to the percentage. A 33% win rate on 6 closed deals is not a metric, it is an anecdote with a percent sign.
For definitions your whole team can reference, both win rate and response rate are worth pinning in a shared glossary so nobody recalculates from memory.
External sanity checks are useful too: G2's category data helps you see who you are actually losing to, and HubSpot's sales benchmark reports give a free reference point for cycle length by segment. Compare directionally, never literally — every vendor defines opportunity creation differently.
What should you do first?#
Audit your denominator this week. Pull every opportunity closed in the last two quarters, and sort losses by days-open. If a meaningful share died in under 14 days with no meeting held, those were never opportunities — they were tasks. Tighten the creation rule, and your win rate will jump without a single change to how anyone sells.
Then fix the input layer. Most of those phantom opportunities trace back to contact data that was wrong on arrival: a stale address, a person who left 14 months ago, a generic info@ inbox nobody reads. Tomba's Email Finder gets you verified, current addresses for the specific decision-makers on your target accounts, so the opportunities your reps create start with a real human who can actually say yes. The free tier covers 25 searches a month if you want to test it against a sample list before committing; paid plans start at $49/mo on Starter, with Growth at $99/mo — full Tomba pricing is public. Clean the inputs, then trust the number.
Related guides#
Ready to find emails that actually work?
Join 150,000+ professionals who stopped guessing and started sending. Free credits on signup — no credit card required.
Get the Tomba newsletter
Practical outbound tactics and product updates — once every two weeks.
About the author