How To Evaluate Sales Performance: A 2026 Metrics Playbook
Quota attainment alone hides more than it reveals. Here is a practical 6-step framework for evaluating sales performance using activity, pipeline, and outcome metrics that actually predict next quarter.
TL;DR
- Quota attainment is a scoreboard, not a diagnosis. It tells you who hit the number, never why — so it can't tell you what to fix.
- Evaluate three layers in order: outcome metrics (revenue, win rate), pipeline metrics (coverage, velocity, stage conversion), and activity metrics (calls, emails, meetings booked). Each layer explains the one above it.
- Weight the scorecard by role and segment. An SMB AE running 40 deals a quarter and an enterprise AE running 6 cannot share a rubric.
- Normalize for territory and data quality before you rank anyone. A rep working a list with 30% bounced emails is not underperforming — the data is.
- Run the review on a fixed cadence: weekly pipeline, monthly leading indicators, quarterly full scorecard, annual comp and territory reset.
Why does quota attainment fail as a performance measure?#
Because it's a lagging indicator with a long fuse. If your average sales cycle is 90 days, this quarter's attainment mostly reflects work done last quarter — by which point the coaching window has closed.
Think of it like grading a chef only on the restaurant's monthly revenue. Useful signal, terrible feedback loop. You learn nothing about knife skills, prep timing, or whether the supplier shipped bad produce.
Attainment also hides four common distortions:
- Territory inequality. Two reps at 85% attainment can be separated entirely by account list quality, not skill.
- Deal-size skew. One whale closes and a mediocre quarter looks excellent. Median deal size and deal count tell the truer story.
- Timing games. Pull-forward discounting in week 12 inflates Q3 and starves Q4. Attainment rewards it; margin analysis catches it.
- Data debt. If CRM hygiene is poor, stage data is fiction, and everything downstream of it is fiction too.
The fix is not "more metrics." It's layered metrics, where each layer explains the layer above.
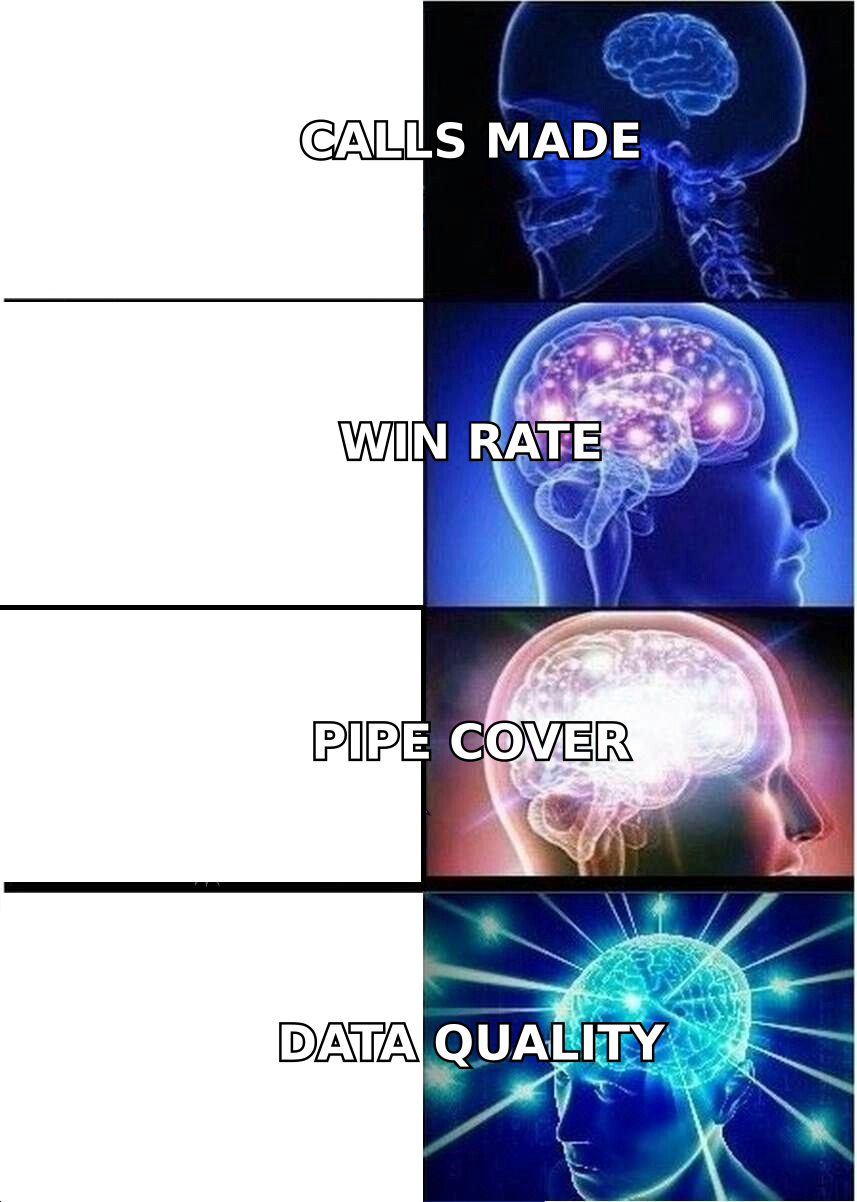
What are the three layers of sales performance metrics?#
Every metric you'd want falls into one of three layers. Evaluate top-down for accountability, bottom-up for coaching.
| Layer | What it measures | Example metrics | Lag | Best used for |
|---|---|---|---|---|
| Outcome | Did the number get hit? | Revenue, quota attainment, win rate, net revenue retention | 60–180 days | Comp, promotion, headcount planning |
| Pipeline | Is the number reachable? | Pipeline coverage, stage conversion, sales velocity, slippage rate | 15–60 days | Forecasting, deal inspection, territory review |
| Activity | Is the work happening? | Meetings booked, calls connected, response rate, sequence completion | 0–14 days | Weekly coaching, ramp tracking, onboarding |
| Input quality | Is the raw material any good? | Contact accuracy, bounce rate, ICP fit score, lead-to-MQL rate | 0–7 days | Diagnosing "effort without results" |
Most managers evaluate the top row and coach on the third. The second and fourth rows are where the actual explanations live.
The four questions a good evaluation answers#
- Is the rep producing? Outcome layer. Revenue against quota, adjusted for territory potential.
- Will the rep produce next quarter? Pipeline layer. Coverage ratio and stage-conversion trend beat gut feel.
- Is the rep working effectively, or just working hard? Activity layer divided by outcomes — meetings per closed deal, touches per meeting.
- Is anything outside the rep's control suppressing results? Input-quality layer. Bad list data, broken routing, a product gap in one vertical.
If your review only answers question one, you're running a scoreboard, not an evaluation.
How do you build a sales performance scorecard?#
Six steps. Budget about a week for the first build and an hour per quarter to maintain it.
Step 1 — Define the role's success profile. Write down what "good" looks like for this role before you pick metrics. An SDR's job is qualified meetings; an enterprise AE's job is multi-threaded deal progression. Same company, different scorecards.
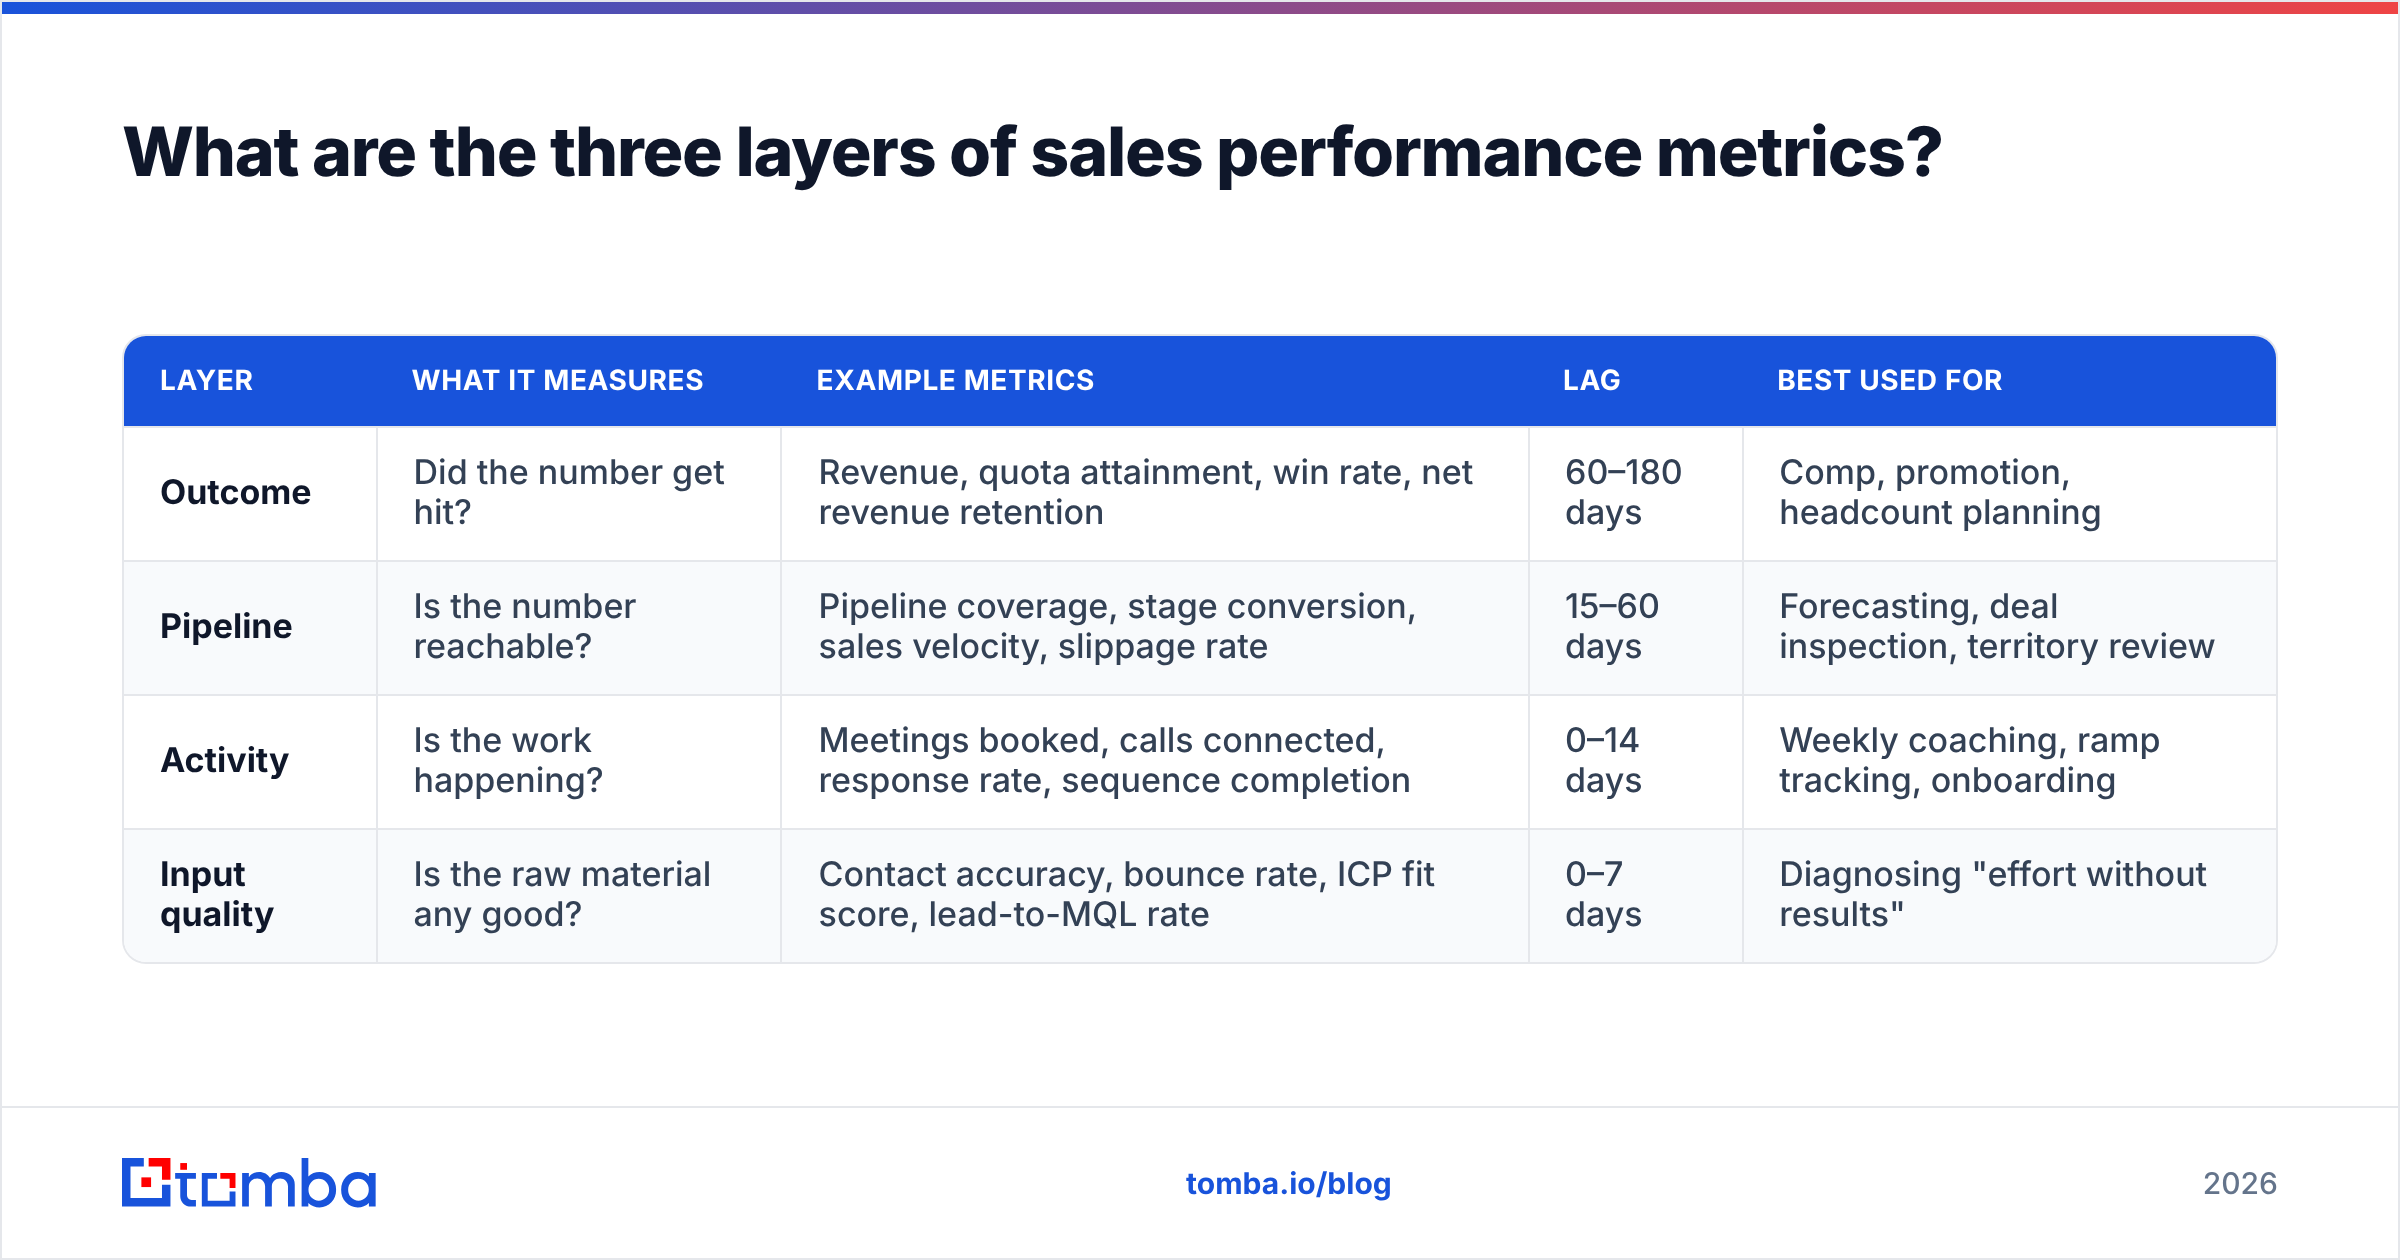
Step 2 — Pick 6–9 metrics, no more. Two or three per layer. Beyond nine, weightings become arbitrary and reps optimize for whichever is easiest to game. A workable default for a mid-market AE:
| Metric | Weight | Target | Why it's on the list |
|---|---|---|---|
| Closed-won revenue | 30% | 100% of quota | The outcome that funds everything |
| Win rate (qualified → closed) | 15% | ≥ 22% | Separates deal skill from volume |
| Pipeline coverage (next quarter) | 15% | 3.0x–3.5x | Earliest reliable predictor of attainment |
| Average sales cycle | 10% | ≤ 68 days | Velocity compounds across the year |
| Meetings held per month | 10% | 16 | Effort floor, not a target to maximize |
| Multi-threading rate | 10% | ≥ 2.5 contacts/deal | Single-threaded deals stall at renewal |
| Forecast accuracy | 10% | ±10% | Trust metric; protects the whole org |
Step 3 — Normalize for territory. Score against territory potential, not a flat number. Total addressable accounts, average account revenue, and existing penetration in the patch. A rep at 90% in a picked-over territory may be outperforming a rep at 110% in greenfield.
Step 4 — Audit the input data before you audit the humans. Pull a random sample of 100 contacts per rep and check bounce rate, title accuracy, and duplicate rate. If bounce rate exceeds 5%, your activity metrics are measuring the database, not the rep. A quick pass through an email verifier on each rep's working list often explains a third of the "performance gap" before anyone opens a call recording.
Step 5 — Score, then rank within cohort. Compare enterprise AEs to enterprise AEs, new-logo to new-logo. Cross-segment ranking produces resentment and bad decisions.
Step 6 — Attach one coaching action per rep. A scorecard with no action is a report card. Each review ends with a single, specific behavior change and a date to re-check it.
Which metrics actually predict next quarter?#
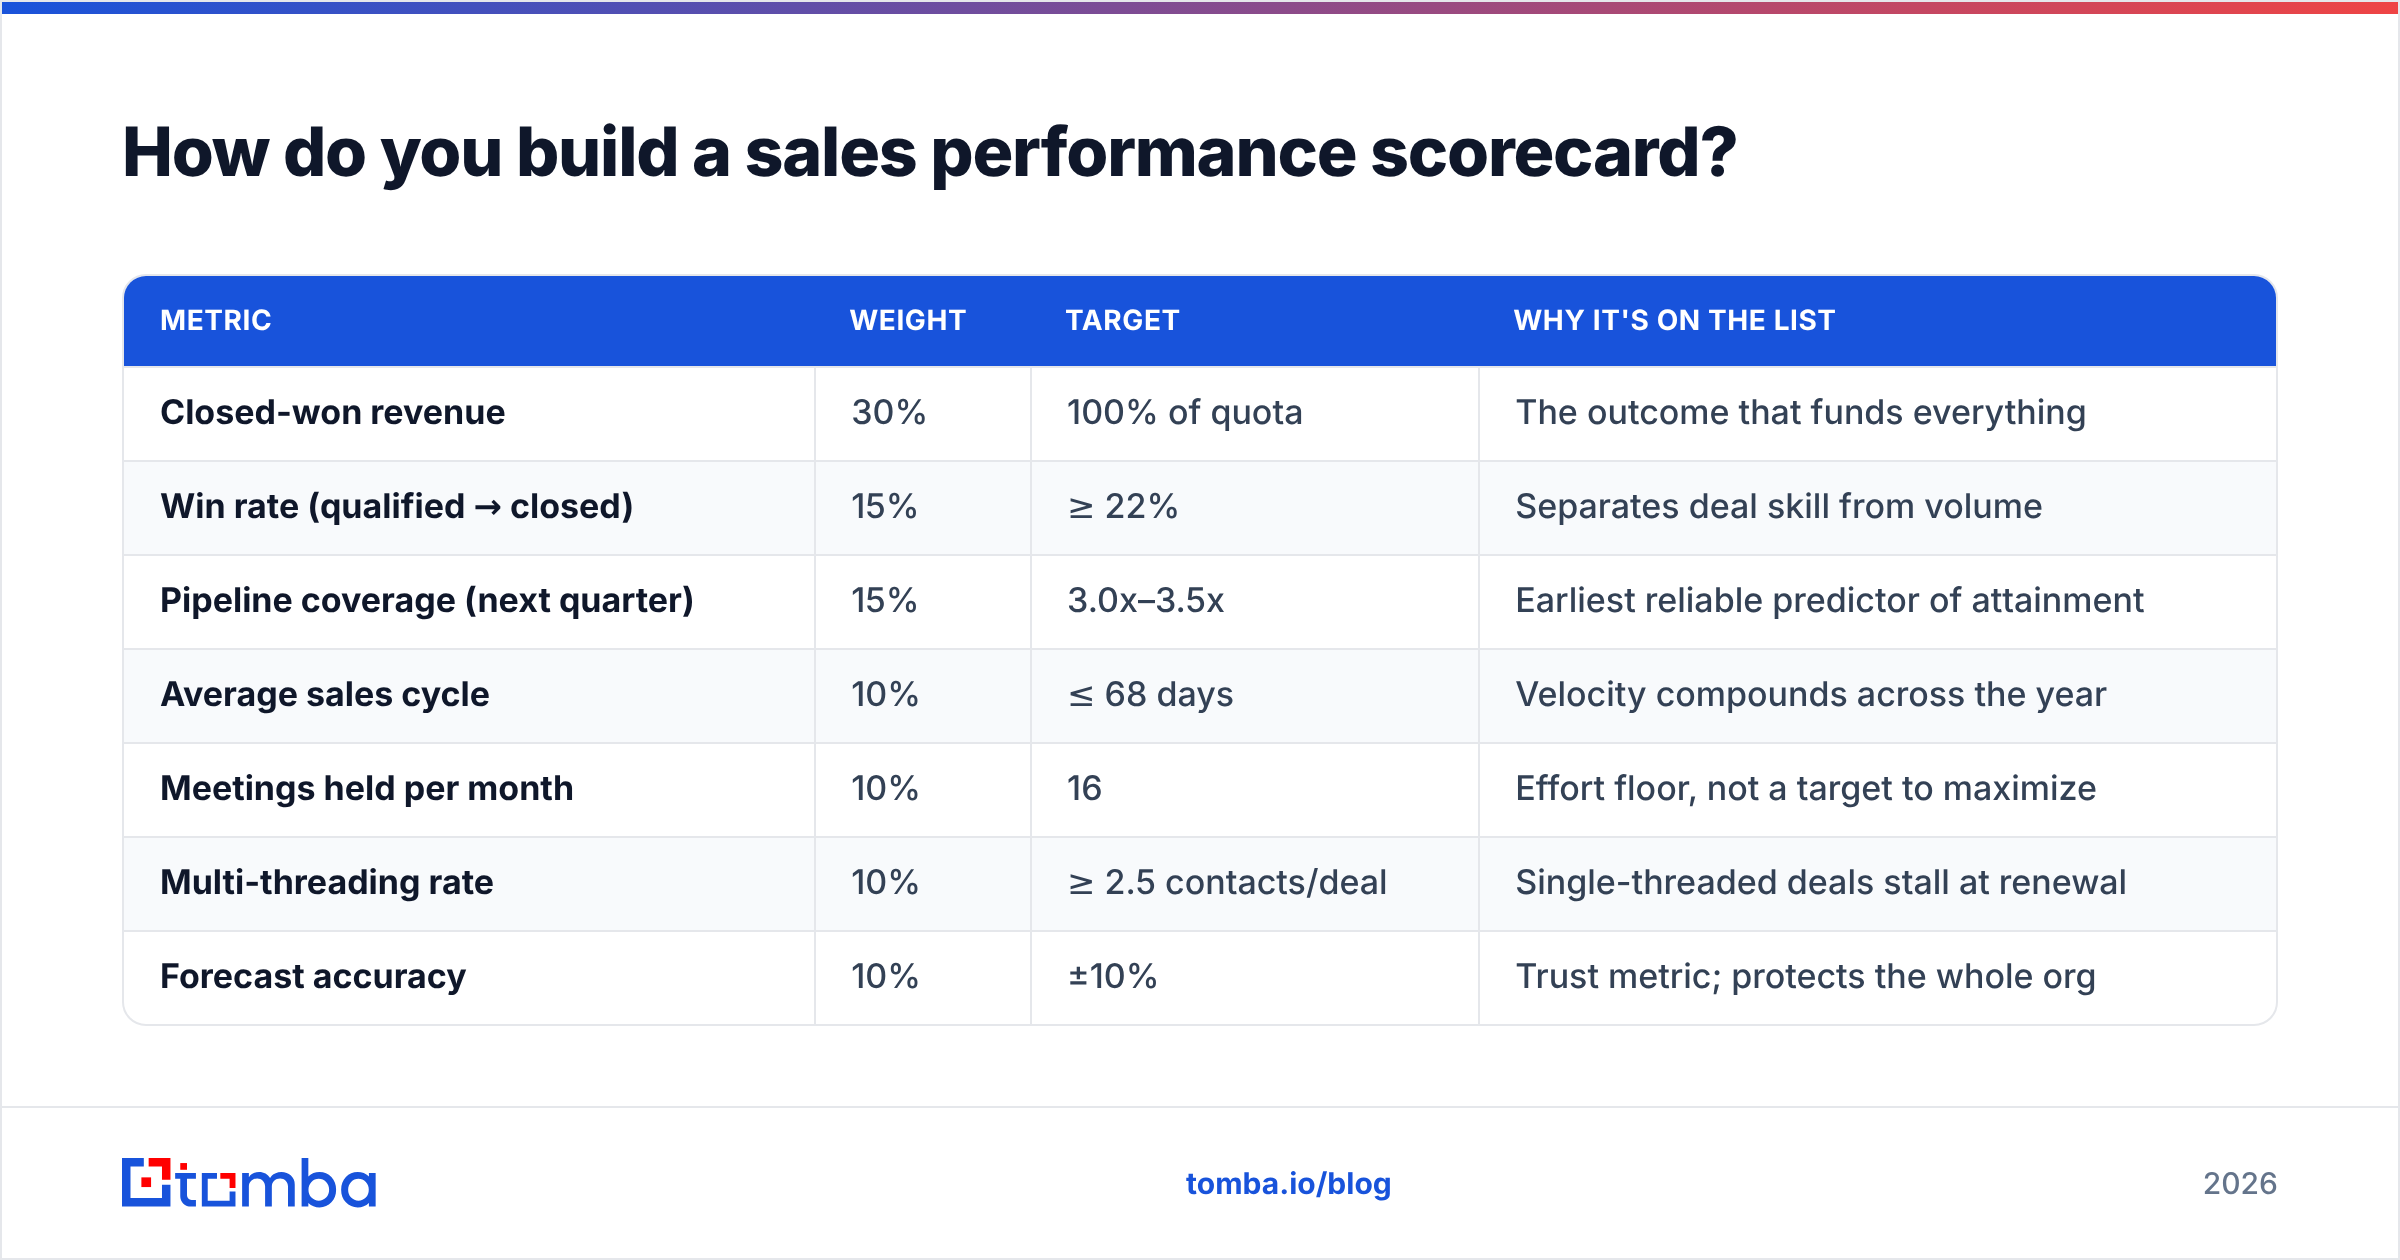
Pipeline coverage and stage-conversion trend, in that order — with a caveat on both.
Pipeline coverage is open pipeline divided by quota for the coming period. The classic 3x rule is a rough heuristic; the honest version is 1 / your historical win rate. If you close 25% of qualified pipeline, you need 4x. If you close 40%, 2.5x is plenty. Applying a borrowed 3x to a 15% win-rate team guarantees a miss.
Stage conversion trend is the percentage of deals moving from each stage to the next, tracked over rolling 90-day windows. A rep whose discovery→demo conversion drops from 60% to 40% has a qualification problem you can see two months before it shows up in revenue.
Two more that earn their place:
- Slippage rate. The share of deals that push their close date at least once. Above 35% and your forecast is decorative.
- Time to first meaningful response. From lead creation to a genuine two-way conversation. Salesforce and HubSpot both publish research on speed-to-lead effects; the direction is consistent even if the exact multipliers vary by market. HubSpot's sales statistics roundup is a reasonable starting point for benchmarks.
What doesn't predict much on its own: raw dial counts, emails sent, LinkedIn connection requests. These are inputs. They only become meaningful as ratios — dials per connect, emails per reply, connects per meeting.
How do you evaluate SDRs versus AEs versus account managers?#
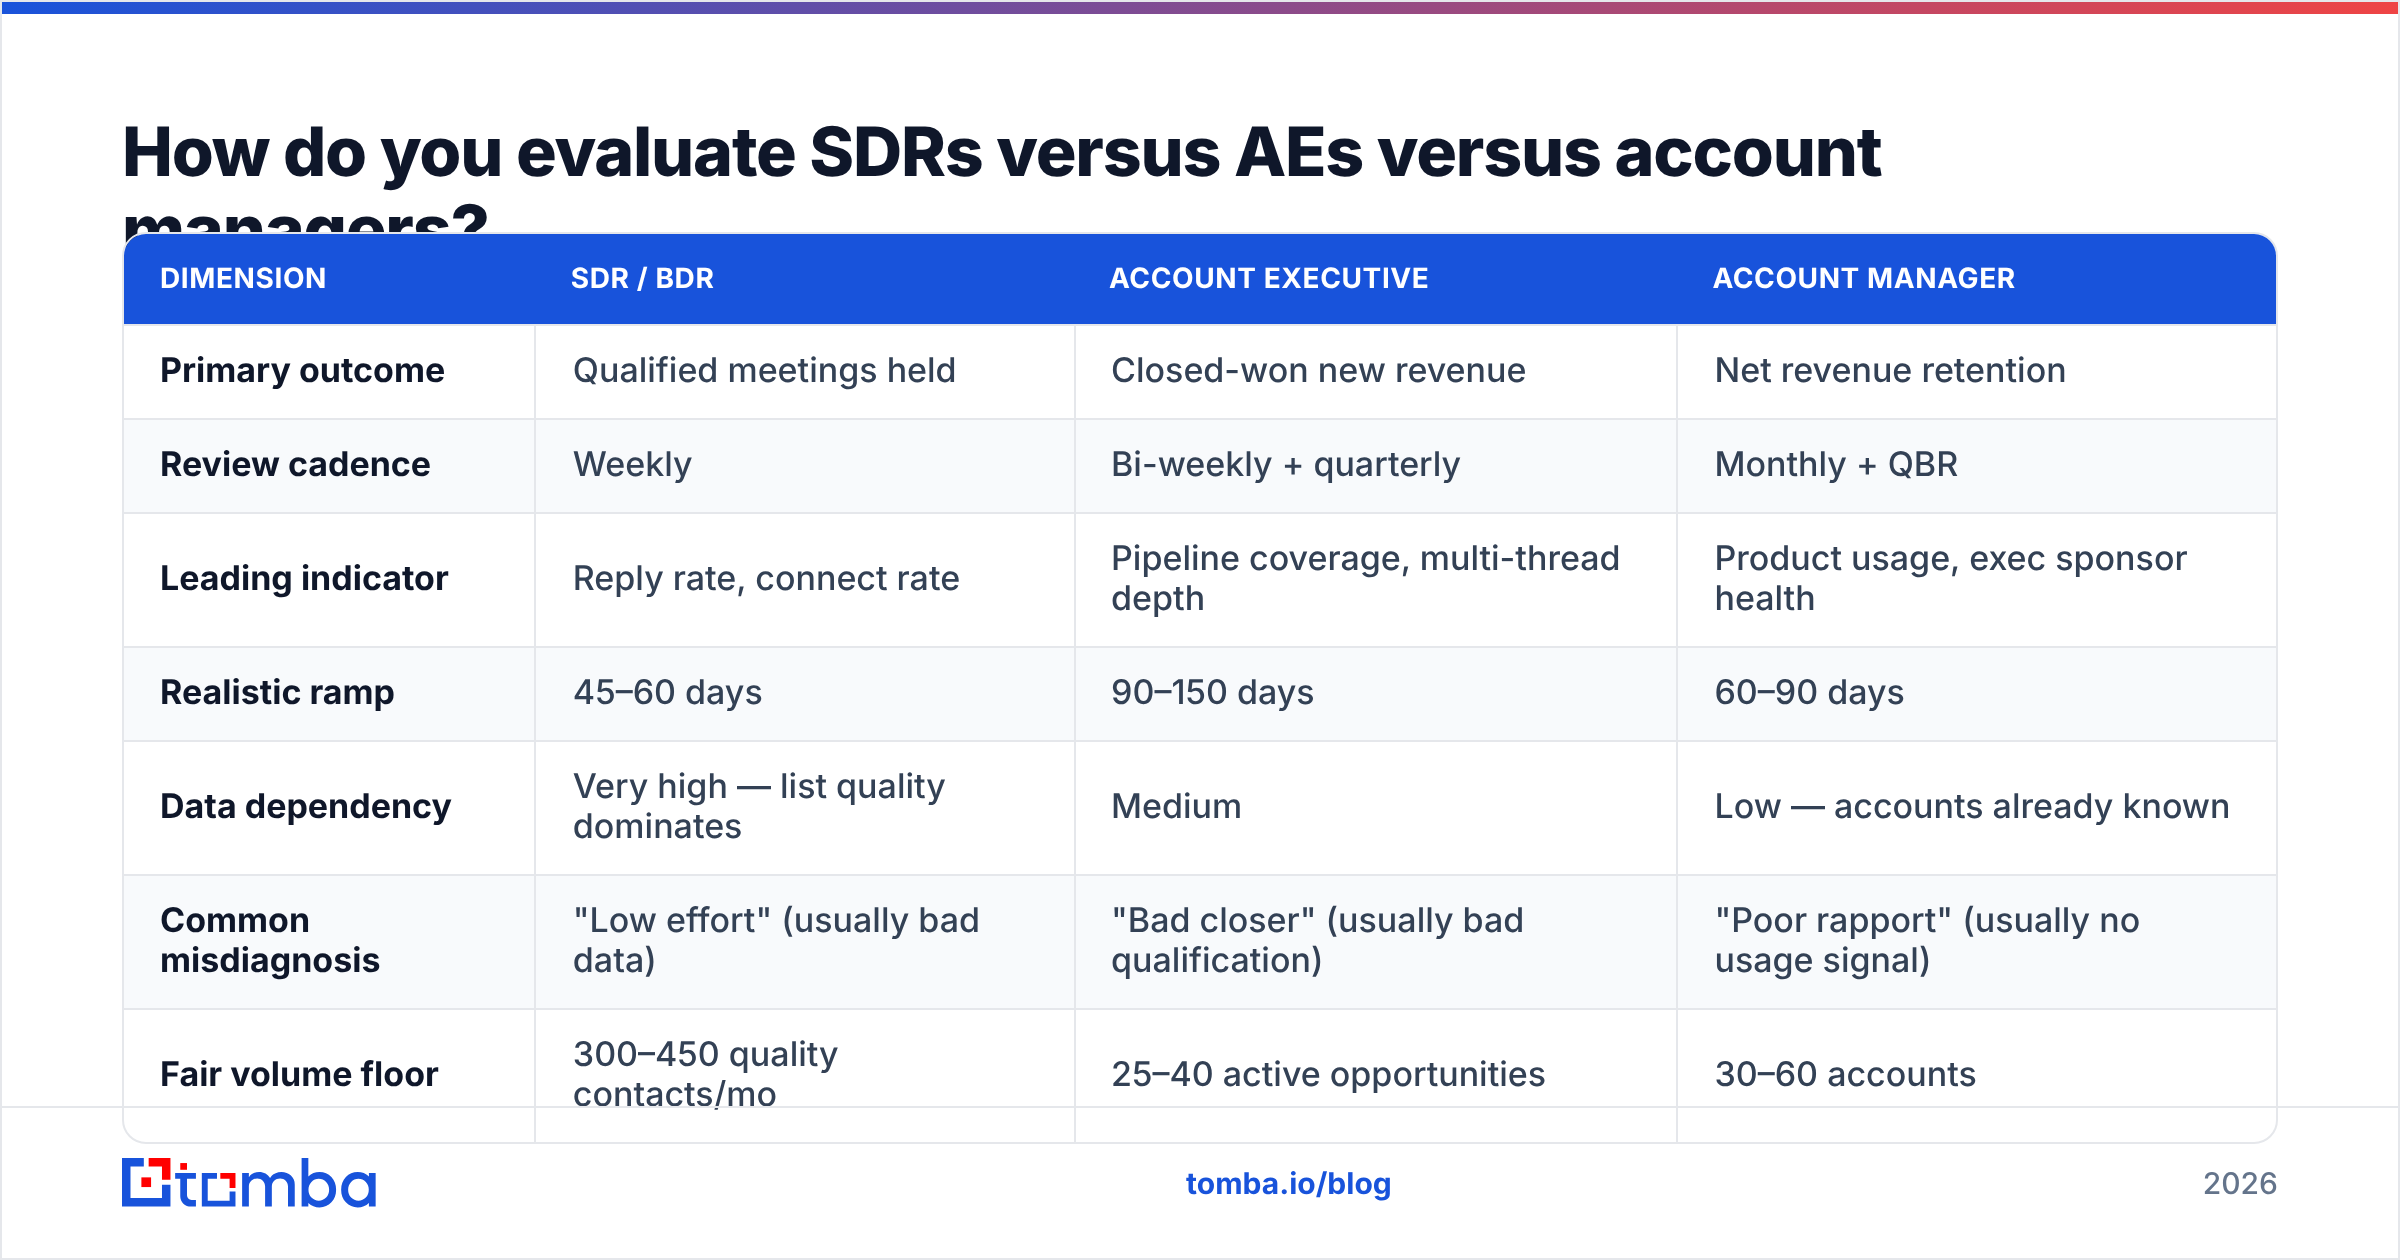
Different jobs, different physics. Using one rubric across all three is the single most common evaluation mistake.
| Dimension | SDR / BDR | Account Executive | Account Manager |
|---|---|---|---|
| Primary outcome | Qualified meetings held | Closed-won new revenue | Net revenue retention |
| Review cadence | Weekly | Bi-weekly + quarterly | Monthly + QBR |
| Leading indicator | Reply rate, connect rate | Pipeline coverage, multi-thread depth | Product usage, exec sponsor health |
| Realistic ramp | 45–60 days | 90–150 days | 60–90 days |
| Data dependency | Very high — list quality dominates | Medium | Low — accounts already known |
| Common misdiagnosis | "Low effort" (usually bad data) | "Bad closer" (usually bad qualification) | "Poor rapport" (usually no usage signal) |
| Fair volume floor | 300–450 quality contacts/mo | 25–40 active opportunities | 30–60 accounts |
For SDRs specifically, the data-dependency row matters more than everything else combined. An SDR working a list where one in four addresses bounces will show weak reply rates, weak connect rates, and weak meeting counts — and none of it is a coaching problem. Before you build a performance-improvement plan, verify the list. Tools like a bulk email finder or a domain search pass make it cheap to re-check whether the contact data underneath the activity metrics is real.
What tools support sales performance evaluation?#
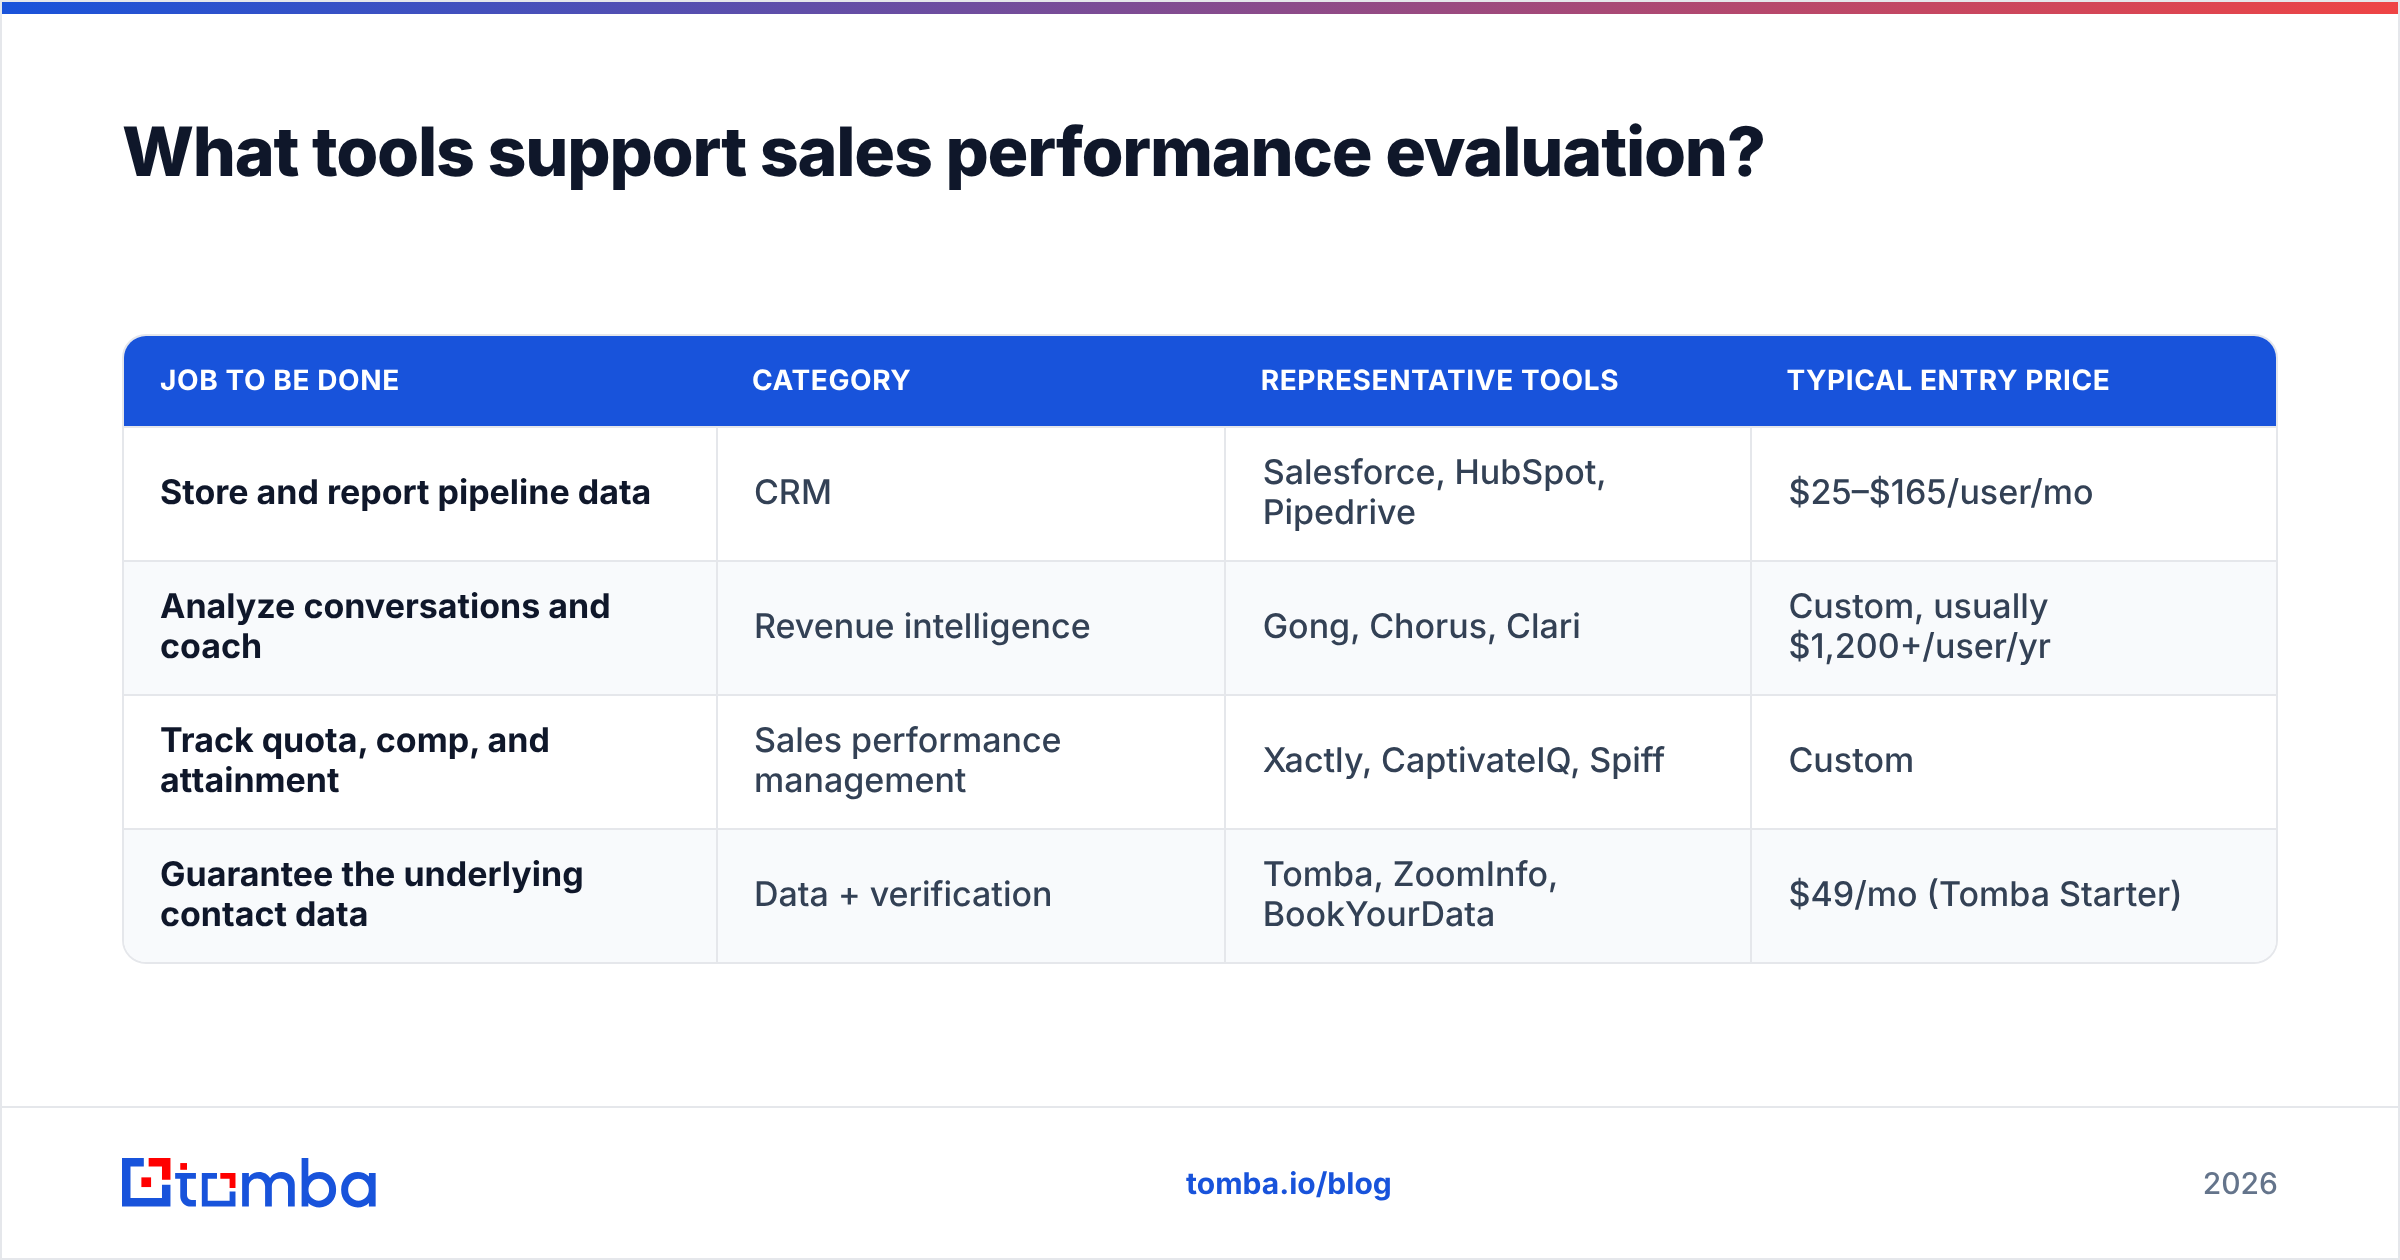
There are four distinct jobs here, and no single tool does all of them well.
| Job to be done | Category | Representative tools | Typical entry price |
|---|---|---|---|
| Store and report pipeline data | CRM | Salesforce, HubSpot, Pipedrive | $25–$165/user/mo |
| Analyze conversations and coach | Revenue intelligence | Gong, Chorus, Clari | Custom, usually $1,200+/user/yr |
| Track quota, comp, and attainment | Sales performance management | Xactly, CaptivateIQ, Spiff | Custom |
| Guarantee the underlying contact data | Data + verification | Tomba, ZoomInfo, BookYourData | $49/mo (Tomba Starter) |
Ratings and category comparisons on G2 are useful for narrowing the first three; they're less useful for the fourth, where accuracy claims should be tested on your own sample rather than trusted from a grid.
A practical stack for a 5–15 rep team: CRM as the system of record, a lightweight BI layer (or CRM dashboards) for the scorecard, conversation intelligence only once you have enough call volume to justify it, and a data layer that keeps the top of the funnel clean. Skipping the last one is why so many teams end up reviewing reps on numbers built from stale records. If you want to go deeper on how contact records are sourced and refreshed, Tomba documents its data sources publicly.
BookYourData is worth a look if your team prefers buying pre-built, filtered lists with a guarantee attached rather than searching contact-by-contact — a different workflow to Tomba's search-and-verify model, and a reasonable fit for teams doing large one-off campaigns.
How often should you run performance reviews?#
Match the cadence to the metric's lag. Reviewing a 120-day-lag metric weekly just produces noise and anxiety.
- Weekly (30 min, per rep): Pipeline inspection only. Deals that moved, deals that stalled, next steps booked. No scoring, no judgment — this is deal work.
- Monthly (45 min, per rep): Leading indicators. Activity ratios, conversion trends, data quality flags. One coaching commitment written down.
- Quarterly (90 min, per rep): Full scorecard. Weighted score, cohort rank, territory-adjusted attainment, development plan for the next 90 days.
- Annually (team-level): Comp plan, quota model, territory rebalance, and a review of whether the scorecard metrics themselves still correlate with revenue. If a metric hasn't predicted anything in four quarters, cut it.
Two guardrails. First, never introduce a new metric and tie comp to it in the same quarter — run it as an observed metric for one full cycle so you can see how reps respond. Second, publish the rubric before the period starts. A scorecard revealed after the fact is a rationalization, not an evaluation.
What are the biggest mistakes in evaluating sales performance?#
- Ranking without normalizing. Stack-ranking across unequal territories measures your territory design, not your reps.
- Coaching the outcome instead of the behavior. "Close more" isn't coaching. "Get a second stakeholder on every call after discovery" is.
- Over-indexing on activity volume. Once a rep clears the effort floor, more dials rarely help. Ratios do.
- Ignoring the denominator. Win rate on 8 deals and win rate on 80 deals are different kinds of number. Note sample size next to every percentage.
- Reviewing on dirty data. If your CRM's stage definitions are ambiguous or your contact records are stale, every derived metric inherits the error. Fix hygiene before you fix humans.
- Treating the scorecard as permanent. Market shifts, ICP changes, and product launches all change which metrics predict revenue. Re-validate annually.
- One rubric for every role. Covered above, and worth repeating — it's the mistake with the highest cost.
A useful sanity test: for every metric on your scorecard, ask "if a rep maximized only this, would the business be better off?" If the answer is no, the metric needs a counterweight. Meetings booked needs meeting-held-rate. Deal count needs average deal size. Speed needs win rate.
Where should you start if you have no scorecard today?#
Start with a single quarter of clean baseline data, not a perfect framework.
Pull last quarter's closed-won and closed-lost by rep. Calculate win rate, average cycle length, and average deal size for each. Then pull current open pipeline and compute coverage against next quarter's quota. That's five numbers per rep and roughly two hours of work — enough to see who has a volume problem, who has a conversion problem, and who has a pipeline problem.
Then audit the inputs. Sample each rep's prospecting list and measure bounce rate and title accuracy. In most teams that have never done this, the result is uncomfortable and clarifying at the same time: a meaningful chunk of the apparent performance spread is data, not talent.
Layer in the rest of the scorecard the following quarter, once people trust the baseline.
Get the input layer right first. Every metric in this playbook sits on top of your contact data — if the addresses are wrong, the activity ratios lie and the coaching misses. Tomba Email Finder gives your team verified professional email addresses by domain, name, or company, so reply rates and meeting counts reflect rep skill rather than list decay. Start on the free tier (25 searches/month) to audit a sample of your current lists, or move to Starter at $49/month for ongoing team use — full Tomba pricing is public, and there's an email finder API if you'd rather pipe verification straight into your CRM before the next review cycle.
Related guides#
// get started
Find, verify and enrich your first contacts today
Start on the free plan with 25 searches a month, then scale when your team is ready.
Free plan · No credit card required · GDPR & CCPA
// about the author