How to Forecast Sales for a New Product: A 2026 Playbook
New products have no sales history, so every forecast is really a stack of assumptions. Here are five methods, the math behind a bottom-up build, and the accuracy you should actually promise the board.
TL;DR
- A new product has no sales history, so you are not forecasting — you are modelling. Say that out loud before anyone anchors on a number.
- Bottom-up activity models beat top-down TAM percentages for the first two or three quarters, because every input is something you can measure this week.
- The three inputs that break most launch forecasts are addressable contact count, deliverable contact count, and sales-cycle length. Two of the three are data problems, not sales problems.
- Publish a range with named scenarios (conservative / base / stretch), not a single number. Expect 40-60% error in Q1 and tighten to 15-20% by Q3.
- Re-forecast every two weeks against actuals until three consecutive cycles land inside your band. Then move to monthly.
Why is forecasting a new product different from forecasting an existing one?#
Because the thing you normally lean on — history — does not exist yet.
An established product gives you trailing win rates, seasonality, deal-size distributions, and a pipeline that already behaves predictably. You can regress against last year and be roughly right. A new product gives you none of that. Everything you would normally measure has to be assumed, and every assumption compounds: a 20% error in reply rate multiplied by a 20% error in win rate is a 44% error in bookings.
The practical consequence is that a new-product forecast is a chain of ratios, and your job is to make each link in that chain either (a) measurable within two weeks, or (b) benchmarked against something real. Anything that is neither is a guess wearing a spreadsheet.
There is a second difference that people underestimate: the forecast's purpose changes. For an existing line, the forecast drives revenue commitments. For a launch, it mostly drives capacity decisions — how many reps, how much data budget, how many support hours. Getting the shape right matters more than getting the total right.
What inputs do you need before you forecast anything?#
Gather these five before you open a spreadsheet. Each one is a number you can defend, not an opinion.
- Addressable account count. Not TAM in dollars — a countable list of companies that match your ICP by industry, size band, geography, and (if relevant) tech stack. If you cannot build the list, you cannot sell to it, and a dollar-denominated TAM will flatter you.
- Reachable contact count per account. Two to four named buyers per account is typical in mid-market B2B. Multiply, then discount: a domain search across your target list tells you how many contactable people actually exist behind each domain rather than how many you wish existed.
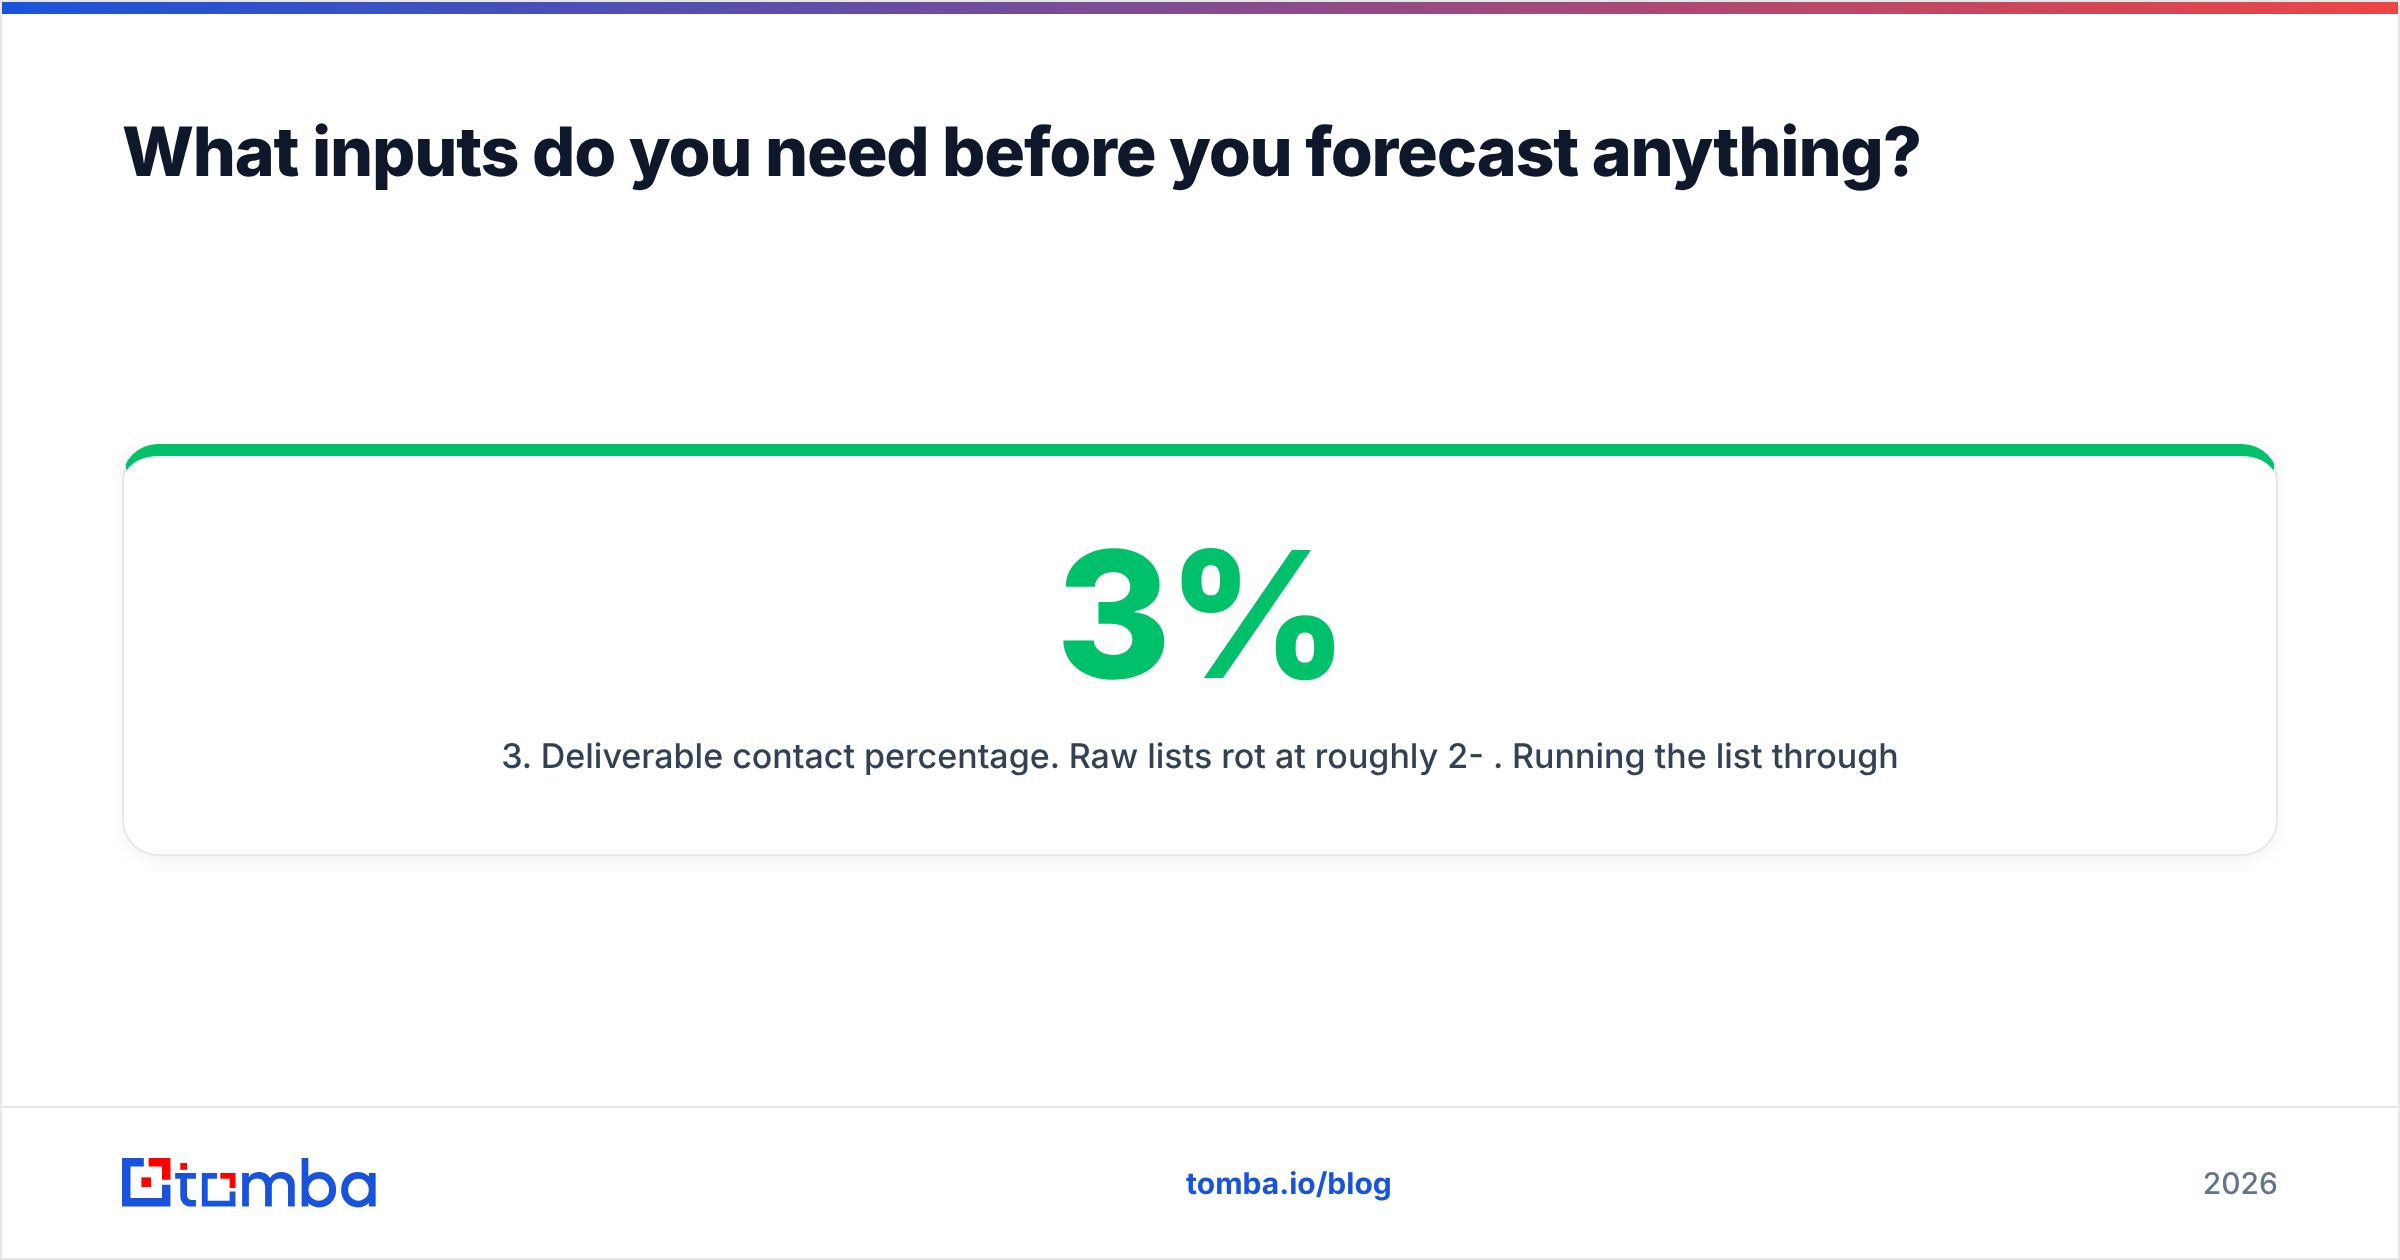
- Deliverable contact percentage. Raw lists rot at roughly 2-3% per month. Running the list through an email verifier before you model gives you a real denominator instead of a hopeful one. The gap between "contacts" and "deliverable contacts" is often 15-25%.
- Stage-to-stage conversion benchmarks. Reply rate, positive-reply rate, meeting-held rate, opportunity rate, and win rate. Borrow from your closest existing product for v1, then replace each borrowed number with a measured one as the data arrives.
- Expected ACV and cycle length. Price is usually set. Cycle length is usually wrong — new products with a new buyer persona typically run 1.3-1.6x the cycle of your established line, because the buyer has no internal precedent for the purchase.
Write each of these on one line with a source next to it. If the source column says "felt right," that input is your biggest risk.
Which forecasting method should you actually use?#
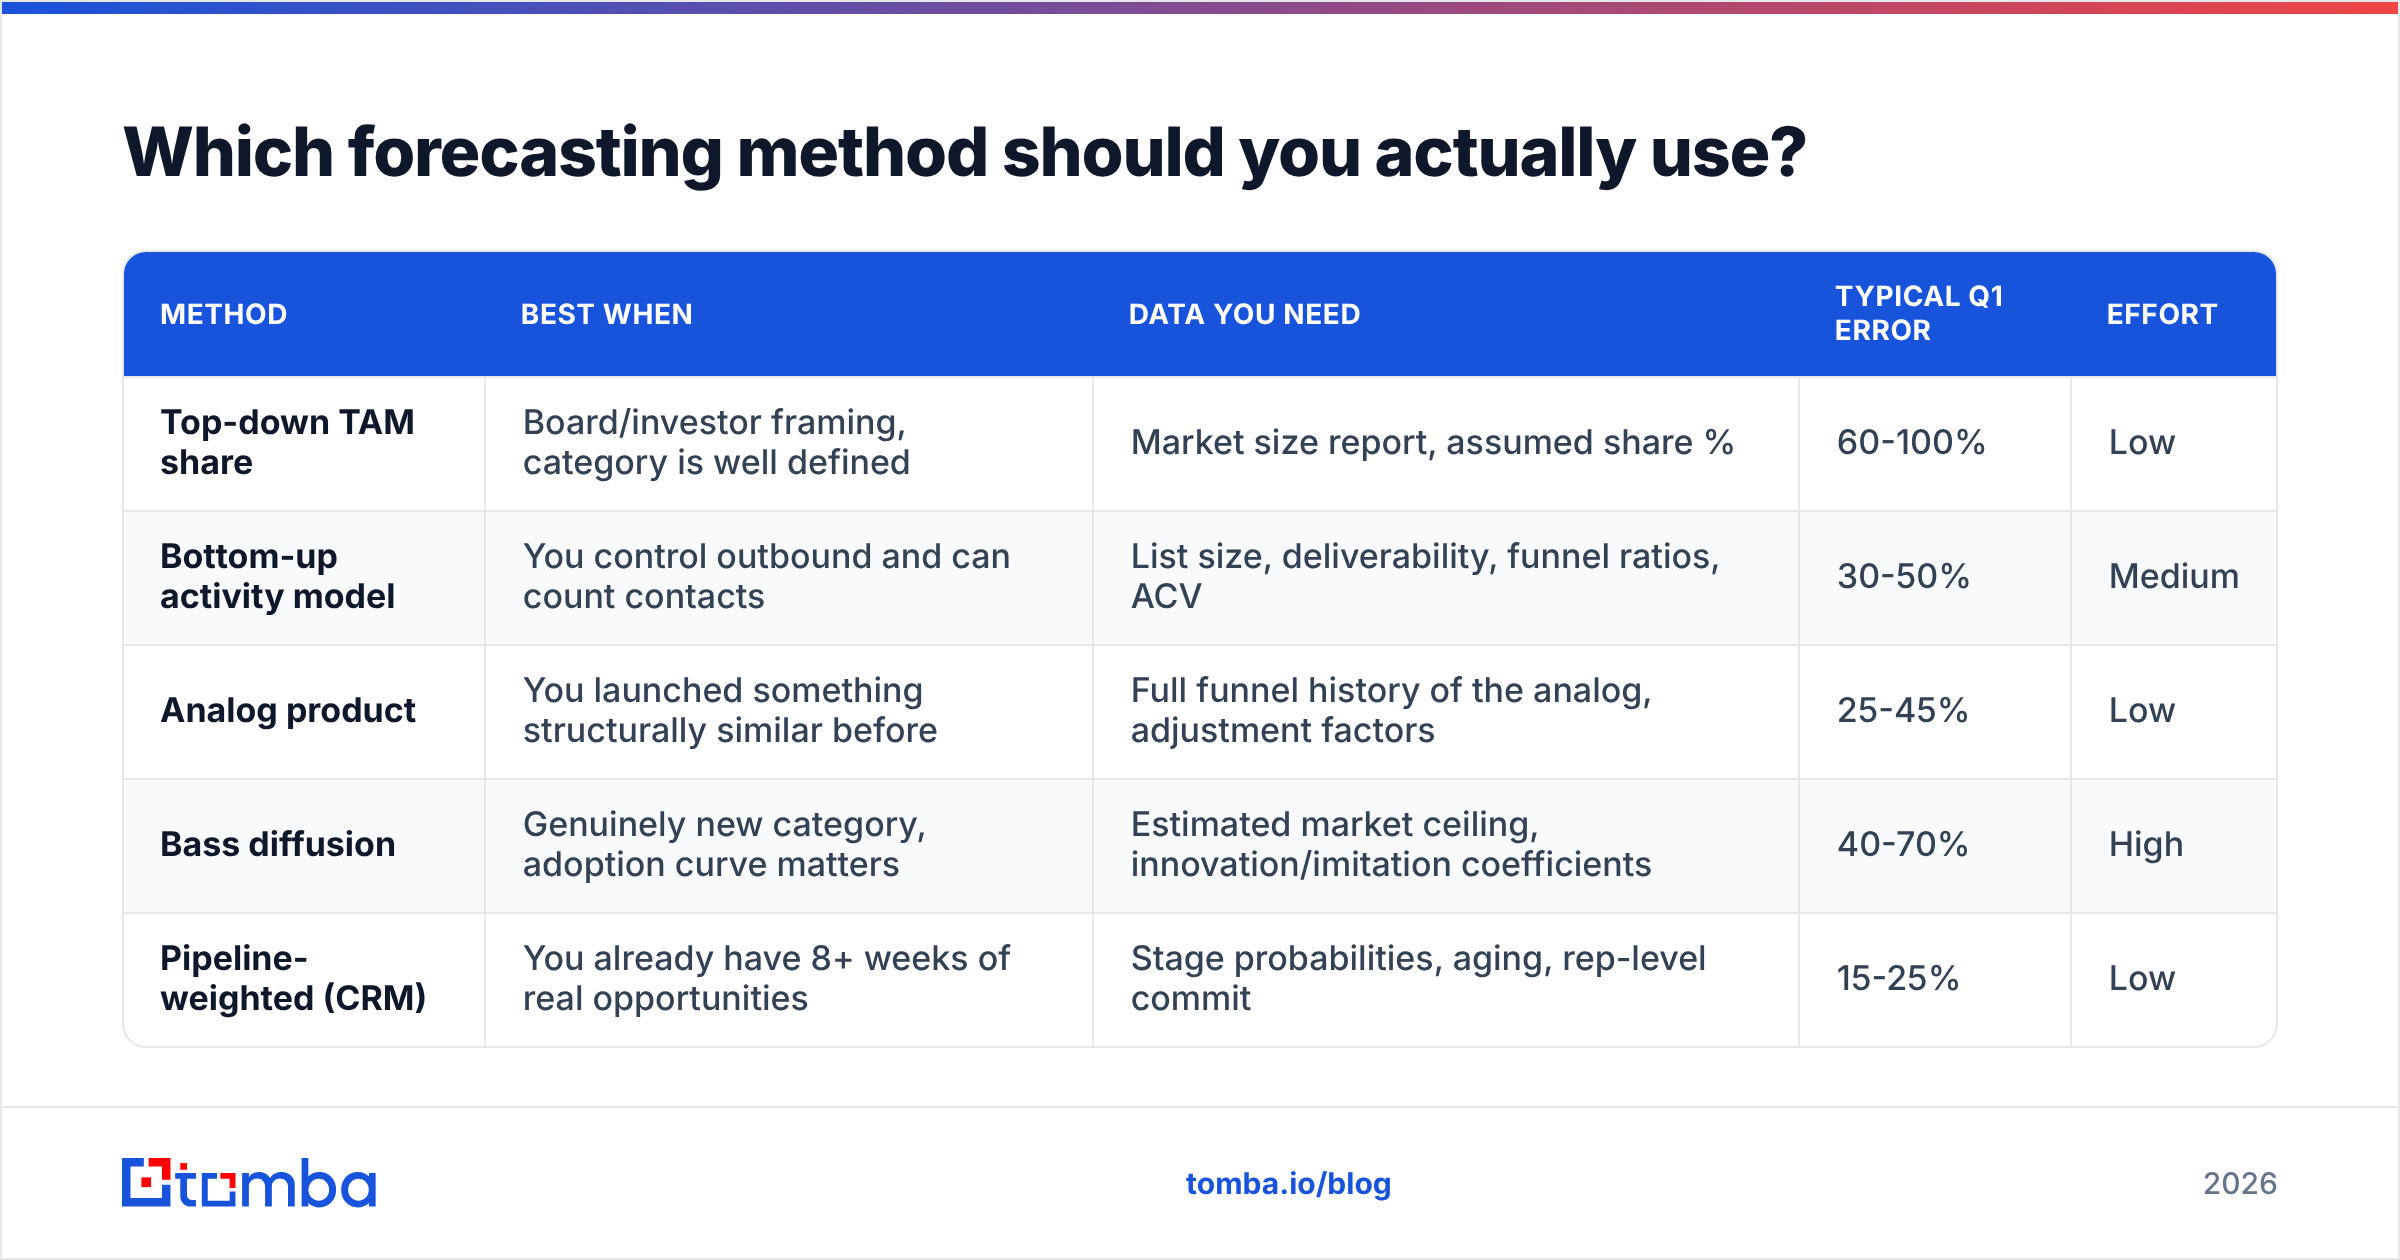
There are five credible approaches for a zero-history product. They are not mutually exclusive — the strong play is to run two and reconcile the gap.
| Method | Best when | Data you need | Typical Q1 error | Effort |
|---|---|---|---|---|
| Top-down TAM share | Board/investor framing, category is well defined | Market size report, assumed share % | 60-100% | Low |
| Bottom-up activity model | You control outbound and can count contacts | List size, deliverability, funnel ratios, ACV | 30-50% | Medium |
| Analog product | You launched something structurally similar before | Full funnel history of the analog, adjustment factors | 25-45% | Low |
| Bass diffusion | Genuinely new category, adoption curve matters | Estimated market ceiling, innovation/imitation coefficients | 40-70% | High |
| Pipeline-weighted (CRM) | You already have 8+ weeks of real opportunities | Stage probabilities, aging, rep-level commit | 15-25% | Low |
The honest sequencing looks like this: use bottom-up to set the plan, use top-down as a sanity ceiling, and switch to pipeline-weighted the moment you have enough real opportunities to make stage probabilities meaningful — usually 30+ opportunities, which is roughly eight to twelve weeks in.
Bass diffusion deserves a note. The Bass diffusion model is genuinely useful for products creating a new category, where word-of-mouth drives a slow start and a steep middle. It is close to useless for a product entering an existing category with known competitors, because the "innovation coefficient" you would have to guess is doing all the work.
How do you build a bottom-up forecast in six steps?#
Here is the full arithmetic with real numbers. Substitute your own; the structure is what matters.
Step 1 — Size the reachable list. Your SAM is 12,000 companies. Applying strict ICP filters (headcount 50-500, three target industries, North America) leaves 3,400 accounts.
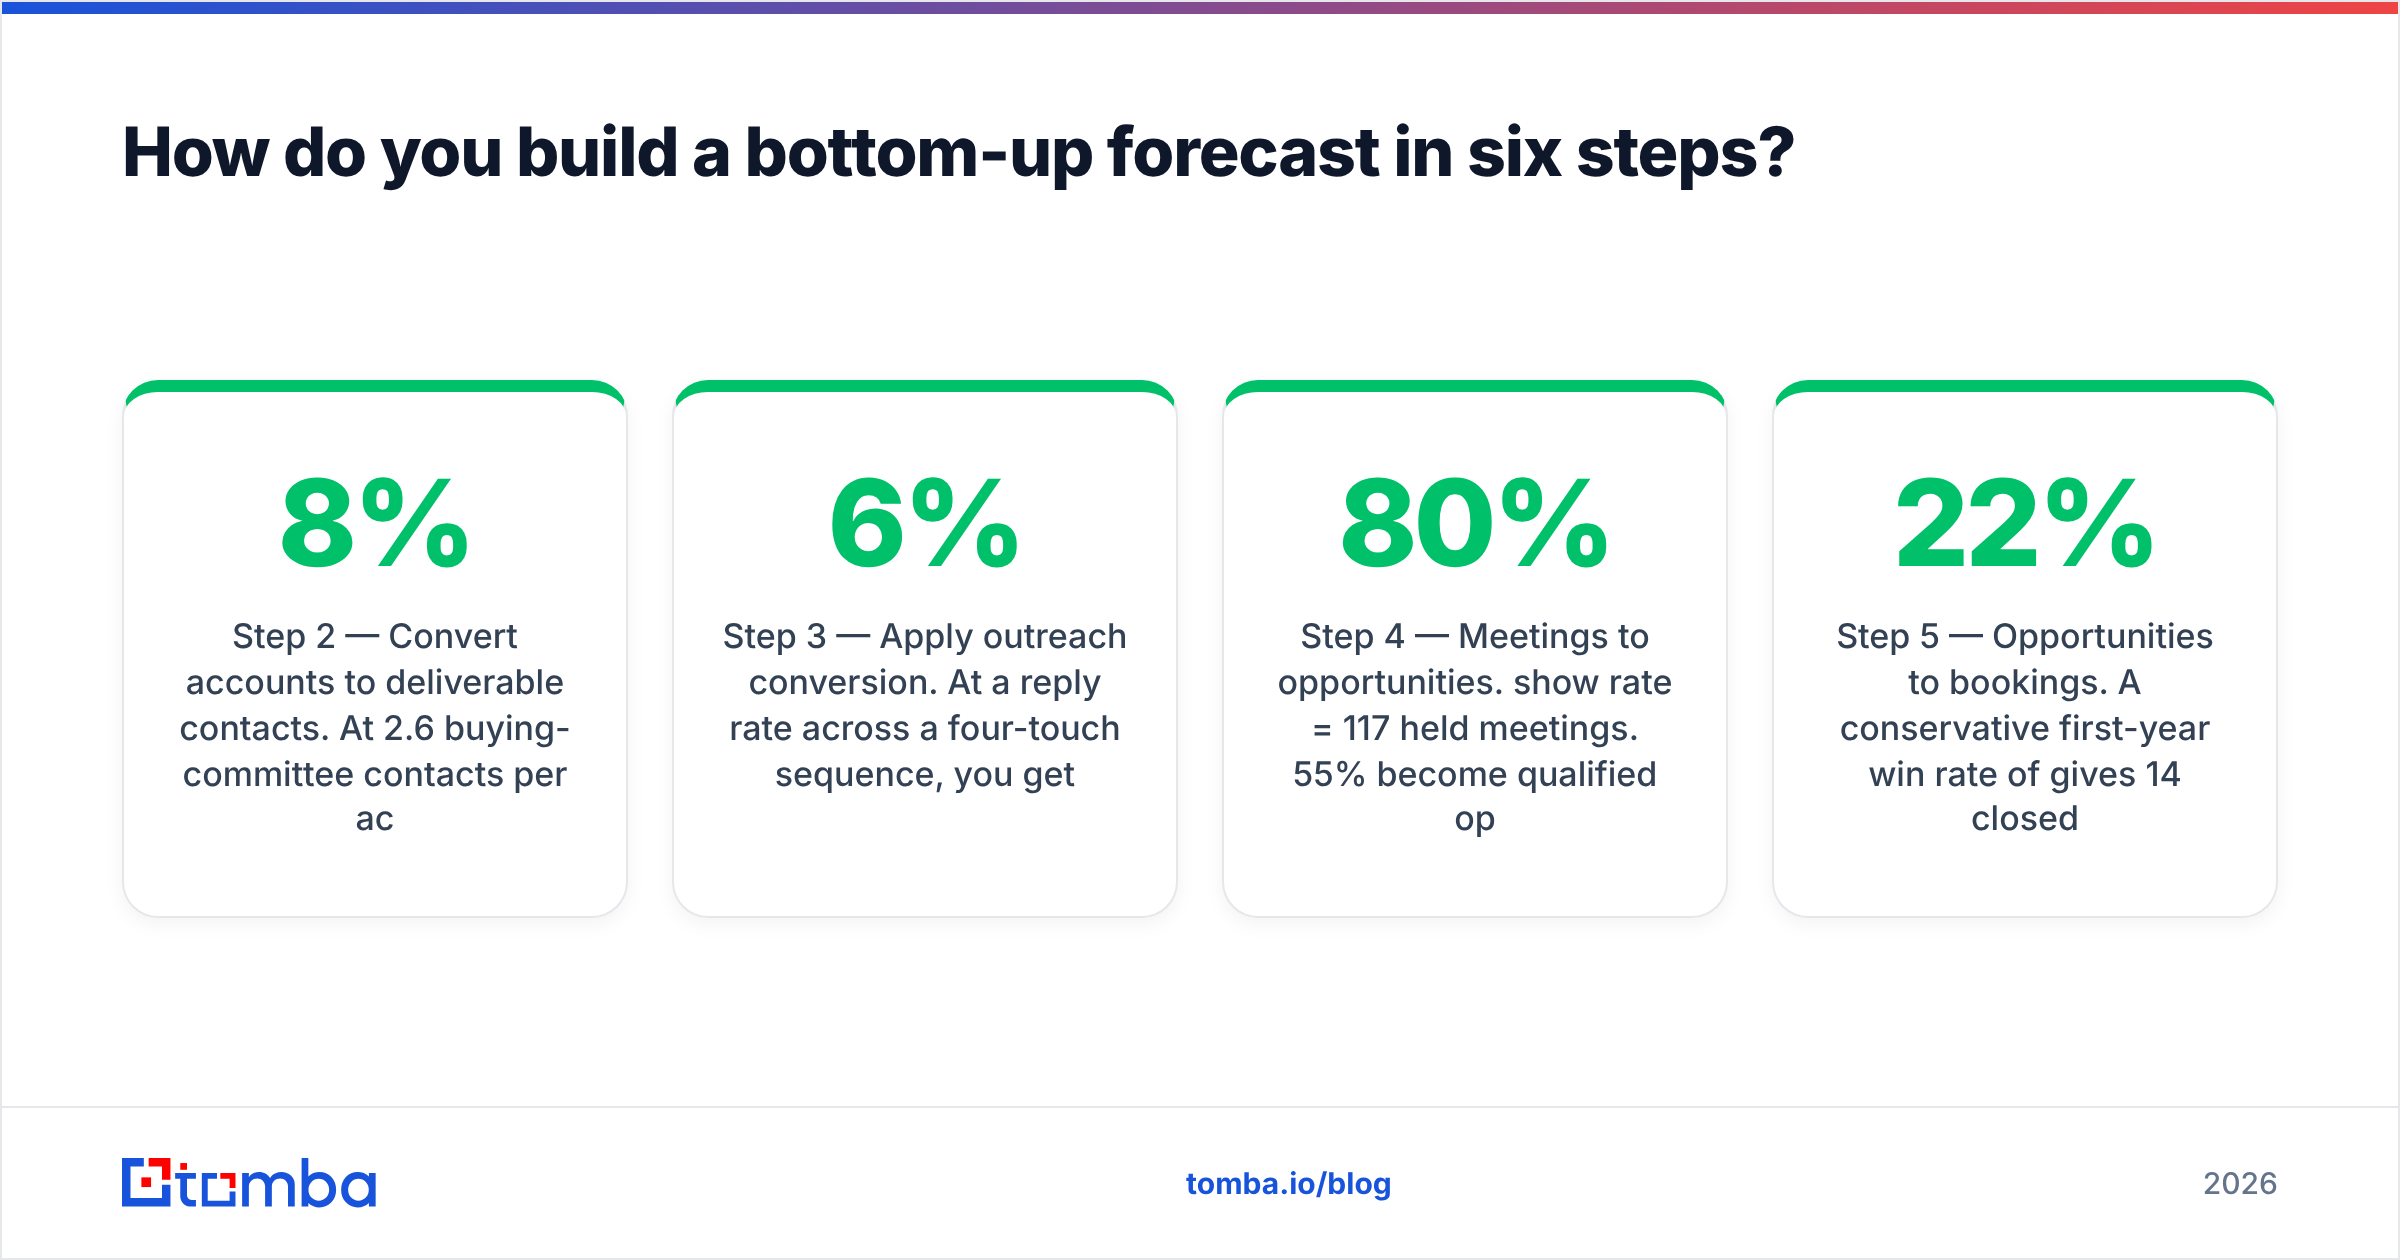
Step 2 — Convert accounts to deliverable contacts. At 2.6 buying-committee contacts per account, that is 8,840 contacts. Verification kills 8%, so you have 8,133 deliverable contacts. This is the number the whole forecast rests on, and it is the one most launch plans never calculate. A bulk email finder run against the account list turns this from an estimate into a count.
Step 3 — Apply outreach conversion. At a 6% reply rate across a four-touch sequence, you get 488 replies. Thirty percent are positive: 146 booked meetings. If your response rate assumption came from a different product, mark it as borrowed.
Step 4 — Meetings to opportunities. 80% show rate = 117 held meetings. 55% become qualified opportunities = 64 opportunities.
Step 5 — Opportunities to bookings. A conservative first-year win rate of 22% gives 14 closed deals. At an $9,600 ACV, that is $135,360 per full outreach cycle.
Step 6 — Apply timing and ramp. Deals do not land in the quarter you sent the emails. With a 68-day average cycle, roughly 35% of that $135k lands in the quarter it was generated and 65% slips to the next. New reps ramp: assume 40% productivity in month one, 70% in month two, 100% from month three.
Now build the band. Multiply the base case by 0.6 for conservative and 1.4 for stretch — a range of $81k to $189k for the first cycle. Present the range. If someone insists on a single number, give them the conservative case and explain that the delta between it and base is the cost of the assumptions you have not yet tested.
How accurate should a new-product forecast be?#
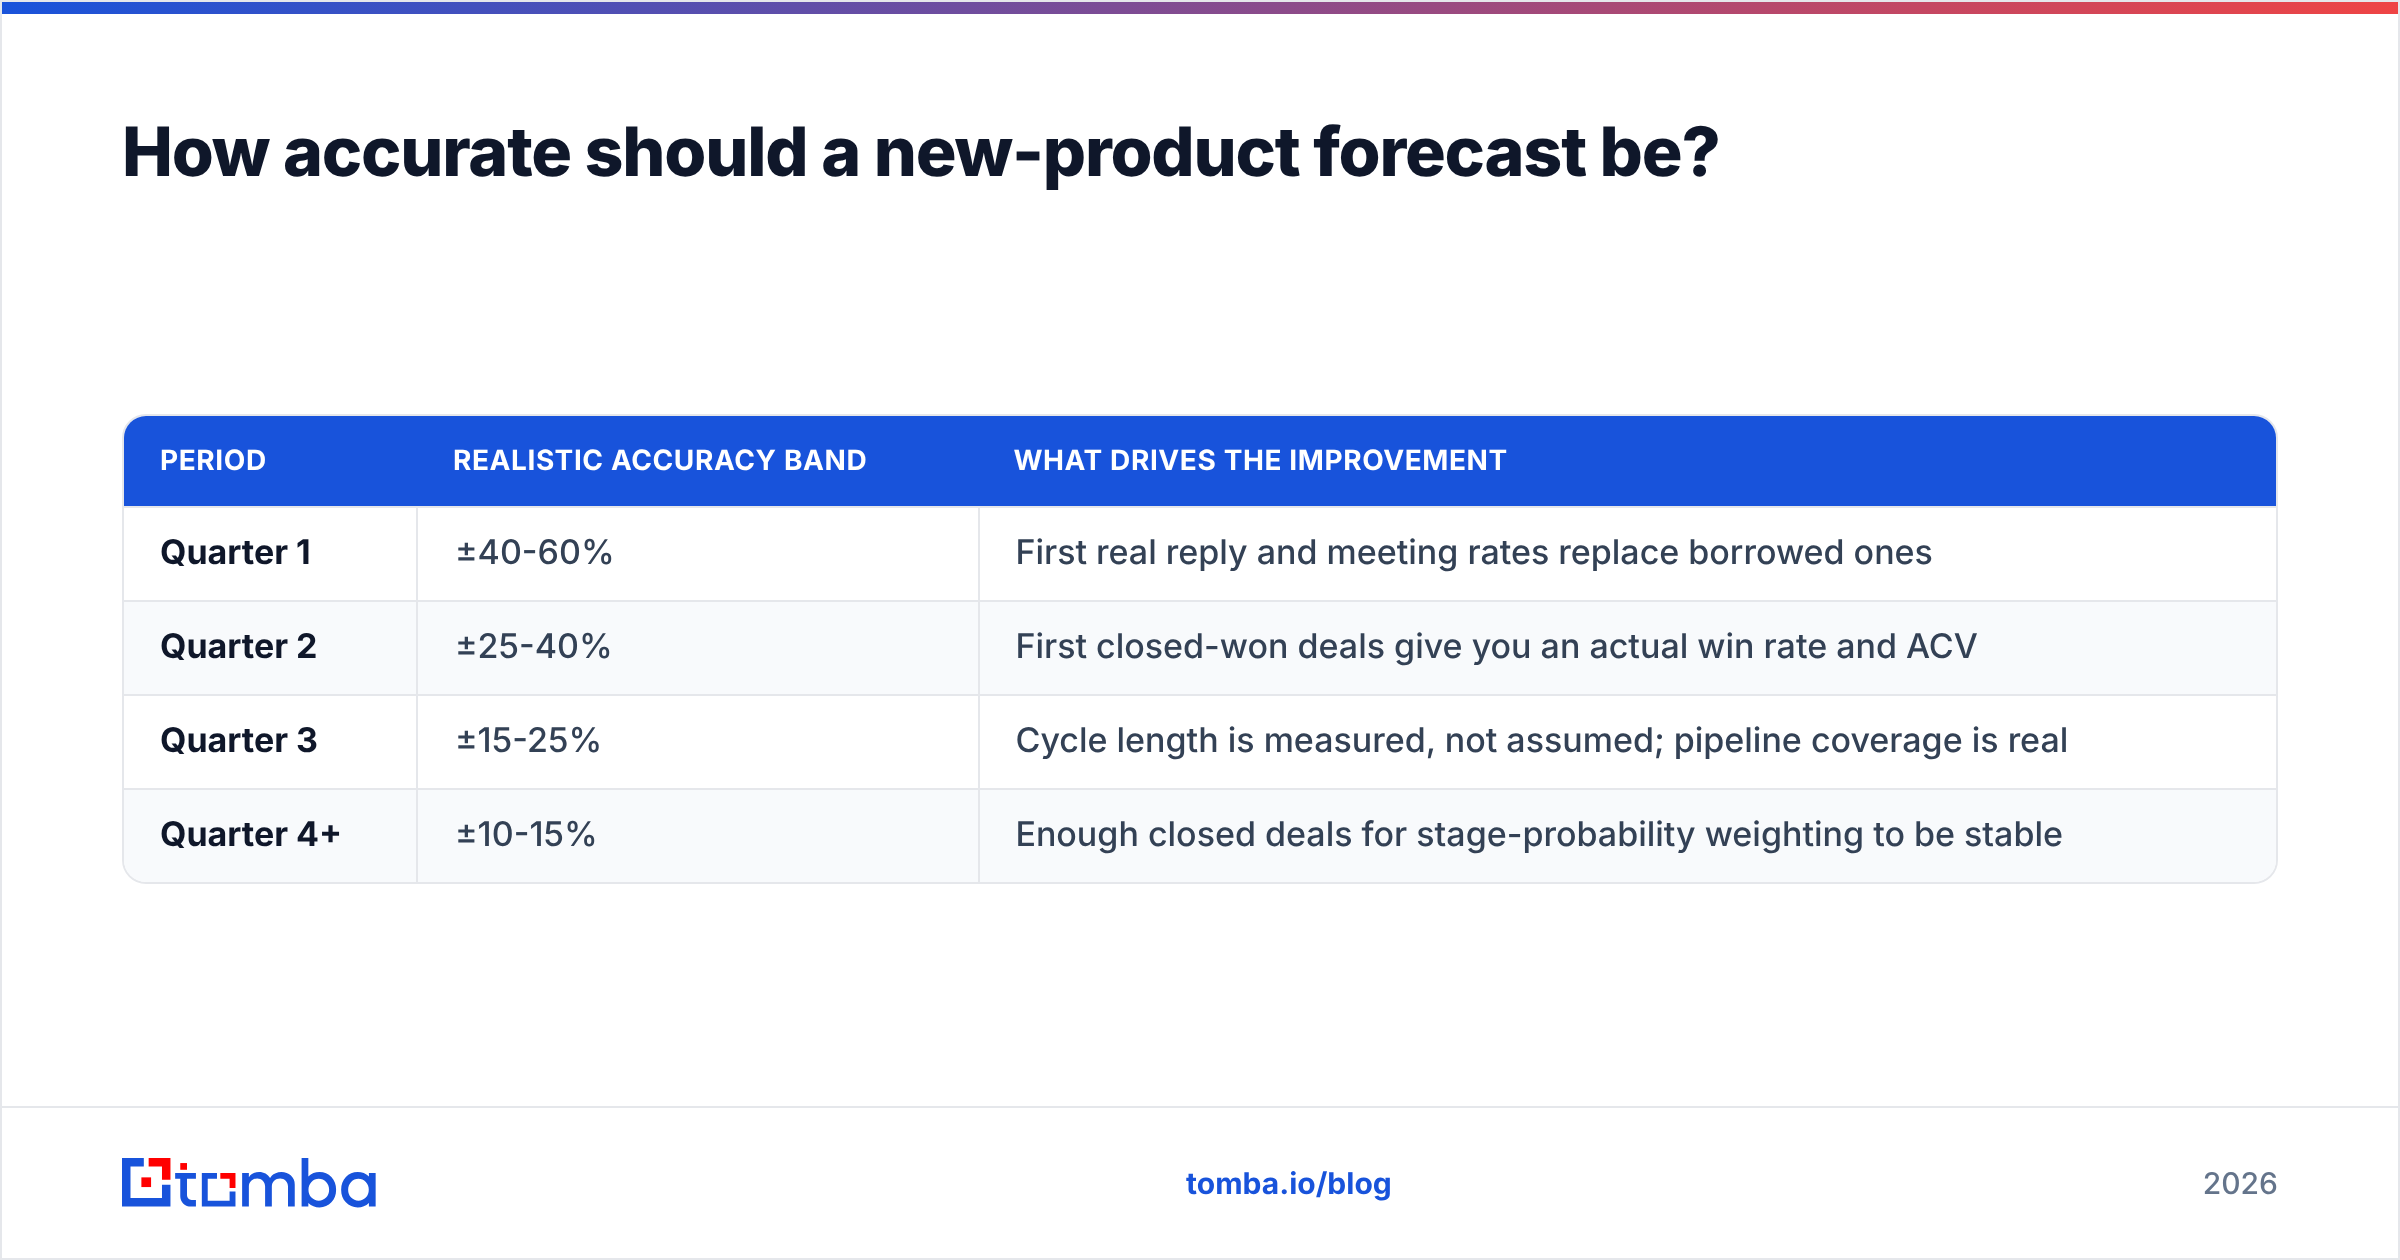
Set expectations before the first miss, not after it. Gartner's sales research has been consistent for years that forecast accuracy is a maturity problem, not an effort problem — and a launch is by definition the least mature thing in your portfolio.
| Period | Realistic accuracy band | What drives the improvement |
|---|---|---|
| Quarter 1 | ±40-60% | First real reply and meeting rates replace borrowed ones |
| Quarter 2 | ±25-40% | First closed-won deals give you an actual win rate and ACV |
| Quarter 3 | ±15-25% | Cycle length is measured, not assumed; pipeline coverage is real |
| Quarter 4+ | ±10-15% | Enough closed deals for stage-probability weighting to be stable |
Two rules keep you honest. First, never narrow the band because leadership wants a tighter number — narrow it when the underlying variance actually drops. Second, track which input caused each miss. Over three cycles you will find that one or two ratios explain most of the error, and that is where your instrumentation budget goes.

How do you forecast with zero pipeline and zero list?#
This is the genuinely hard case: a new product, a new buyer, and no existing motion to borrow from.
Run a 10-day calibration sprint instead of a forecast. Build a deliberately small sample — 300 to 500 verified contacts across your top ICP segment — and run one real sequence. You are not trying to book revenue. You are trying to buy three numbers: deliverability, reply rate, and positive-reply rate. Those three collapse the widest part of your uncertainty for the price of about a week.
Practical notes on running the sprint:
- Sample across segments, not within one. 150 contacts in each of three industries tells you more than 450 in one, because segment variance is usually larger than message variance at this stage.
- Verify before you send. A bounce-driven reply rate is not a signal, and a damaged sending domain will contaminate every subsequent test. Check your setup with an SPF checker first.
- Do not A/B test copy yet. With 400 contacts you do not have the volume to distinguish a 5% from a 7% reply rate. Test one solid message; test copy later at scale.
- Log the reasons for negative replies. "Wrong person" means your contact model is off. "No budget" means your ICP is off. "Already using X" means your competitive assumption is off. These three failure modes point at three completely different fixes.
For deeper context on the discipline itself, HubSpot's sales forecasting library is a reasonable starting reference for method definitions and templates.
What kills new-product forecasts most often?#
Five failure modes, roughly in order of how much damage they do.
Confusing list size with reachable list size. A 3,400-account TAM is not 3,400 sellable accounts. Between account count and a working inbox sits contact coverage, deliverability, and role match. Skip that math and your forecast is inflated by 30-50% before you make a single call.
Borrowing a win rate from a mature product. Your flagship closes at 34% because it has references, case studies, and a category the buyer already budgets for. A new product has none of those. Haircut the borrowed win rate by 30-40% for the first two quarters.
Ignoring cycle-length inflation. New products get an extra approval step — often security review, procurement, or a "let's pilot it first" detour. If you model your existing 45-day cycle, you will book Q1 revenue that actually arrives in Q2, and everyone will call it a miss when it was a timing error.
Forecasting bookings without forecasting capacity. Fourteen deals need roughly 64 opportunities, which need 117 held meetings, which need real rep hours. If the reps carrying the new product also carry a quota on the old one, the forecast is arithmetic fiction.
Never re-forecasting. The forecast you set in week one is your worst forecast. Re-run it every two weeks, replacing one borrowed assumption with one measured one each time. After six weeks the model stops being a guess and starts being a description.
How do you turn the forecast into a weekly operating rhythm?#
Make the model a live document with three columns per input: assumed, actual, variance. Every two weeks, whoever owns the launch updates actuals and the model recalculates. Nobody debates the total — you debate which single input moved most and what you are doing about it.
Tie each input to an owner and a lever:
- Deliverability below plan → data owner, fix the list and enrichment source
- Reply rate below plan → messaging owner, fix targeting before copy
- Meeting-to-opportunity below plan → sales owner, fix qualification criteria
- Win rate below plan → product/pricing owner, fix packaging or ICP definition
This is what separates a forecast from a fortune. A fortune tells you what will happen. A forecast tells you which assumption to go test next.
Where does contact data fit into all of this?#
It sits underneath everything. Steps 1 and 2 of the bottom-up model — reachable accounts and deliverable contacts — set the ceiling for every downstream number. You cannot out-message a list that does not reach anyone, and no conversion improvement rescues a denominator that was 25% fiction.
If you are building the target list for a launch, start with the Tomba Email Finder: search by domain or company to get verified, role-matched contacts for your ICP accounts, then export a deliverable count you can actually put in the model. The free tier covers 25 searches a month if you just want to sanity-check the coverage assumption before committing; Tomba pricing starts at $49/mo when you are ready to build the full launch list. Get the denominator right first — the rest of the forecast is arithmetic.
Related guides#
// get started
Find, verify and enrich your first contacts today
Start on the free plan with 25 searches a month, then scale when your team is ready.
Free plan · No credit card required · GDPR & CCPA
// about the author