How to Improve Sales Performance: A 2026 Playbook for Teams
Most sales performance programs fail because they coach technique when the real bottleneck is data, targeting, or pipeline math. Here is a 30-day diagnostic, benchmark table, and the four levers ranked by cost and time-to-impact.
TL;DR
- Sales performance is a ratio problem, not an effort problem. Before you add activity, find which conversion step is leaking: contact rate, meeting rate, opportunity rate, or close rate.
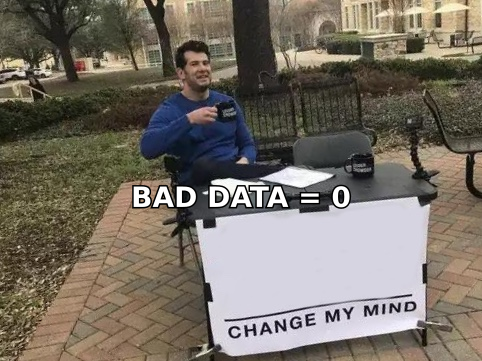
- The cheapest lever is almost always data quality. Bad contact data quietly caps every downstream metric, and no amount of coaching fixes a 40% bounce rate.
- Run a 30-day diagnostic before you buy anything: pull 90 days of pipeline, segment by rep and by segment, and find the single worst-performing stage transition.
- Coaching works, but only when it targets one behavior per rep per quarter. Broad "be more consultative" feedback produces zero measurable lift.
- Track leading indicators weekly (contact rate, meetings booked, stage-to-stage velocity) and lagging indicators monthly (win rate, ACV, cycle length). Mixing the two is how teams fool themselves.
What does "sales performance" actually mean in 2026?#
Sales performance is the efficiency with which your team converts inputs (accounts, contacts, hours, dials, emails) into revenue. That is it. Everything else — enablement decks, methodology certifications, new CRM fields — is a means to move that ratio.
The reason this matters is that most teams measure performance as output volume. They celebrate 400 emails sent and 60 dials made. Output volume tells you nothing about performance; it tells you about capacity. A rep who sends 400 emails to a list with a 38% bounce rate is performing worse than a rep who sends 120 emails to a verified list, even though the first rep looks busier on the activity dashboard.
Think of it like a factory line with five stations. If station three is jammed, hiring more people for station one just builds a bigger pile of unfinished work. Sales teams do this constantly: they respond to a soft quarter by increasing top-of-funnel activity, when the actual jam is that discovery calls are not converting into second meetings.
The four ratios worth managing:
- Contact rate — of the people you attempt to reach, how many actually receive and open your message. This is a data and deliverability problem, not a talent problem.
- Meeting conversion — of the people who engage, how many book. This is a messaging and targeting problem.
- Opportunity conversion — of the meetings held, how many become qualified pipeline. This is a discovery and qualification problem.
- Win rate — of qualified opportunities, how many close. This is a win rate problem driven by competitive positioning, pricing, and multithreading.
Improving sales performance means identifying which of those four is furthest from benchmark and fixing that one first.
Why do most sales performance programs fail?#
They start with the human and end with the system, when it should be the reverse.
A typical intervention looks like this: quota is missed, leadership books a two-day training, reps learn a new framework, adoption decays over six weeks, and the numbers do not move. Research summarized by HubSpot has consistently shown that reps spend only around a third of their time actually selling — the rest goes to admin, research, and data cleanup. Training does not reclaim that time. Process and tooling do.
Three specific failure patterns:
You coach the symptom, not the constraint. Low close rate looks like a closing problem. Nine times out of ten it is a qualification problem two stages earlier — reps are advancing deals that were never going to buy, which inflates pipeline and deflates win rate simultaneously.
You change too many variables at once. New sequence, new pricing page, new territory model, new CRM stages, all in the same quarter. When the number moves, you cannot attribute it, so you cannot repeat it.
You ignore the data layer. This is the least glamorous and most expensive failure. If 30% of your contact records are wrong, your contact rate is capped at 70% before a single word of copy is written. Your reps are not underperforming — your list is.
Which metrics should you fix first?#
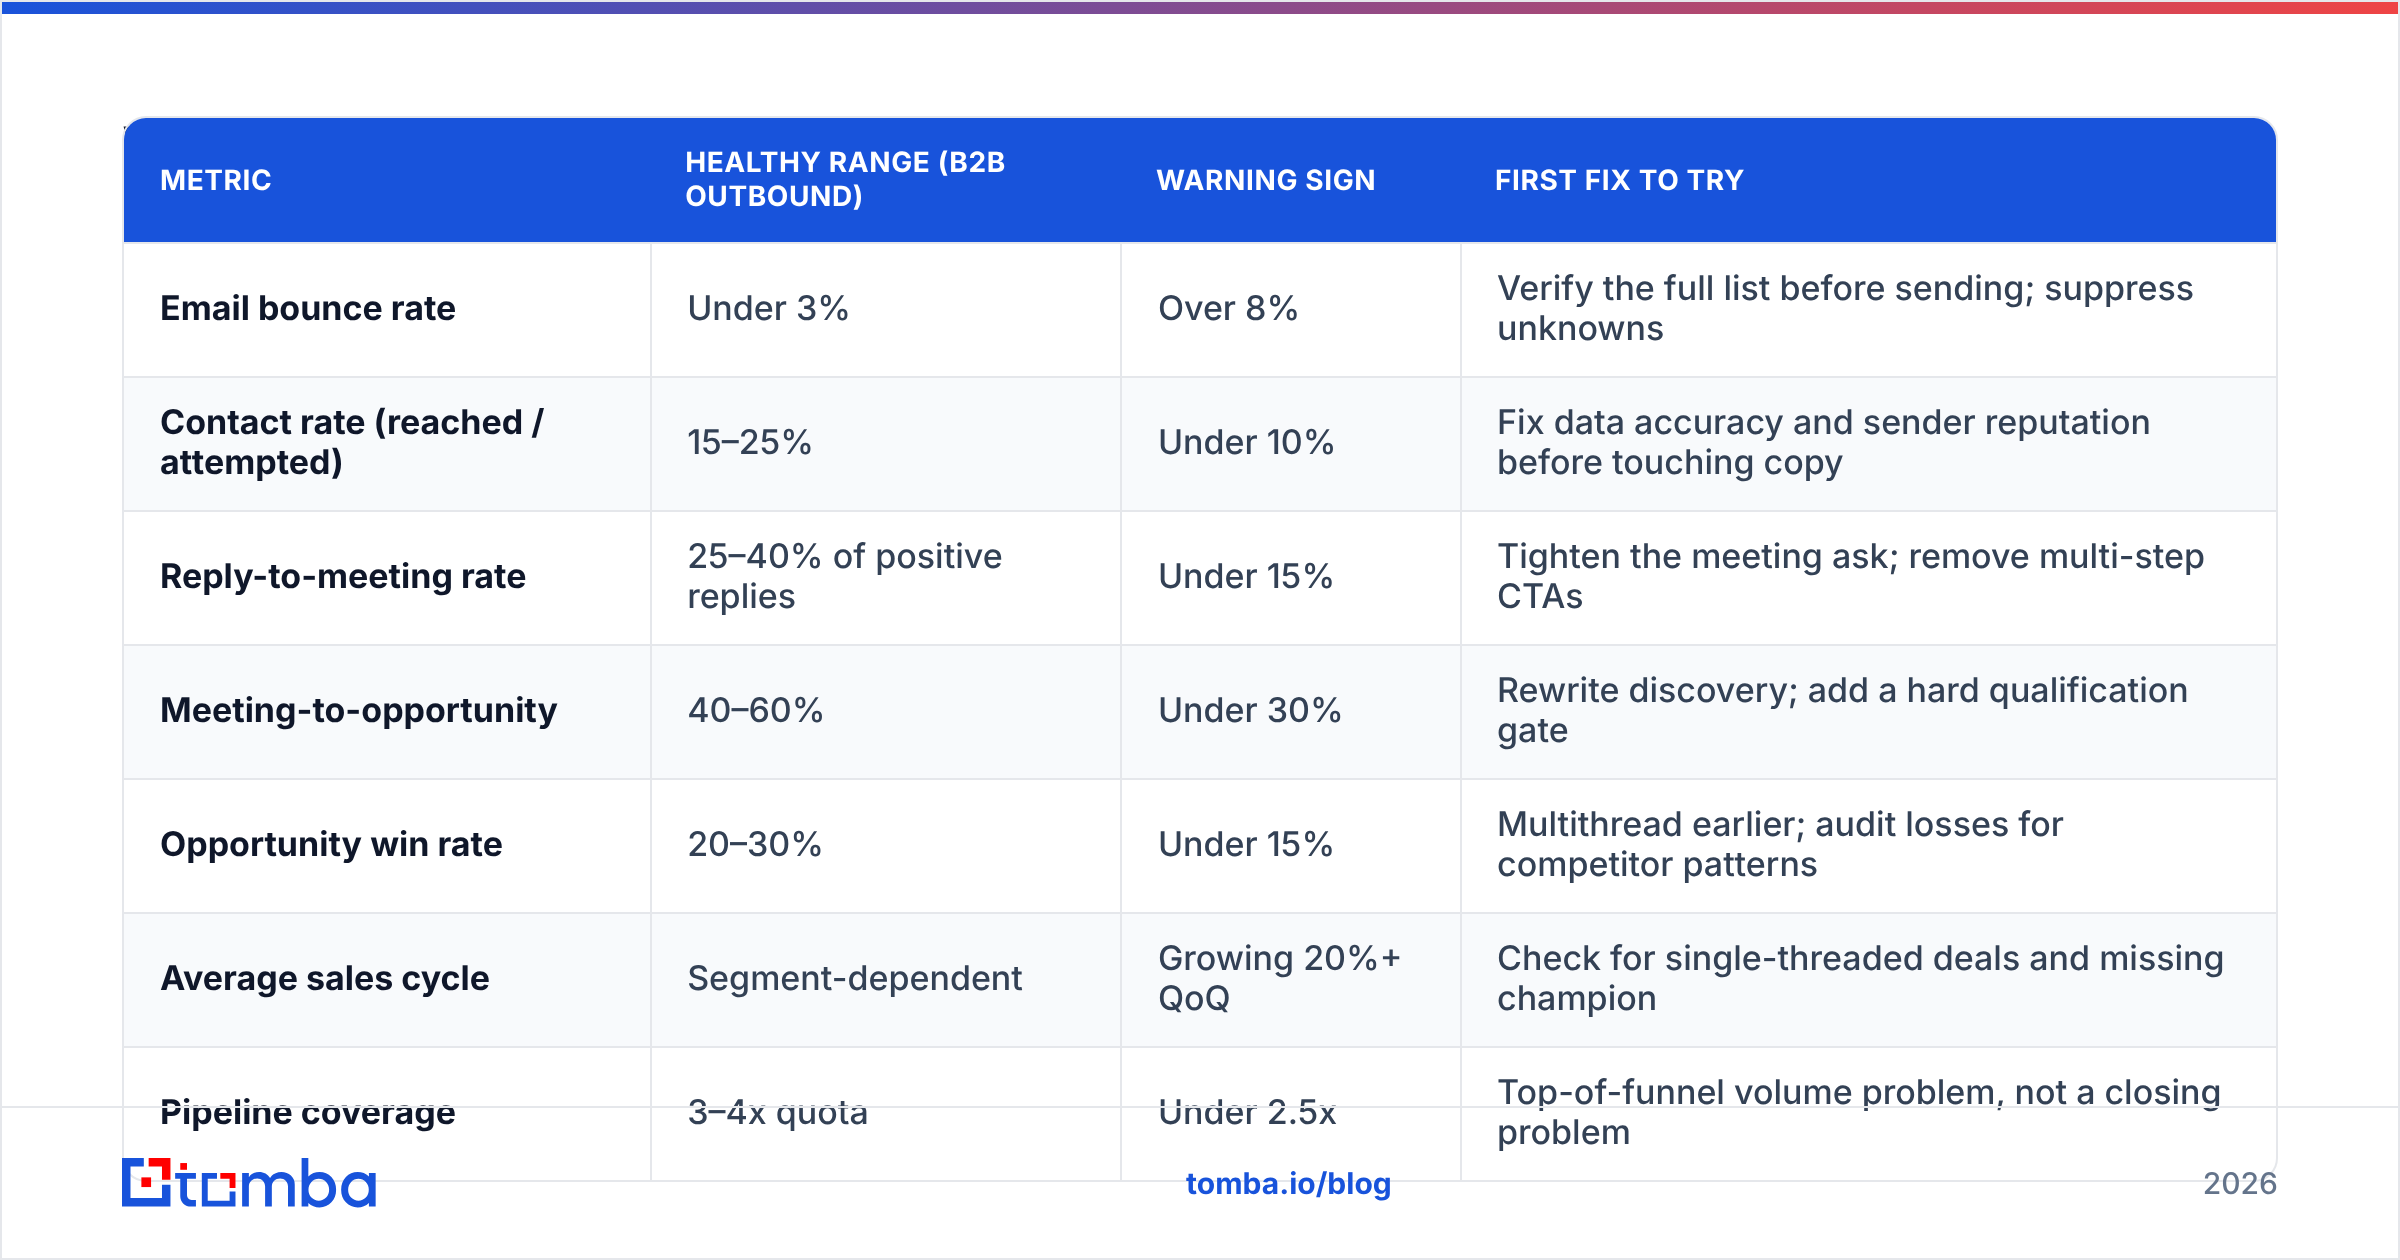
Use this table to locate the constraint. Pull the last 90 days from your CRM, compute each metric, and find the biggest gap between your number and the healthy range.
| Metric | Healthy range (B2B outbound) | Warning sign | First fix to try |
|---|---|---|---|
| Email bounce rate | Under 3% | Over 8% | Verify the full list before sending; suppress unknowns |
| Contact rate (reached / attempted) | 15–25% | Under 10% | Fix data accuracy and sender reputation before touching copy |
| Reply-to-meeting rate | 25–40% of positive replies | Under 15% | Tighten the meeting ask; remove multi-step CTAs |
| Meeting-to-opportunity | 40–60% | Under 30% | Rewrite discovery; add a hard qualification gate |
| Opportunity win rate | 20–30% | Under 15% | Multithread earlier; audit losses for competitor patterns |
| Average sales cycle | Segment-dependent | Growing 20%+ QoQ | Check for single-threaded deals and missing champion |
| Pipeline coverage | 3–4x quota | Under 2.5x | Top-of-funnel volume problem, not a closing problem |
Two rules when reading this table. First, only one metric gets attention per quarter. Second, the fix must be measurable within 30 days, or it is a strategy project, not a performance fix.
How do you run a 30-day performance diagnostic?#
This is the sequence that produces a defensible answer instead of an opinion.
- Export 90 days of closed and open pipeline. Include source, segment, rep, stage entry dates, and loss reason. If loss reasons are blank on more than a quarter of records, that itself is your first fix.
- Compute the four ratios per rep and per segment. You are looking for variance. If one rep converts meetings to opportunities at 55% and the team average is 28%, you have an internal benchmark and a playbook to copy — not a training gap.
- Sample 20 lost deals and 10 won deals. Read the notes. Count how many losses involved a single contact at the account. Single-threaded deals losing at a much higher rate is one of the most common and most fixable patterns.
- Audit 500 contact records against reality. Run them through an email verifier and check what percentage are invalid, catch-all, or role-based. This number usually shocks people.
- Time-study two reps for one week. Log where hours actually go. If research and list-building consume more than eight hours a week per rep, automation pays for itself before any coaching does.
- Write one sentence. "Our biggest constraint is ___, evidenced by ___." If you cannot fill that in from the data, run step 2 again with cleaner segmentation.
The output is a single constraint, not a list of nine improvement areas. Lists of nine produce zero completed changes.
Is better data really more valuable than better technique?#
For most teams under 50 reps, yes — and the math is not close.
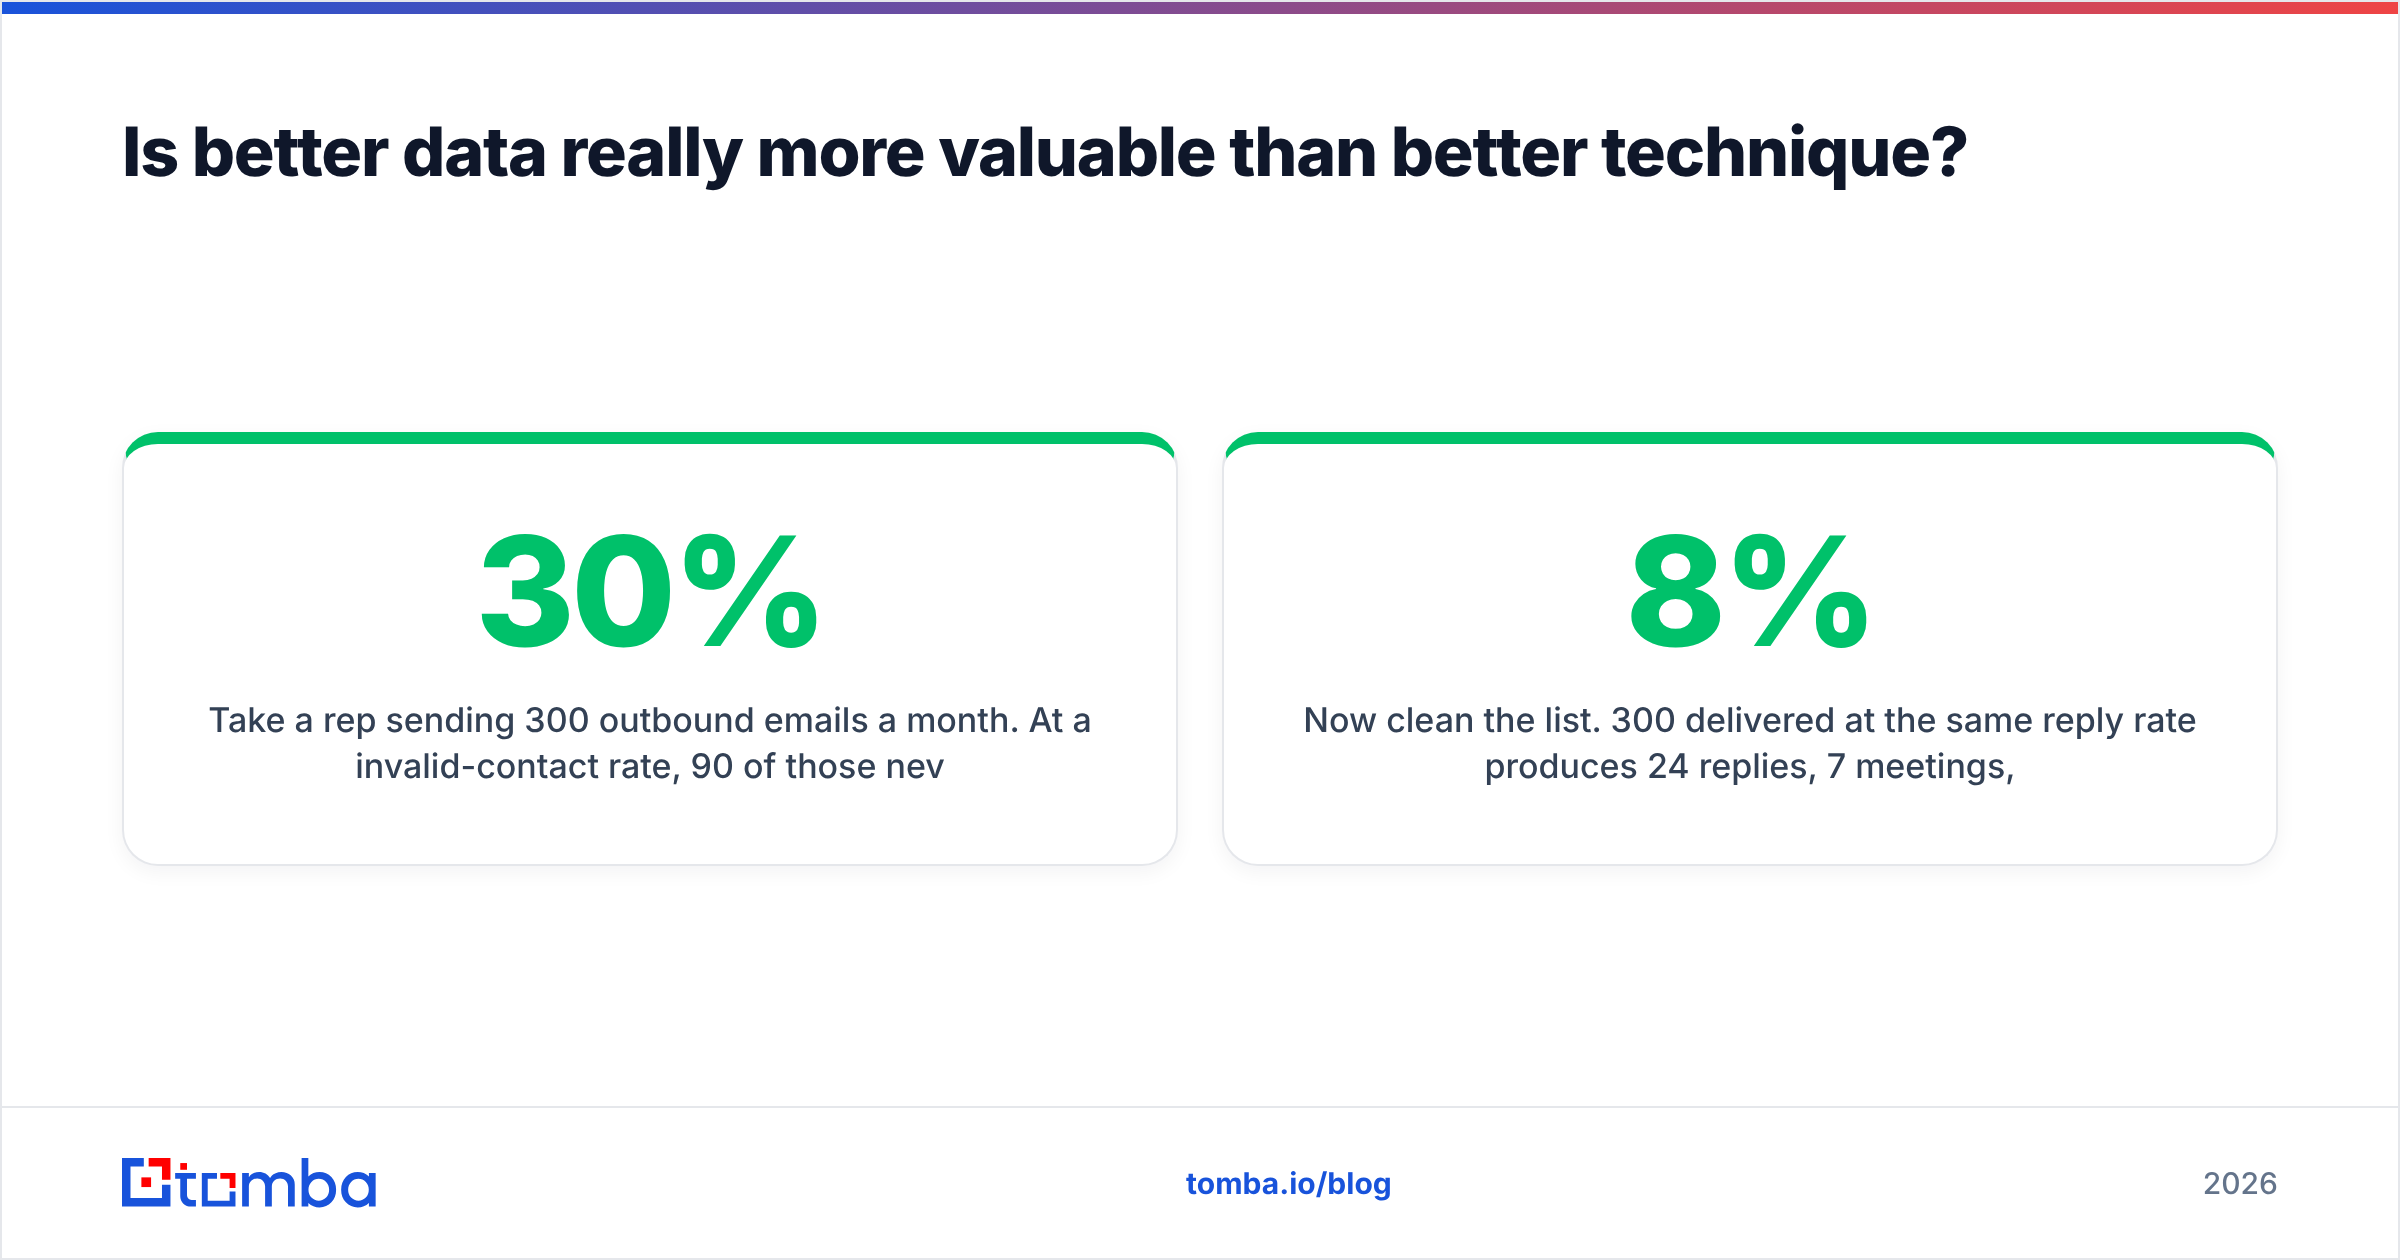
Take a rep sending 300 outbound emails a month. At a 30% invalid-contact rate, 90 of those never land, and the bounces damage domain reputation, which further suppresses the 210 that do. Suppose the pipeline math is 210 delivered → 8% reply → 17 replies → 5 meetings → 2 opportunities → 0.5 wins.
Now clean the list. 300 delivered at the same 8% reply rate produces 24 replies, 7 meetings, roughly 3 opportunities. That is a 40%+ improvement in pipeline generated with zero change to the rep's skill, script, or hours worked. Better sender reputation typically nudges the reply rate up as well, compounding the gain.
Compare that to a coaching intervention. Realistically, a strong quarter of coaching moves one rep's meeting-to-opportunity conversion by five to ten points. That is real and worth doing — it is simply slower, harder to scale, and decays when the rep leaves.
The uncomfortable version: technique improvements are personal and perishable; data and process improvements are structural and permanent. Fix the structure first.
This is also why data enrichment tends to outperform new headcount as a budget line. Enriching an existing account list with verified contacts, direct dials, and firmographics raises the productivity of every rep simultaneously. A new hire raises capacity by one rep and takes five months to ramp.
How do the main performance levers compare?#
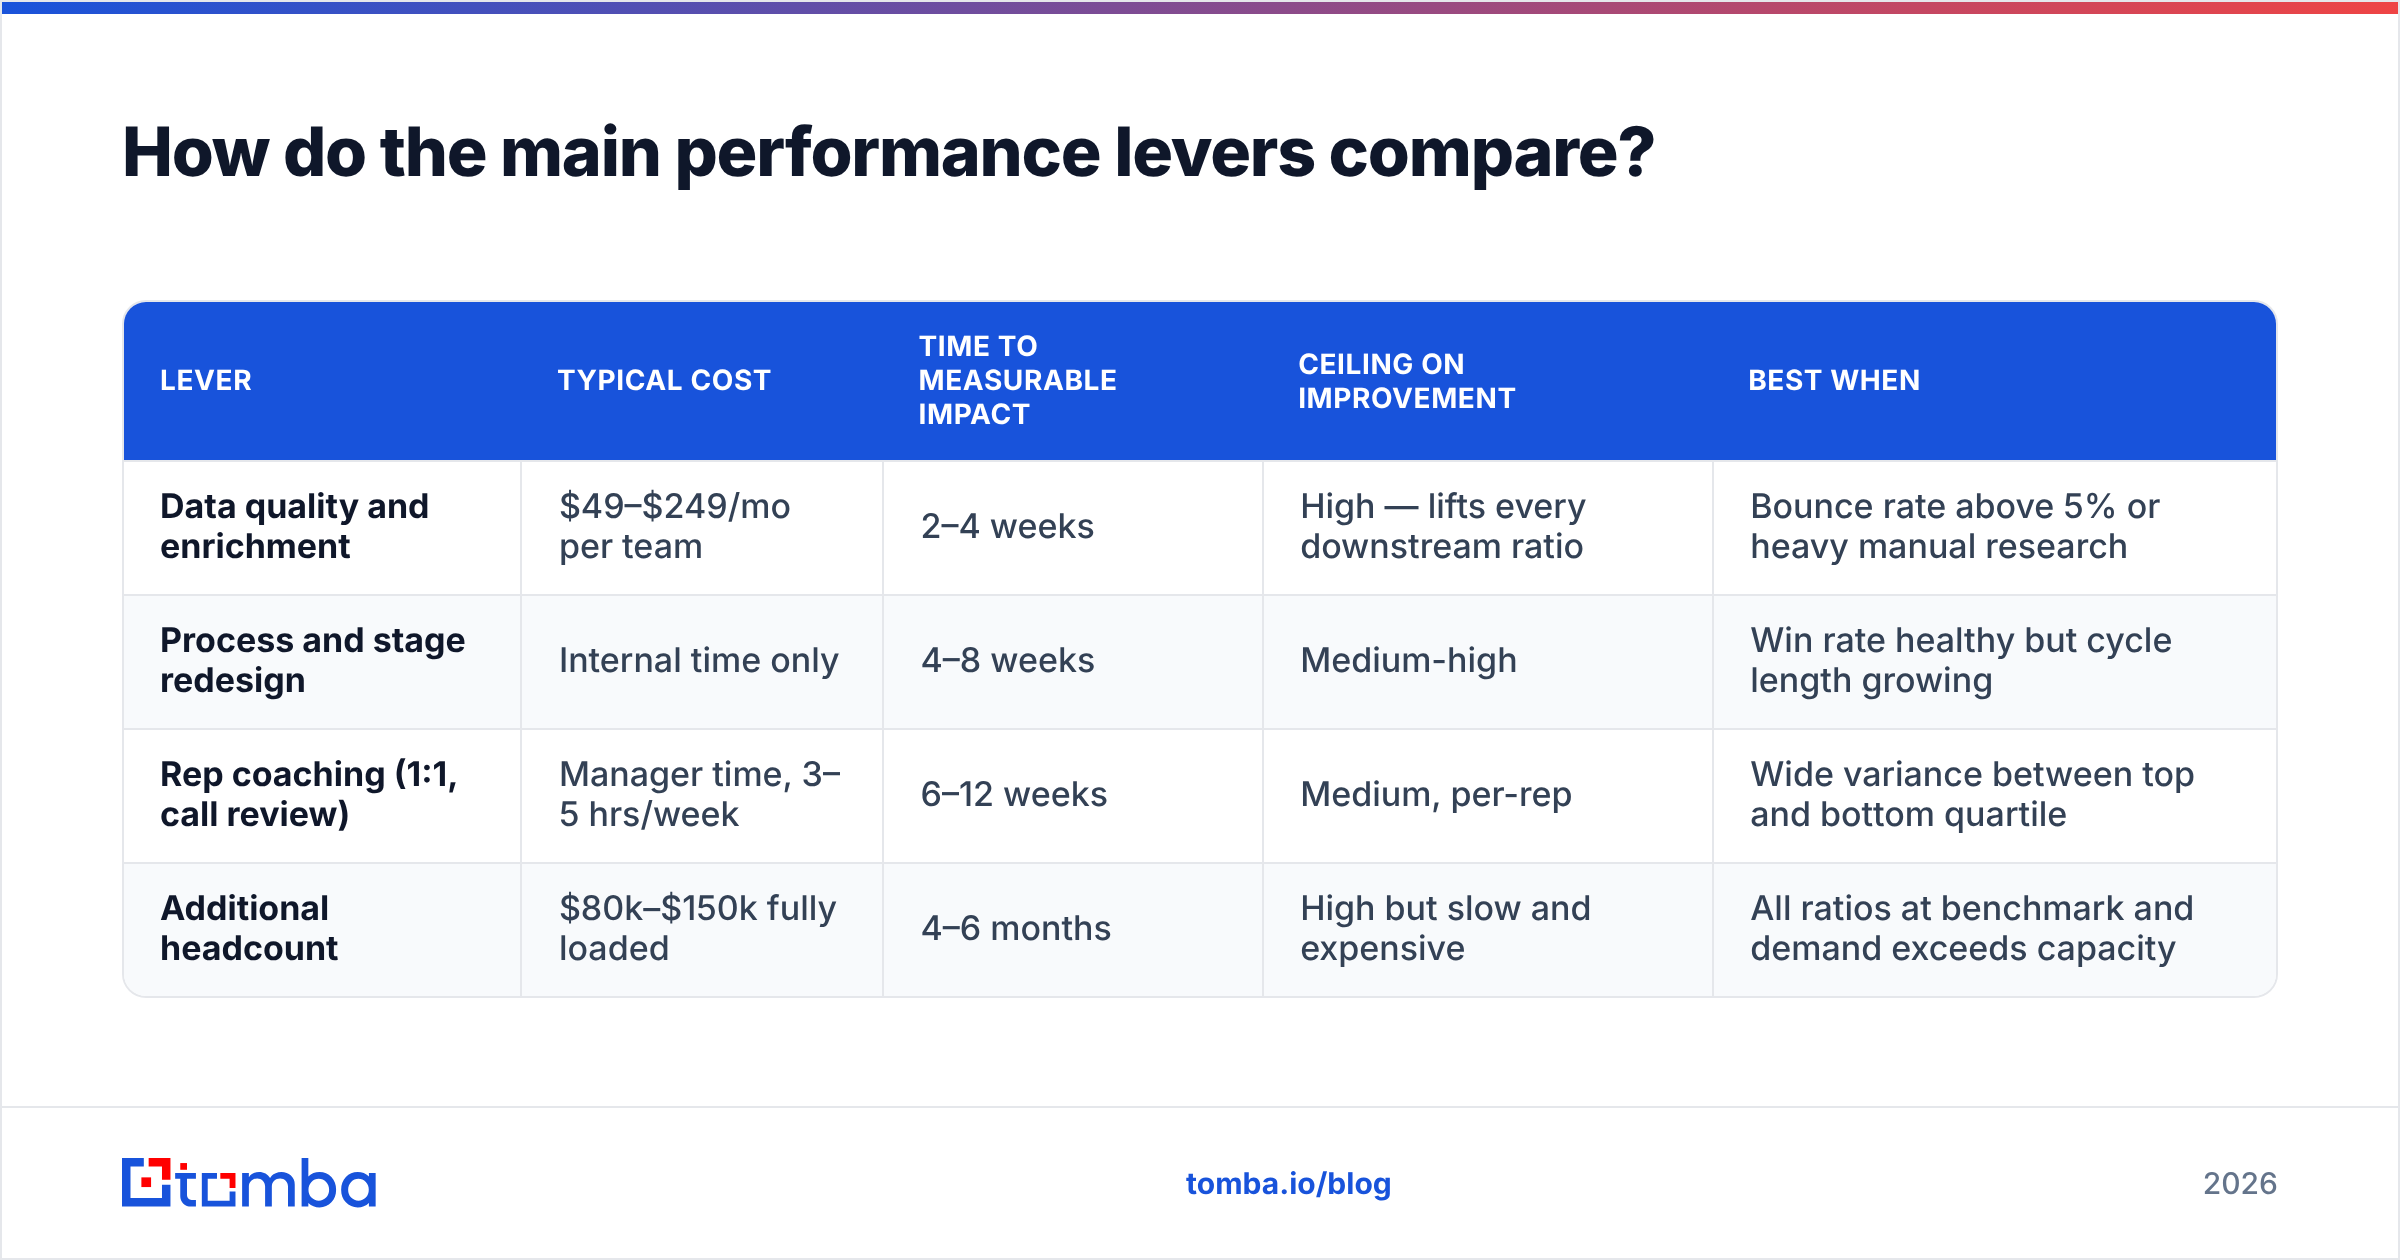
Four levers, ranked honestly on what they cost and how fast they pay back.
| Lever | Typical cost | Time to measurable impact | Ceiling on improvement | Best when |
|---|---|---|---|---|
| Data quality and enrichment | $49–$249/mo per team | 2–4 weeks | High — lifts every downstream ratio | Bounce rate above 5% or heavy manual research |
| Process and stage redesign | Internal time only | 4–8 weeks | Medium-high | Win rate healthy but cycle length growing |
| Rep coaching (1:1, call review) | Manager time, 3–5 hrs/week | 6–12 weeks | Medium, per-rep | Wide variance between top and bottom quartile |
| Additional headcount | $80k–$150k fully loaded | 4–6 months | High but slow and expensive | All ratios at benchmark and demand exceeds capacity |
Note the ordering. Headcount is the last lever, not the first, because it is the only one that does not improve the performance of anyone already on the team. Gartner's sales research has repeatedly pointed to seller productivity and buyer-enablement friction — not seller count — as the dominant constraint in complex B2B sales.

How should you coach so improvements actually stick?#
Coaching fails when it is broad, infrequent, and untethered to a metric. Make it narrow, weekly, and numeric.
- One behavior per rep per quarter. Not "improve discovery." Instead: "ask about the current process before pitching, on every first call." Binary, observable, countable.
- Score calls against a two-item rubric, not a twelve-item one. Managers cannot reliably score twelve dimensions. They can reliably score two.
- Tie every coaching goal to one of the four ratios. If the behavior does not plausibly move contact rate, meeting conversion, opportunity conversion, or win rate, drop it.
- Use internal benchmarks, not external ones. Your top rep's meeting-to-opportunity rate is a more credible target than an industry average from a vendor report.
- Review the metric, not the effort, at 30 and 60 days. If the behavior changed but the ratio did not, the hypothesis was wrong. Kill it and pick another.
Salesforce's State of Sales research consistently finds that high-performing teams differ less in effort than in how tightly their process is defined and how quickly reps get feedback on it. Speed of feedback is a manager behavior you can change this week for free.
What should your tooling stack actually do?#
Keep it small. Every tool you add costs adoption, and adoption is the scarcest resource on a sales team.
The functional minimum:
- A CRM that reflects reality. Stages defined by buyer actions, not seller optimism. If "demo scheduled" can sit in the pipeline for 90 days, your stages are wrong.
- A contact data source with verification built in. Finding an email is easy; knowing it is deliverable is the part that protects your domain. Look for tools that return a confidence score and flag catch-all domains rather than guessing.
- A sequencer with reply detection. Any tool that keeps emailing someone who replied is actively destroying performance.
- Conversation capture. You cannot coach what you cannot hear.
On the data side, Tomba pricing starts with a free tier at 25 searches a month, then Starter at $49/mo, Growth at $99/mo, and Pro at $249/mo — which puts verified contact data well below the cost of the hours reps currently spend building lists by hand. Peers worth evaluating alongside it include BookYourData for pre-built verified B2B lists, and the broader enrichment vendors if you need deep firmographic layers. Compare on match rate against your target accounts, not on the vendor's published database size; total record count is the least predictive number in the category.
For teams processing large lists, a bulk email finder workflow that verifies before export removes the single biggest cause of suppressed contact rates.
How do you know it worked?#
Set the measurement window before you start, not after.
- Weekly, leading: contact rate, replies, meetings booked, new opportunities created. These tell you whether the change is taking hold.
- Monthly, lagging: win rate, average deal size, cycle length, pipeline coverage. These tell you whether it mattered.
- Quarterly, structural: revenue per rep, ramp time for new hires, percentage of quota attained by the median rep. Median, not average — averages hide a broken middle.
The single most useful chart is a stage-conversion waterfall compared quarter over quarter. If the change you made was real, exactly one bar moves. If three bars move, something else happened and you should find out what before you take credit for it.
One caution: give any change a full sales cycle before judging it. Killing a working intervention at week four because the win rate has not moved yet is the most common self-inflicted wound in sales management.
Where to start this week#
Pick the constraint, not the wish list. Export 90 days of pipeline, compute the four ratios, and compare them against the benchmark table above. If your bounce rate is above 5% or your reps are spending hours a week hunting for contact details, your constraint is data — and that is the fastest thing on this page to fix.
Start there with the Tomba Email Finder: find verified professional emails by name, domain, or company, with verification and confidence scoring built into the same workflow so nothing untested reaches your sequencer. The free tier covers 25 searches a month, which is enough to audit a sample of your existing list and see exactly how much performance your data is currently costing you.
Related guides#
// get started
Find, verify and enrich your first contacts today
Start on the free plan with 25 searches a month, then scale when your team is ready.
Free plan · No credit card required · GDPR & CCPA
// about the author