How to Measure ABM Success: The Metrics That Actually Matter
Most ABM dashboards track engagement no CFO cares about. Here is the account-level measurement framework — leading, lagging, and efficiency metrics — that survives a board review.
TL;DR
- Measure ABM at the account level, never the lead level. If your dashboard counts MQLs, you are measuring demand gen with an ABM label on it.
- Use three metric tiers: leading (account coverage, engagement lift), lagging (pipeline, win rate, ACV, cycle length), and efficiency (cost per opportunity, pipeline-to-spend).
- Set a control group before launch. Without a matched non-target cohort, every number you report is correlation.
- Expect 6–9 months before lagging metrics stabilize for enterprise deals. Report leading indicators in months 1–3 or you will lose budget.
- Your contact data quality caps your ceiling. Bad emails inflate reach and deflate every downstream ratio.
Account-based marketing gets killed in budget reviews for one reason: the team reports engagement while finance asks about revenue. This guide gives you the measurement stack that closes that gap — what to track, when each metric becomes trustworthy, and how to build the account scorecard you present to your board.
What Does "ABM Success" Actually Mean?#
Success in ABM means named target accounts move through buying stages faster and close at higher value than comparable non-target accounts. That is the whole definition. Everything else is diagnostics.
The distinction matters because ABM inverts the funnel. Traditional demand gen captures volume and filters down. ABM picks the accounts first, then manufactures demand inside them. So volume metrics — form fills, MQL counts, email opens — describe an activity you did not set out to perform.
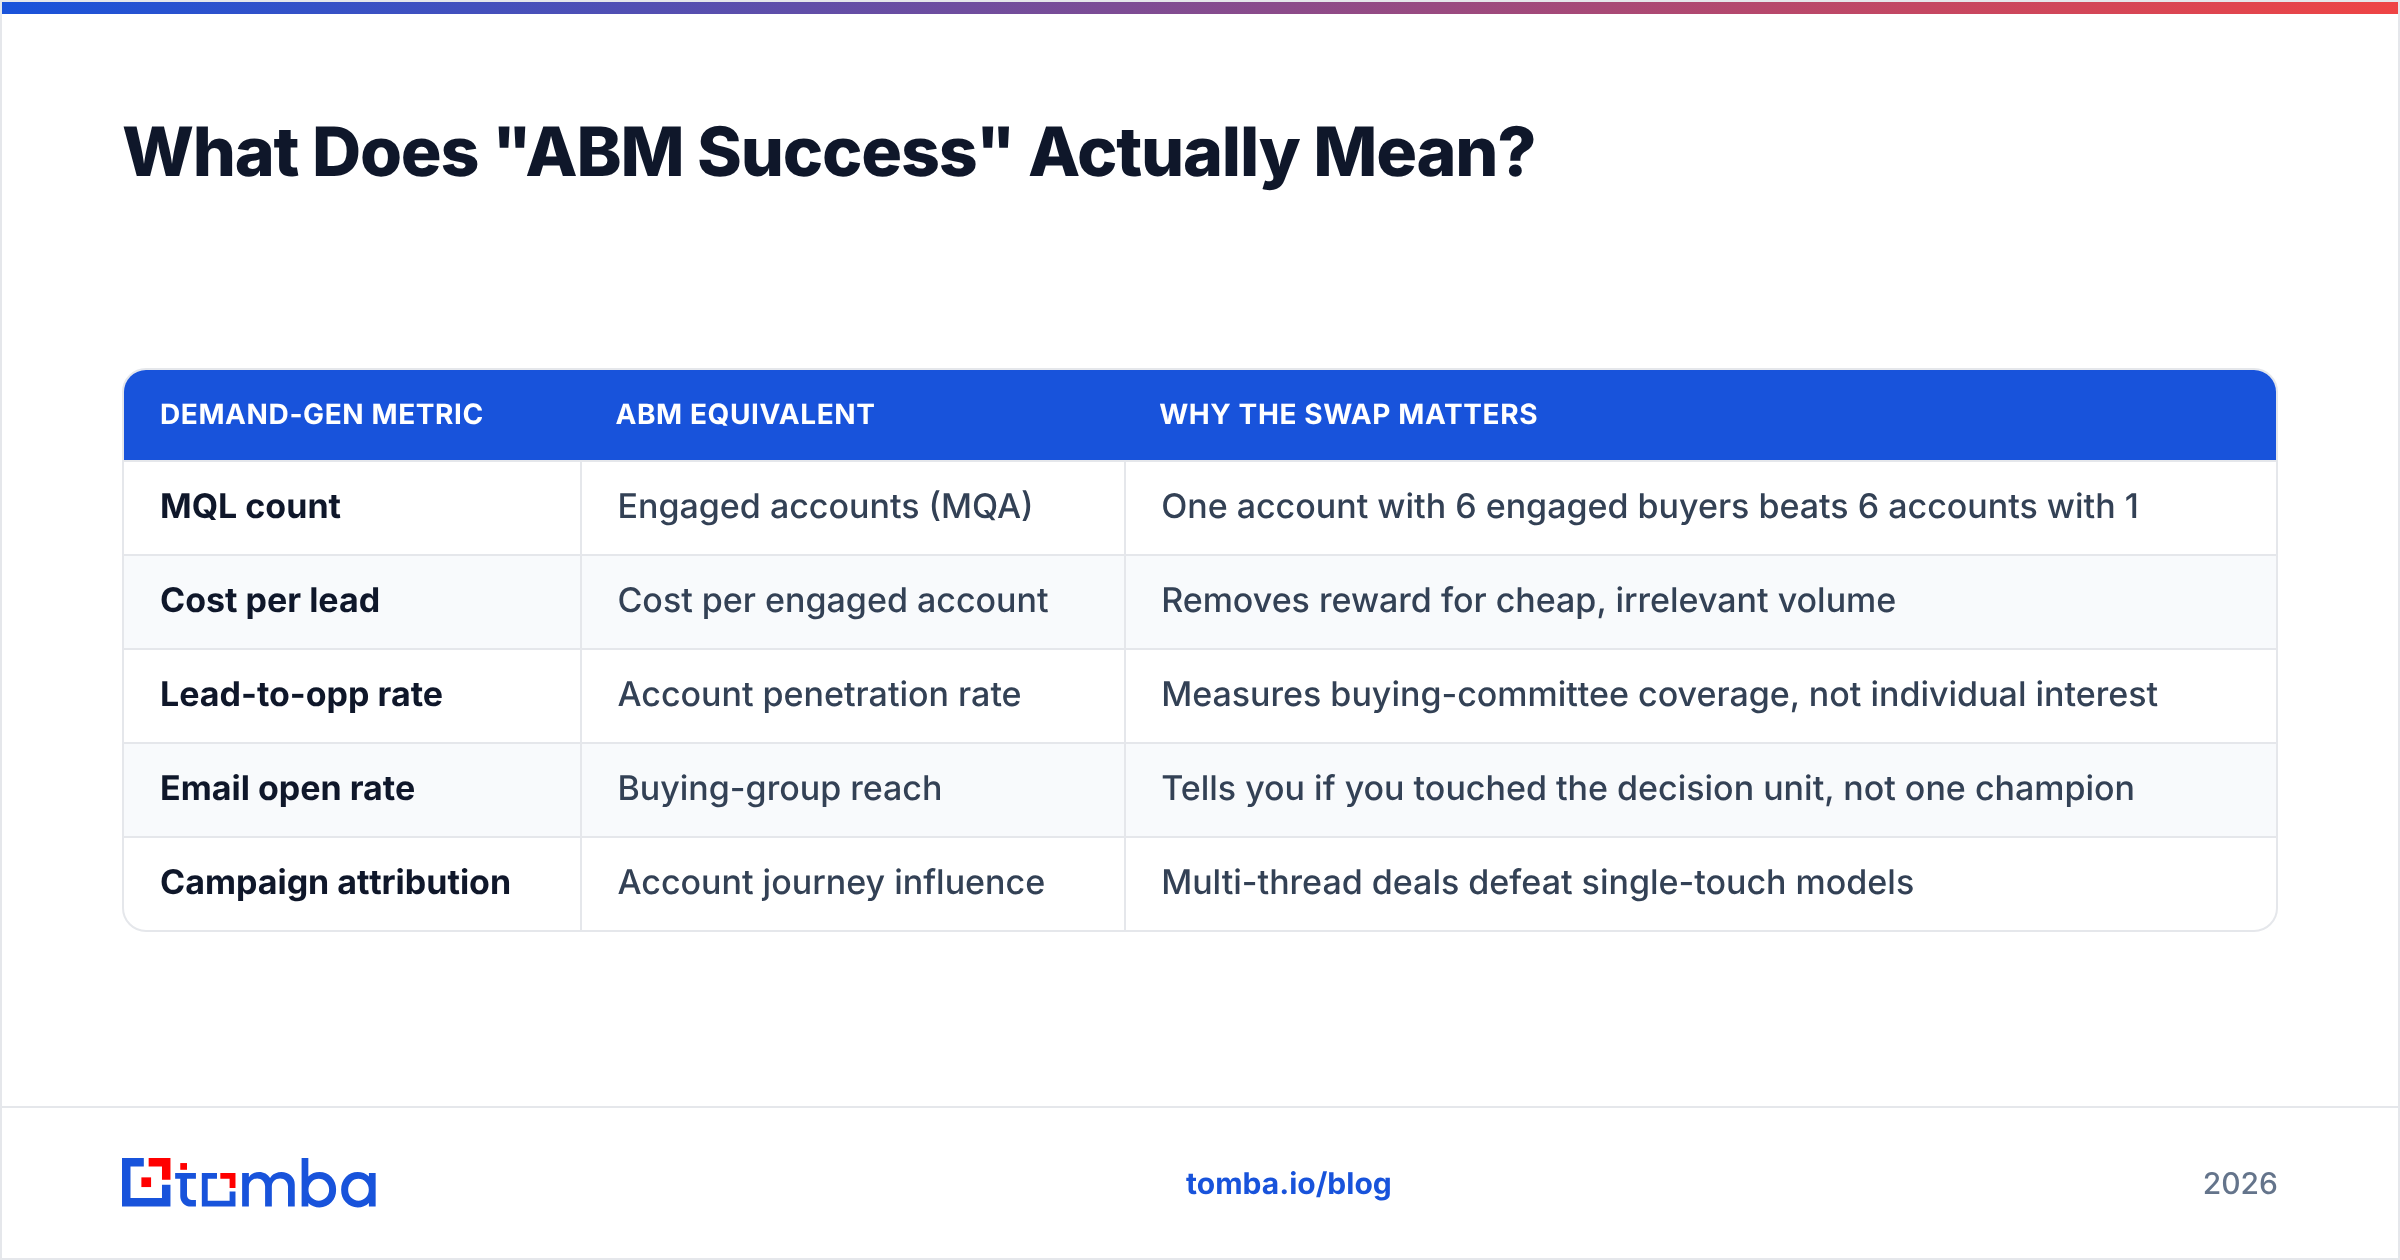
Here is the translation table teams need on the wall:
| Demand-gen metric | ABM equivalent | Why the swap matters |
|---|---|---|
| MQL count | Engaged accounts (MQA) | One account with 6 engaged buyers beats 6 accounts with 1 |
| Cost per lead | Cost per engaged account | Removes reward for cheap, irrelevant volume |
| Lead-to-opp rate | Account penetration rate | Measures buying-committee coverage, not individual interest |
| Email open rate | Buying-group reach | Tells you if you touched the decision unit, not one champion |
| Campaign attribution | Account journey influence | Multi-thread deals defeat single-touch models |
If your reporting layer cannot produce the right-hand column, your first ABM project is a data project, not a campaign.

What Are the Leading Indicators You Should Track First?#
Leading indicators tell you whether the program is working before revenue arrives. For enterprise ABM, that gap is often two to three quarters — long enough to lose your budget if you have nothing to show.
Track these five in months 1–3:
- Account coverage — the percentage of your target list where you hold verified contact data for every buying-committee role. Target 80%+ before you spend a dollar on ads. A "target account" with one stale contact is not covered.
- Buying-group reach — how many distinct roles inside an account you have actually touched. Gartner's research on B2B buying groups puts the typical enterprise committee between 6 and 10 people. Reaching two of them is not reach.
- Engagement lift — engagement rate of target accounts versus a matched control cohort. This is the single most defensible leading metric because it controls for market conditions.
- Account penetration depth — new contacts added per account per month. A flat line here means your data sourcing stalled and your program will plateau in 60 days.
- Intent-to-outreach latency — hours between an intent signal firing and a human touch landing. Under 48 hours is competitive; over a week and the signal is noise.
Coverage is where most programs quietly fail. You build a beautiful list of 250 dream accounts, then discover you have working contact details for 40% of the committee. Running a domain search across the target list before launch turns that from a surprise into a scoping number, and a bulk email finder pass tells you exactly which accounts are actually reachable.
How Do You Measure ABM Pipeline and Revenue Impact?#
Lagging metrics are what finance signs off on. There are four that matter, and they should be reported as target-vs-control comparisons, never as raw totals.
Pipeline created from target accounts. Total qualified pipeline value sourced from the named list, divided by the list size. Report it per account, not in aggregate — aggregate hides the fact that three whales carried the quarter.
Win rate delta. Target-account win rate versus non-target. Healthy ABM programs show a 10–30% relative lift by month nine. If you see zero lift after four quarters, your account selection is wrong, not your creative.
Average contract value delta. ABM should raise deal size because you deliberately chose larger, better-fit accounts and reached more of the committee. A flat ACV with rising cost is the classic sign of an ABM program that is really just targeted advertising.
Sales cycle length. Multi-threading usually shortens cycles by removing the single-champion bottleneck. Measure from first meaningful account engagement to closed-won, not from opportunity creation — opportunity creation dates get backdated by reps and will lie to you.
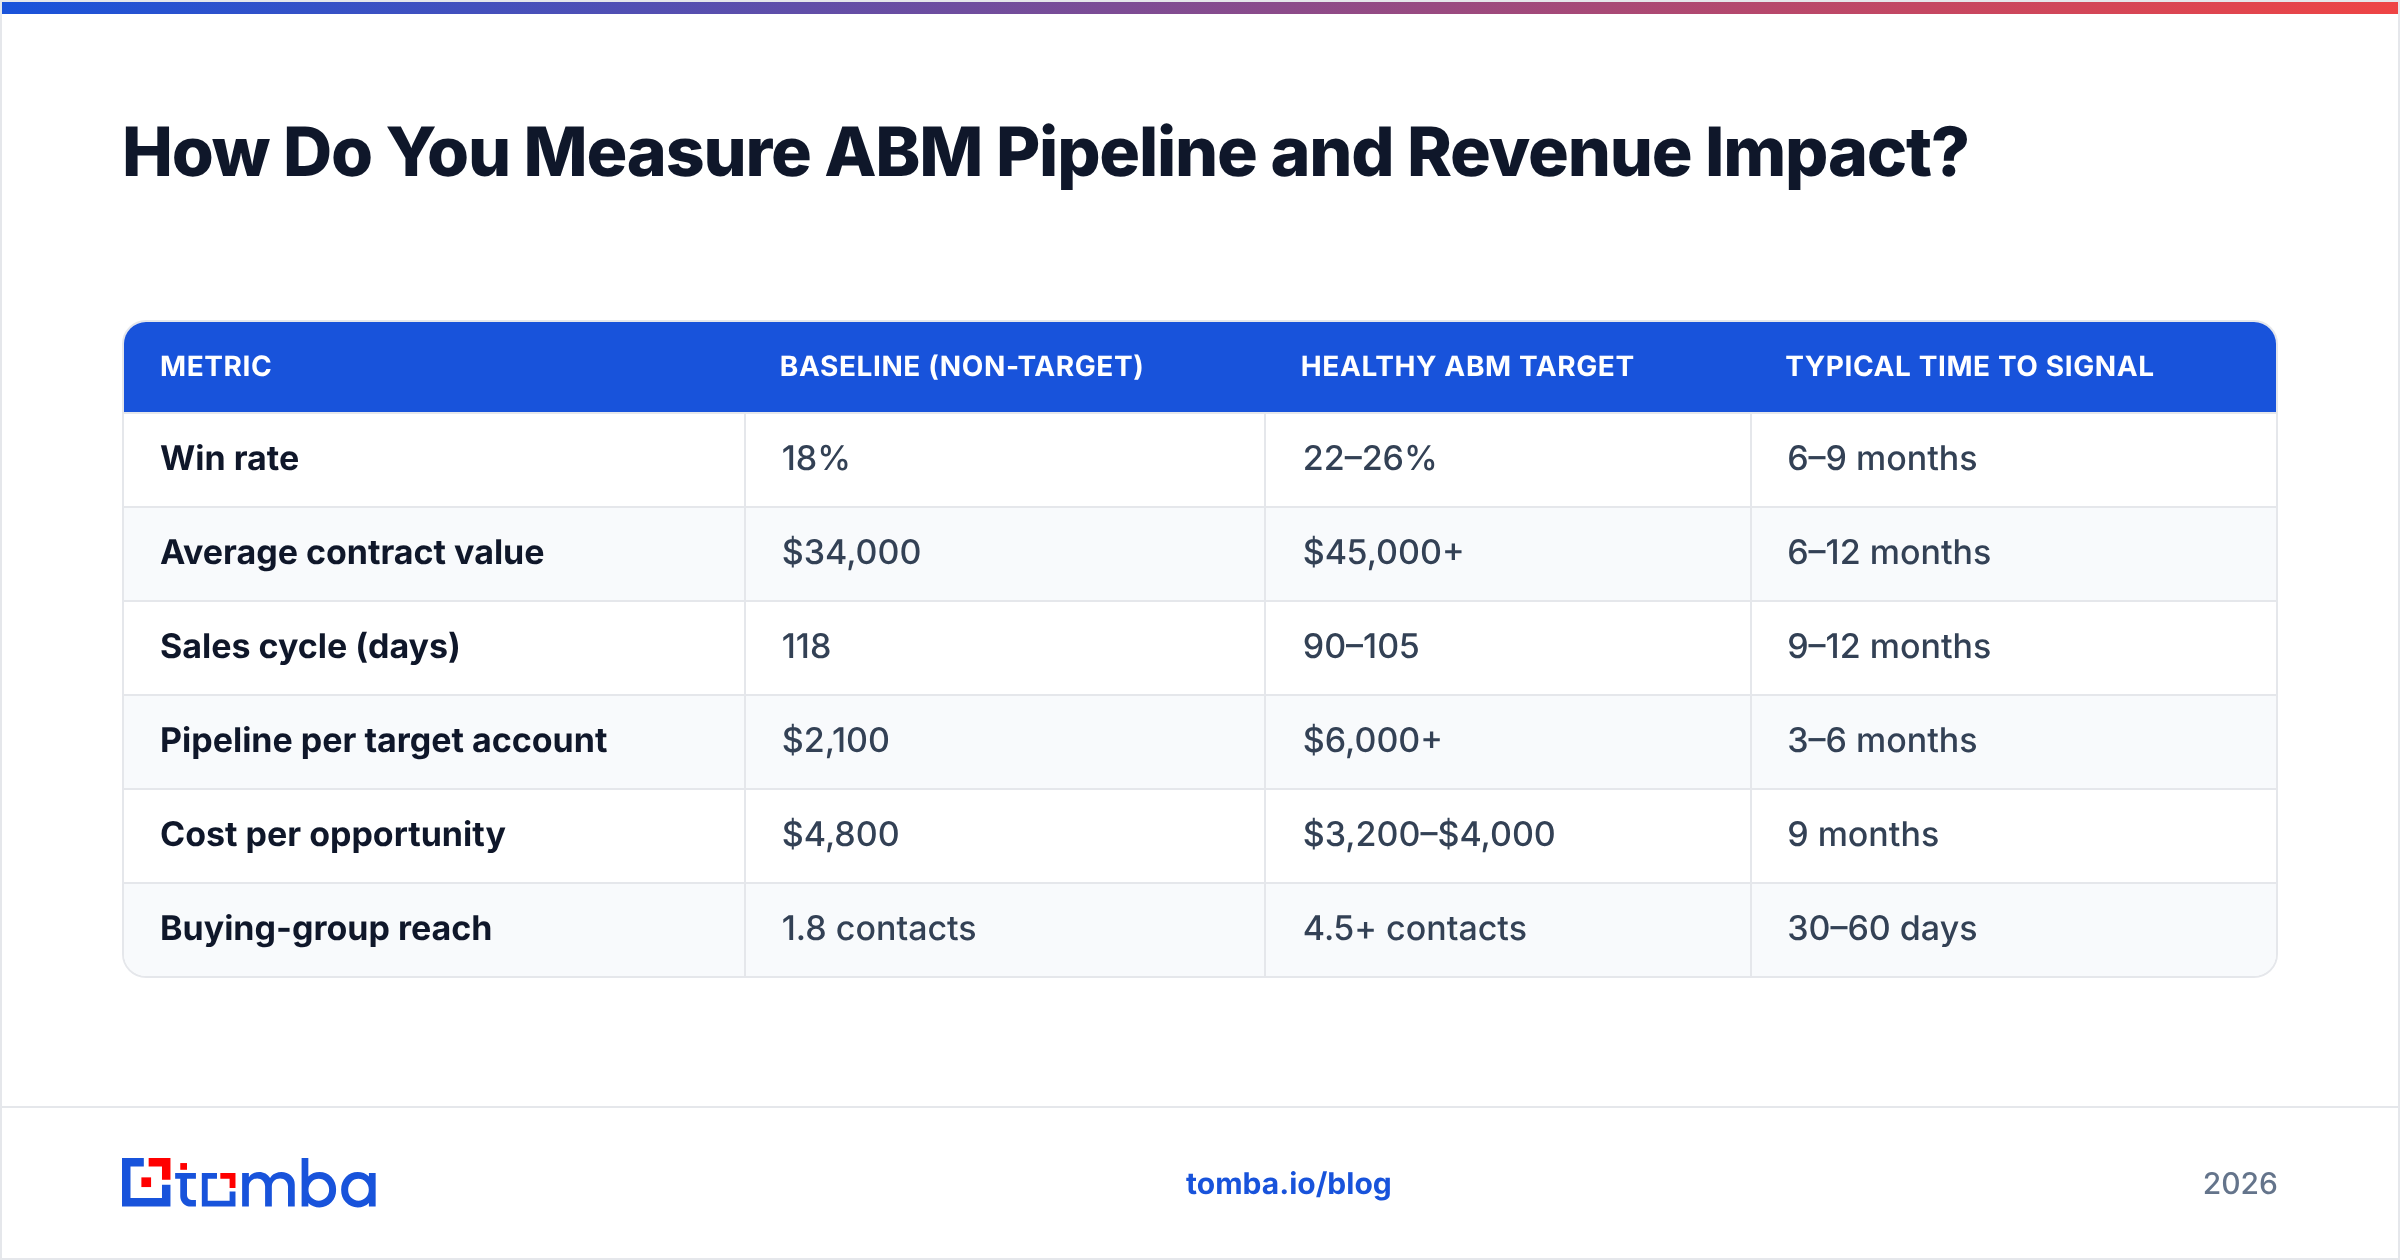
| Metric | Baseline (non-target) | Healthy ABM target | Typical time to signal |
|---|---|---|---|
| Win rate | 18% | 22–26% | 6–9 months |
| Average contract value | $34,000 | $45,000+ | 6–12 months |
| Sales cycle (days) | 118 | 90–105 | 9–12 months |
| Pipeline per target account | $2,100 | $6,000+ | 3–6 months |
| Cost per opportunity | $4,800 | $3,200–$4,000 | 9 months |
| Buying-group reach | 1.8 contacts | 4.5+ contacts | 30–60 days |
Treat those benchmarks as shapes, not laws. Your absolute numbers depend on segment and price point; the direction and gap between columns is the finding.
Why Does a Control Group Change Everything?#
Without a control group you cannot separate ABM's effect from a good quarter. This is the difference between a report and an argument.
Build the control by taking your target list criteria — industry, headcount band, tech stack, region — and selecting a second cohort that matches on all of them but receives no ABM treatment. Size it at 30–50% of the target list. Then compare the same metrics across both.
Three rules keep the comparison honest:
- Freeze the cohorts. Adding accounts mid-quarter because they showed intent contaminates the control.
- Match on firmographics, not on behavior. Selecting the control from accounts that never engaged guarantees you "win."
- Report the delta, not the absolute. "Target accounts closed at 24%" is meaningless. "Target accounts closed 6 points above matched control" is a budget defense.
Forrester's work on account-based measurement makes the same point from the analyst side: the credibility of ABM reporting rests on comparability, not on volume of dashboards.
What Metrics Should You Stop Reporting?#
Cut these from the executive deck. Keep them in the diagnostics tab if your team finds them useful for optimization, but they do not belong in a board conversation.
- Impressions and reach on display. Buying an audience is not engaging it.
- Raw email open rate. Apple Mail Privacy Protection and similar proxies have made this number structurally unreliable since 2021. Use reply rate and meeting rate instead.
- Total form fills. In ABM, a form fill from a non-target account is a distraction with a cost attached.
- Website sessions. Unless resolved to named accounts, sessions tell you nothing about your list.
- Content downloads. A gated PDF grabbed by a student intern is not buying intent.
The replacement for most of these is account-resolved behavior: which named accounts visited, which roles, how often, and whether that frequency is climbing. Website visitor identification converts anonymous traffic into that account-level signal, which is the only form in which web data belongs in an ABM report.
How Do You Build an ABM Scorecard That Survives a Board Review?#
Structure the scorecard in three panels and present them in this order. The order is doing work — it walks the reader from inputs to outcomes, which preempts the "how do we know this caused that" question.
Panel 1 — Program inputs (monthly). Target list size, coverage percentage, contacts per account, spend by channel, intent signals actioned. This panel proves the machine is running.
Panel 2 — Engagement (monthly). Engaged accounts, buying-group reach, engagement lift versus control, meetings booked from target accounts. This is your early-warning system; a drop here predicts a pipeline drop 60–90 days out.
Panel 3 — Revenue (quarterly). Pipeline per target account, win rate delta, ACV delta, cycle length, cost per opportunity, and program ROI. Quarterly only — monthly revenue reporting on a nine-month cycle creates noise that will get your program killed during a slow month.
A workable ROI formula for ABM:
ABM ROI = (Target-account closed-won revenue − Control-adjusted baseline revenue − Program cost) ÷ Program cost
The control adjustment is what keeps you honest. Subtract the revenue those accounts would plausibly have produced anyway, estimated from your control cohort's per-account revenue. Most teams skip this step and end up reporting a 900% ROI nobody believes.
For revenue operations teams, the scorecard should live in the CRM, not in a slide. Pipe account-level engagement back into HubSpot or Salesforce as custom account properties so the scorecard regenerates itself and the sales team sees the same numbers marketing does.
How Does Data Quality Cap Your ABM Measurement?#
Every ABM ratio has contact data in its denominator, which means data quality silently sets your ceiling.
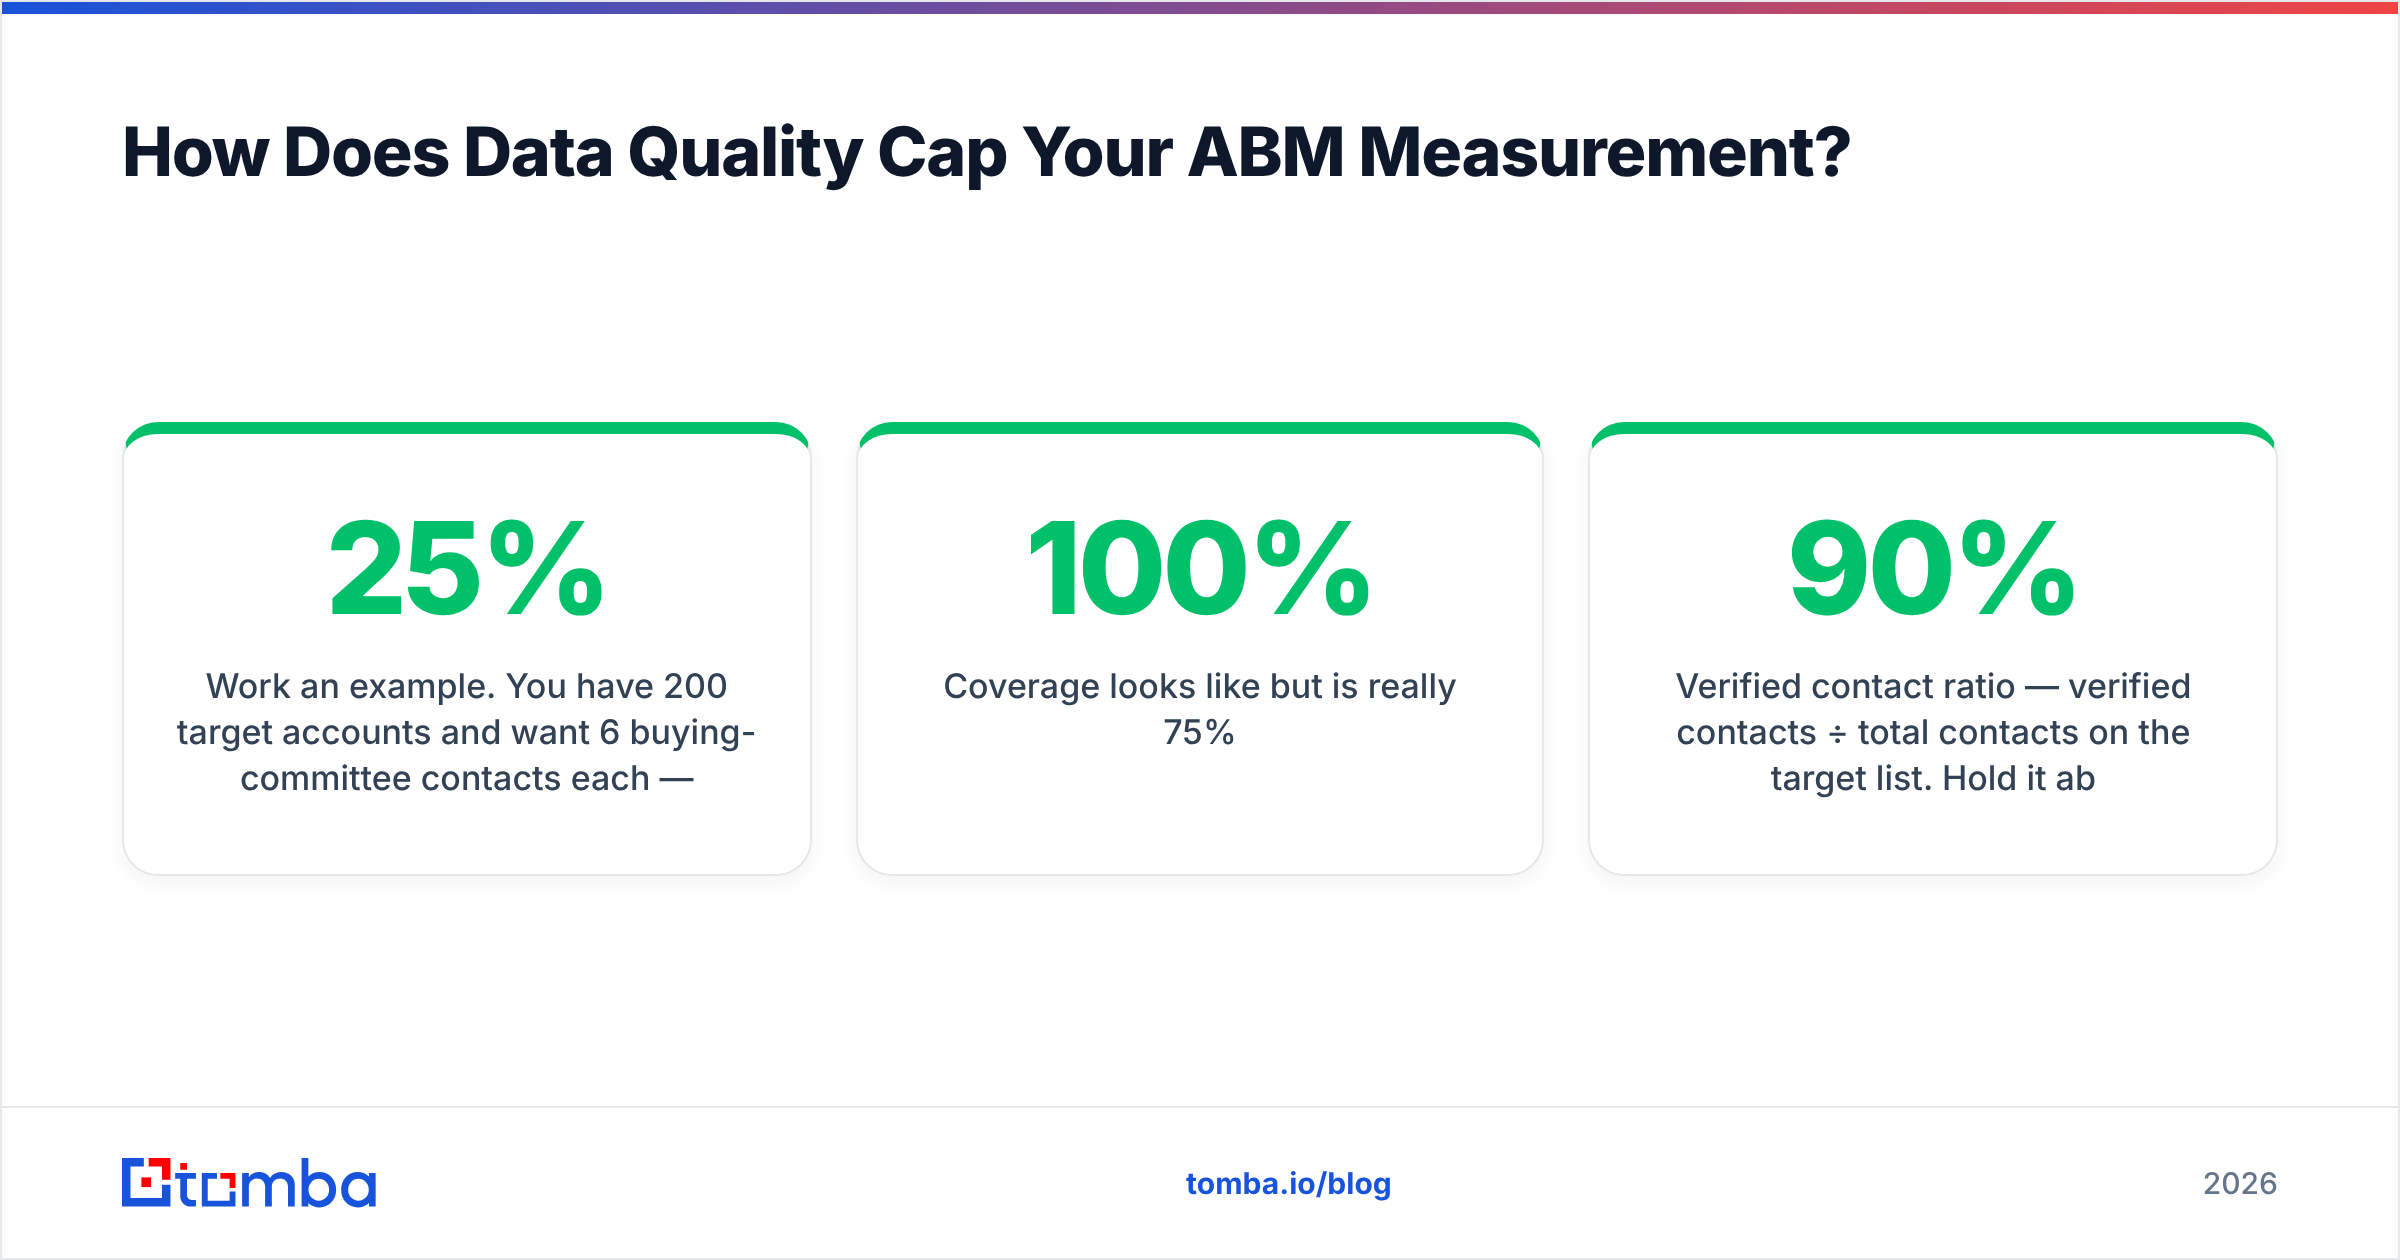
Work an example. You have 200 target accounts and want 6 buying-committee contacts each — 1,200 contacts. If 25% of your emails are invalid or stale, you effectively have 900. Your reach metric now reports against a list that cannot receive mail, so:
- Coverage looks like 100% but is really 75%.
- Engagement rate is deflated because the denominator includes dead addresses.
- Deliverability degrades from bounces, which suppresses the accounts that are reachable.
- Cost per engaged account inflates by roughly a third, and you conclude the channel does not work.
That last one is the expensive failure. Teams kill working ABM programs because bad data made the efficiency metrics look terrible.
The fix is a hygiene step before every measurement cycle, not an annual cleanup. Run new contacts through an email verifier at the point of import, treat catch-all domains as a separate bucket rather than a pass or fail, and re-verify anything older than 90 days. Job-change churn in B2B runs high enough that a year-old list is a substantially different list.
Then track two data-health metrics alongside the program metrics:
- Verified contact ratio — verified contacts ÷ total contacts on the target list. Hold it above 90%.
- Committee completeness — the percentage of accounts with at least one verified contact in every required role. This is the number that predicts whether multi-threading is possible at all.
What Does a Realistic ABM Measurement Timeline Look Like?#
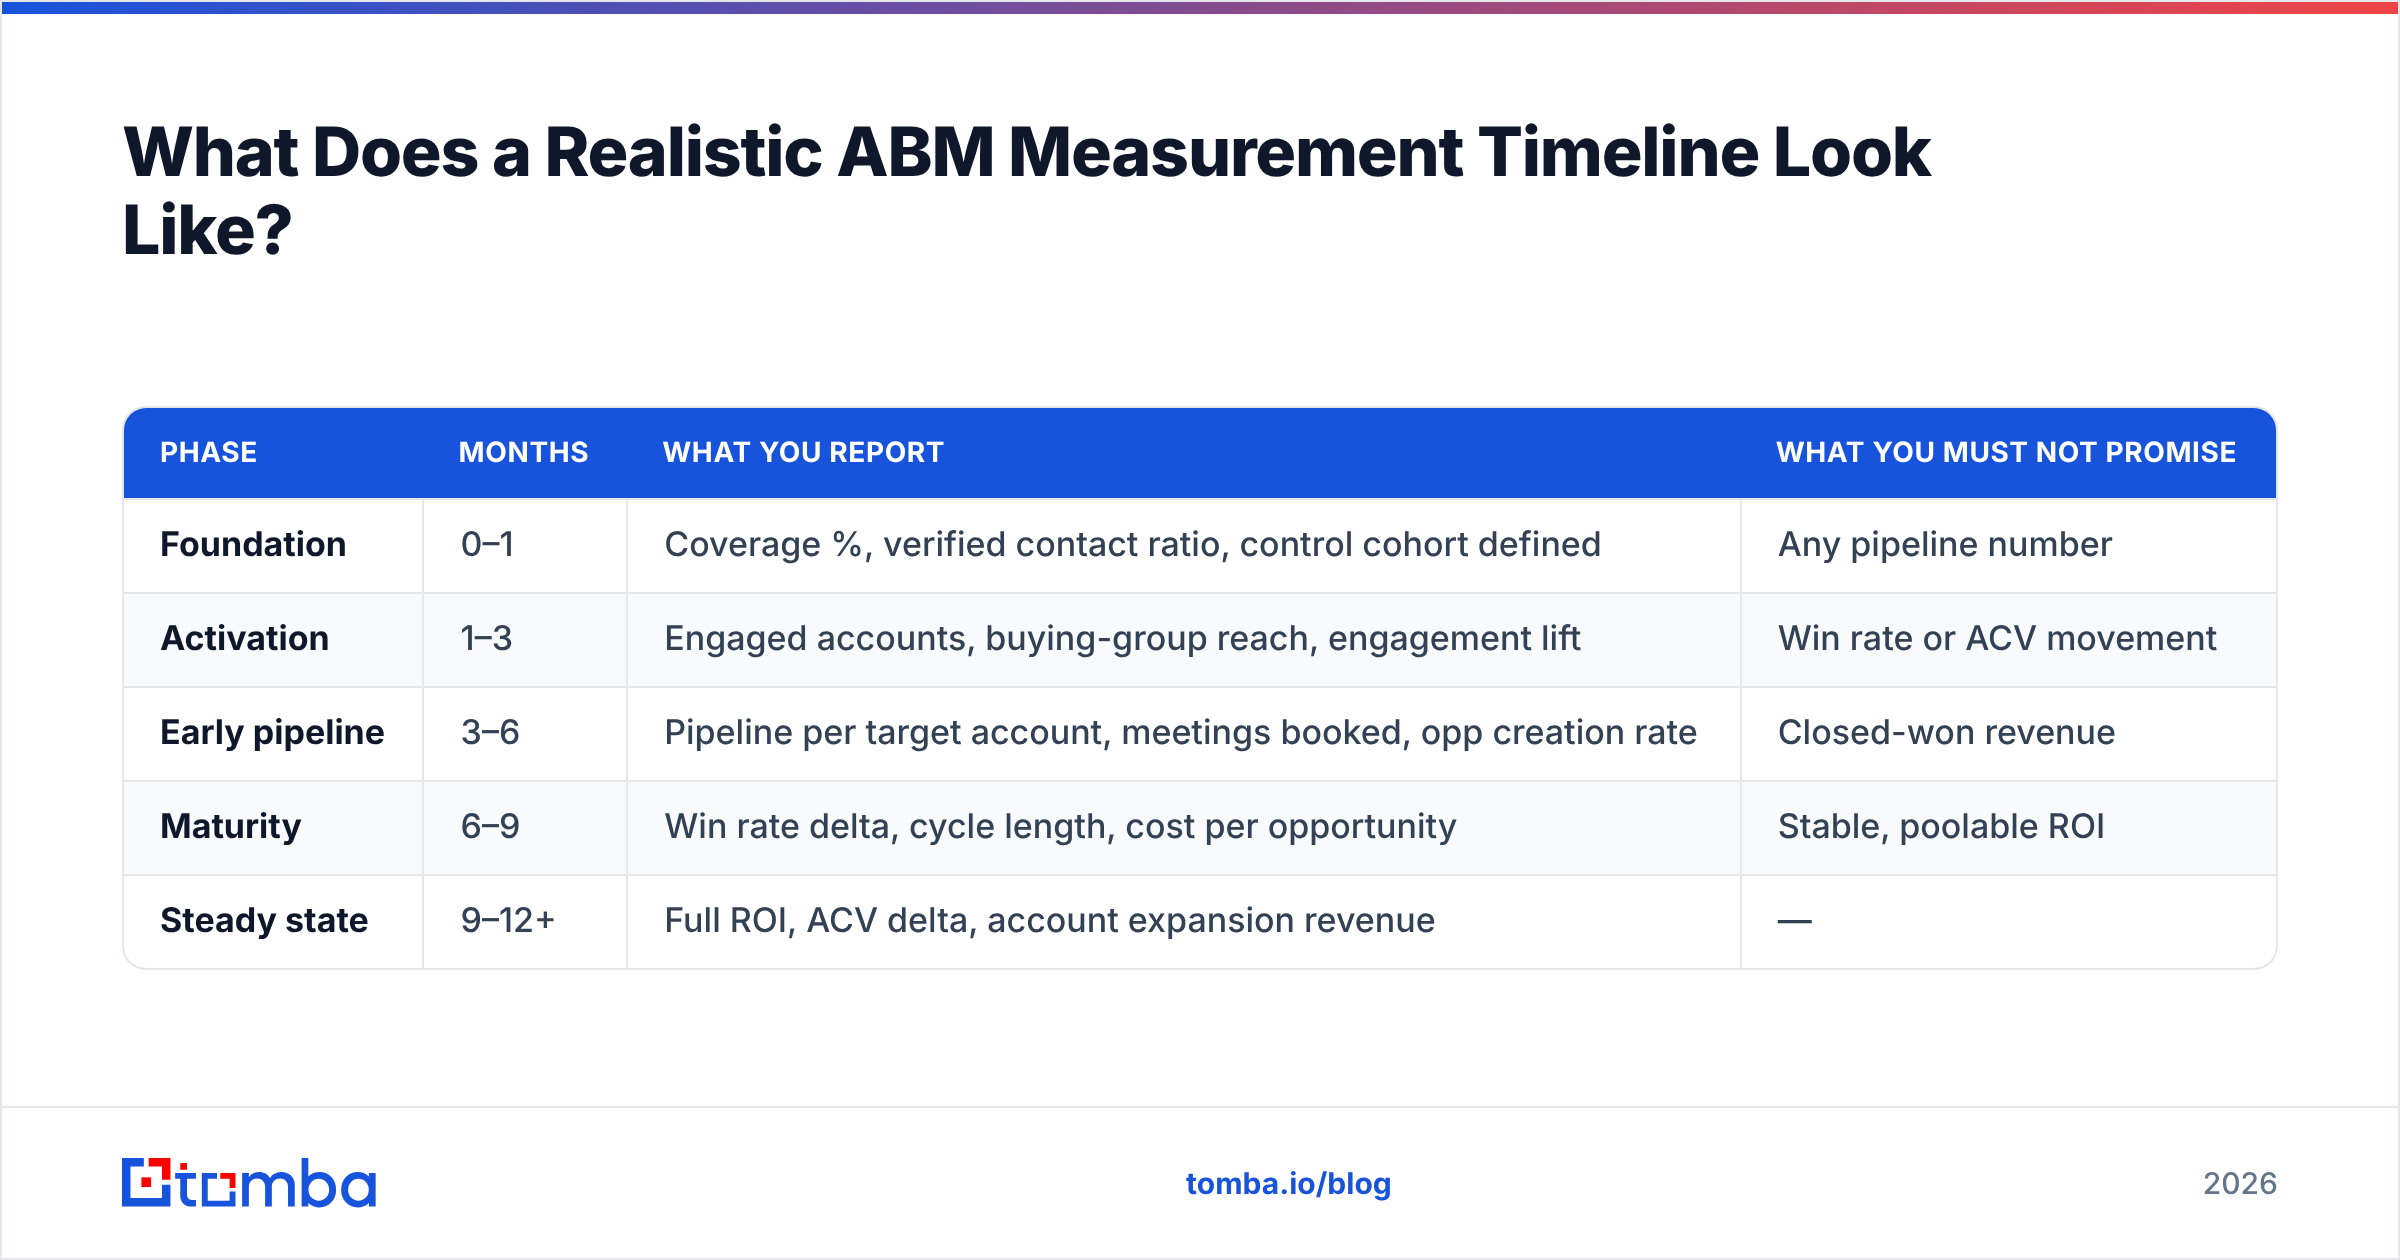
Set these expectations with your executive team in writing, before launch. Almost every "ABM failed" story is a timeline mismatch, not a performance one.
| Phase | Months | What you report | What you must not promise |
|---|---|---|---|
| Foundation | 0–1 | Coverage %, verified contact ratio, control cohort defined | Any pipeline number |
| Activation | 1–3 | Engaged accounts, buying-group reach, engagement lift | Win rate or ACV movement |
| Early pipeline | 3–6 | Pipeline per target account, meetings booked, opp creation rate | Closed-won revenue |
| Maturity | 6–9 | Win rate delta, cycle length, cost per opportunity | Stable, poolable ROI |
| Steady state | 9–12+ | Full ROI, ACV delta, account expansion revenue | — |
The trap sits at month four. Leading indicators look strong, pipeline is building, and someone asks for revenue. If you have not pre-committed to the timeline, you will be tempted to report a partial revenue number that a single lost deal can invalidate. Report the phase you are in.
How Do You Instrument Everything Without a Six-Figure Stack?#
You do not need a dedicated ABM platform to measure well. You need account-level identity, a place to store account properties, and reliable contact data. Concretely:
- Account list of record. A single source — CRM account objects, with a boolean target flag and a cohort field for target/control. Everything joins on this.
- Contact acquisition and enrichment. Fill the buying committee per account and keep it fresh. An email finder plus data enrichment covers the sourcing side; the Tomba API lets you re-run coverage checks on a schedule instead of by hand.
- Engagement capture. Route email replies, ad engagement, and resolved web visits into account properties, not just contact activity records.
- A reporting layer. A CRM dashboard or a warehouse. The requirement is that it can group by cohort and compute deltas — anything that cannot compute target-vs-control is a scoreboard, not a measurement system.
Total cost for a mid-market team running this well typically lands under $500/month in tooling. The expensive part is the discipline of freezing cohorts and reporting deltas — and that is free.
For comparison shoppers, most account-data vendors publish verified user reviews on G2 that are more useful than vendor benchmark pages; filter by company size to find reviewers whose data problem resembles yours.
Start With Coverage, Not Campaigns#
The measurement framework above collapses if you cannot reach the buying committee. Before you brief a single ad or write a sequence, run your target account list through Tomba's Email Finder and score your real coverage — how many of the 6–10 people who decide are actually reachable today. The free tier gives you 25 searches a month to test the list, Starter is $49/mo, and Growth at $99/mo covers most mid-market target lists; full Tomba pricing is on the site. Fix coverage first, then measure. Every ABM number you report afterward will hold up under questioning.
Related guides#
// get started
Find, verify and enrich your first contacts today
Start on the free plan with 25 searches a month, then scale when your team is ready.
Free plan · No credit card required · GDPR & CCPA
// about the author