How to Measure Account Based Marketing: A 2026 Framework
Most ABM dashboards report activity, not revenue. Here is the metric stack that actually proves account-based marketing works, plus the vanity numbers to delete this quarter.
TL;DR
- How to measure account based marketing, in one line: score the account, not the lead. If your dashboard still counts MQLs, you are measuring the wrong object.
- The seven metrics that survive a CFO review: account coverage, contact coverage, engagement lift, account penetration, pipeline velocity, win-rate delta, and ABM-influenced revenue per account.
- You need a pre-program baseline. Without a control group of non-target accounts, every number you report is unfalsifiable.
- Contact data quality is the silent killer — you cannot measure account penetration if you only hold 2 of 9 buying-committee emails.
- Expect 6–9 months before win-rate deltas are statistically meaningful. Report leading indicators in months 1–5 and say so explicitly.
Account-based marketing dies in the quarterly business review, not in the campaign. The campaign runs fine. Then someone asks what it returned. The marketer opens a dashboard full of impressions and "engaged accounts," and finance quietly moves the budget. This post covers how to measure account based marketing in a way that holds up in that room.
How to Measure Account Based Marketing: What It Really Means#
It means answering one question with evidence: did treating these specific accounts differently produce more revenue than treating them like everyone else?
That framing kills most standard marketing metrics immediately. Click-through rate does not answer it. Cost per lead does not answer it. Even "pipeline generated" falls short on its own, because pipeline from target accounts would have partially existed anyway.
The everyday analogy: it is like measuring whether a personal trainer works. You do not count gym visits (activity). You do not count the exercises you learned (engagement). You weigh yourself before, weigh a comparable friend who trained alone, and compare the gap after enough time has passed. Same logic, different unit — the account replaces the person.
Technically, this means every ABM metric needs three properties:
- Account-scoped — aggregated to the company, never the individual contact.
- Baselined — compared against either a pre-program period or a holdout set of similar non-target accounts.
- Time-bounded — measured over a window that matches your actual sales cycle, not the quarter your board deck is due.
Miss any one and the number is decoration.
Which ABM metrics actually matter in 2026?#
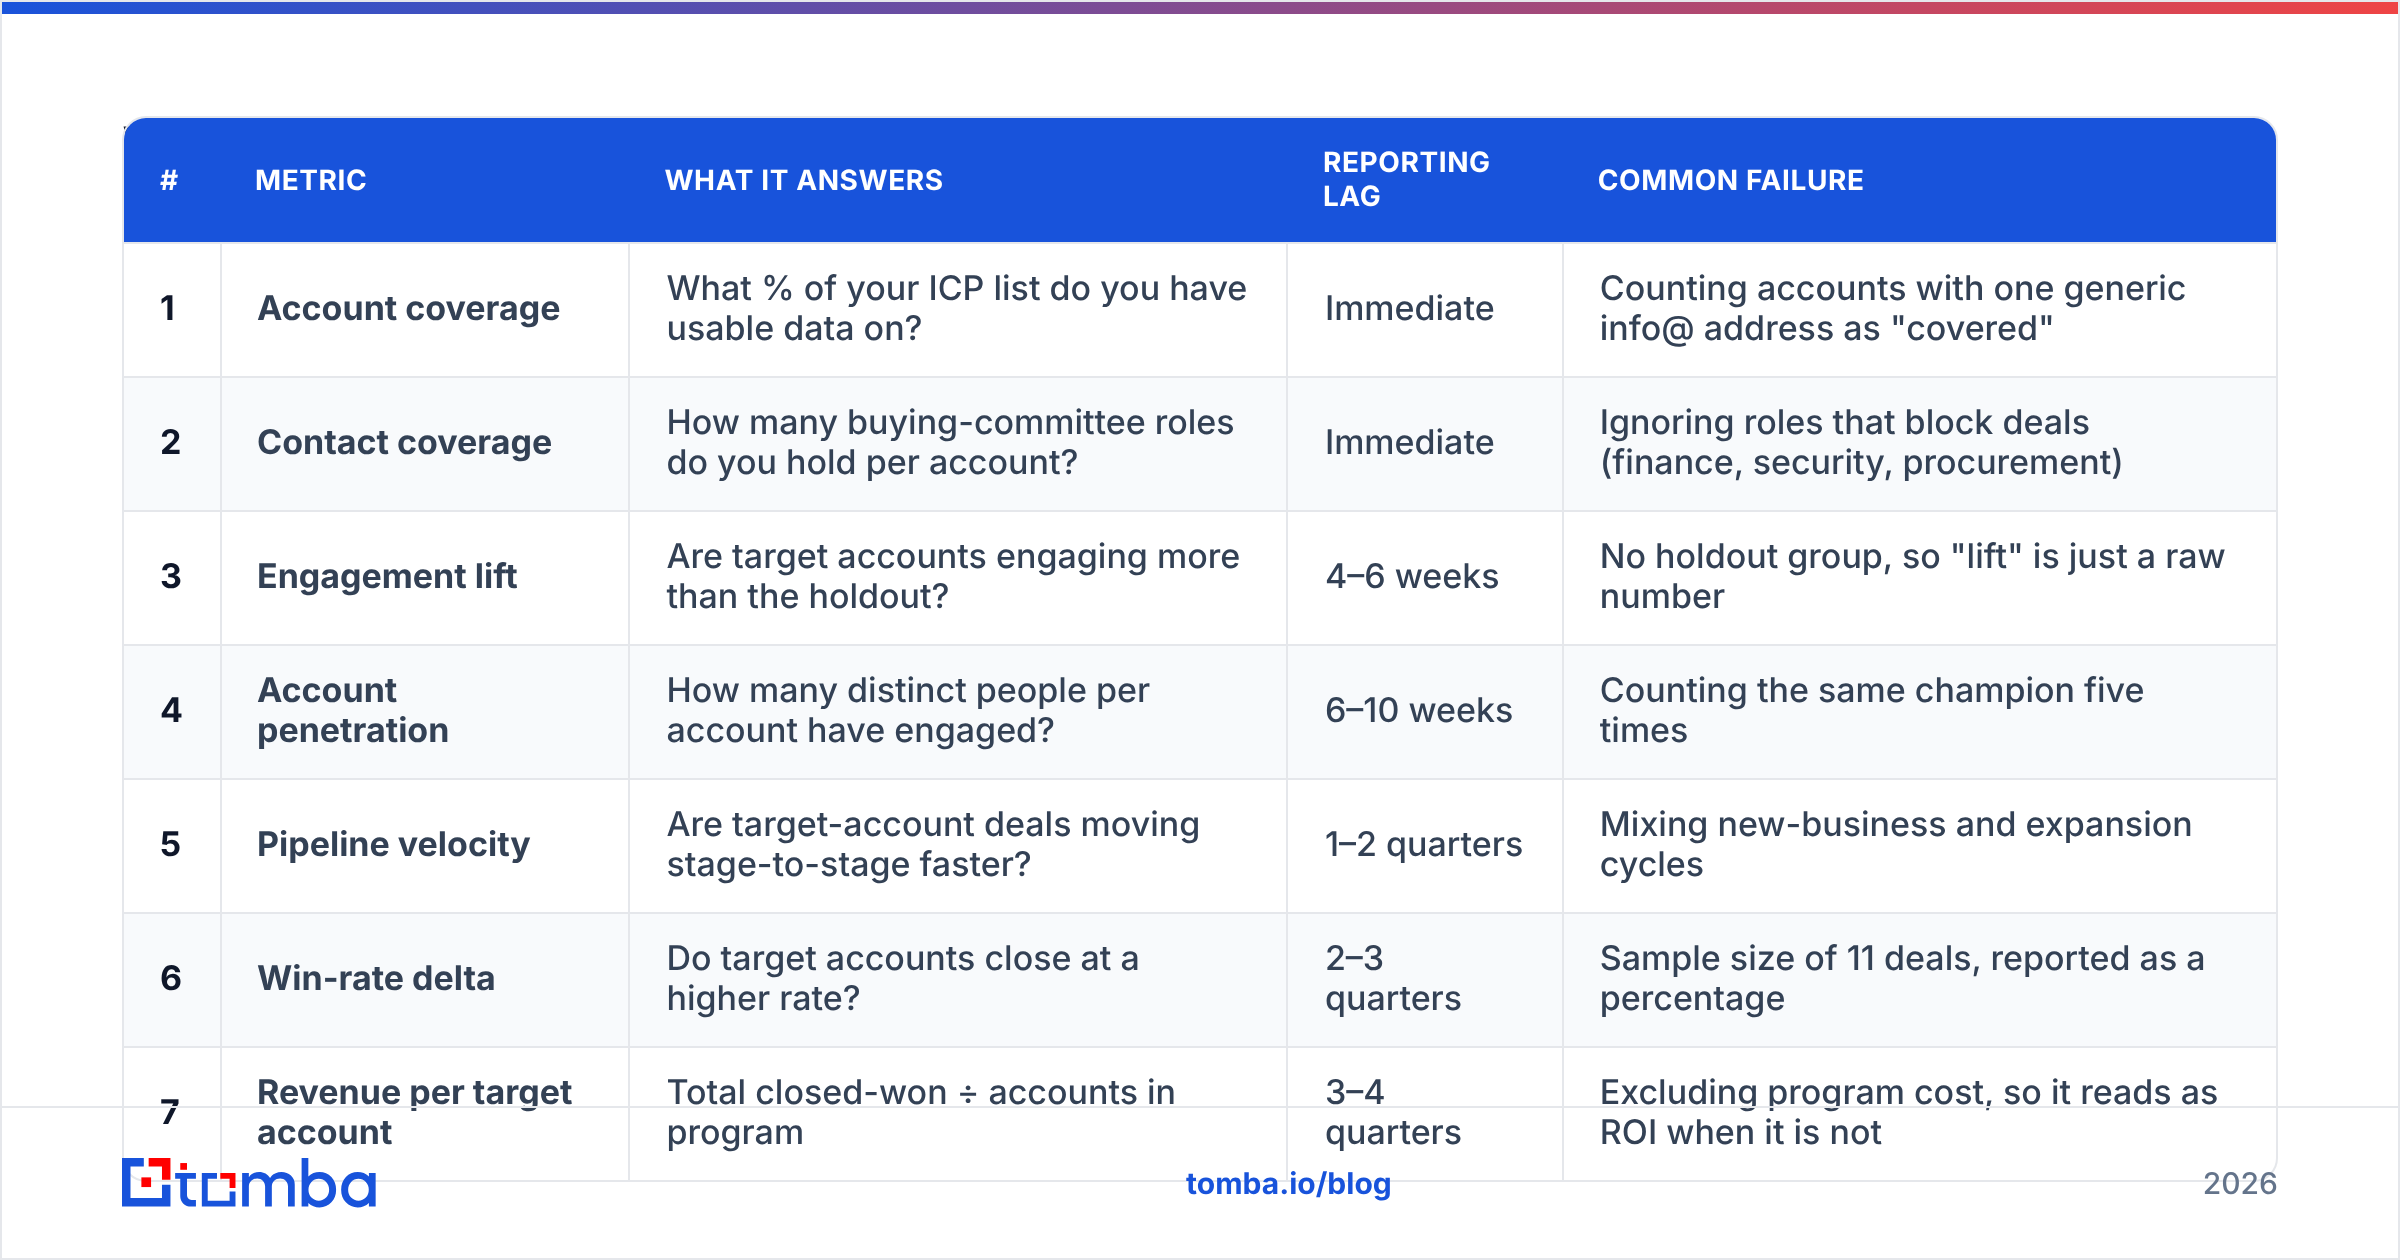
Here is the stack. Read it top to bottom — the early metrics are leading indicators you can report in week two, the later ones are lagging indicators that take quarters.
| # | Metric | What it answers | Reporting lag | Common failure |
|---|---|---|---|---|
| 1 | Account coverage | What % of your ICP list do you have usable data on? | Immediate | Counting accounts with one generic info@ address as "covered" |
| 2 | Contact coverage | How many buying-committee roles do you hold per account? | Immediate | Ignoring roles that block deals (finance, security, procurement) |
| 3 | Engagement lift | Are target accounts engaging more than the holdout? | 4–6 weeks | No holdout group, so "lift" is just a raw number |
| 4 | Account penetration | How many distinct people per account have engaged? | 6–10 weeks | Counting the same champion five times |
| 5 | Pipeline velocity | Are target-account deals moving stage-to-stage faster? | 1–2 quarters | Mixing new-business and expansion cycles |
| 6 | Win-rate delta | Do target accounts close at a higher rate? | 2–3 quarters | Sample size of 11 deals, reported as a percentage |
| 7 | Revenue per target account | Total closed-won ÷ accounts in program | 3–4 quarters | Excluding program cost, so it reads as ROI when it is not |
The discipline is admitting which row you are on. In month two you can honestly report rows 1–4. Reporting row 6 in month two is not optimism, it is noise dressed as a result.
The four leading indicators to instrument first#
- Account coverage rate — target accounts where you hold at least three verified contacts, divided by total target accounts. This is a data problem before it is a marketing problem. You can fix it in a week with a domain search across your ICP list.
- Buying-committee completeness — the share of accounts where you hold the economic buyer, the technical evaluator, and the champion. Gartner's research on B2B buying groups puts the typical committee at six to ten people. Holding two of them is not coverage.
Those first two are data questions. The next two are behavior questions.
- Engaged account rate — accounts with two or more distinct engaged contacts in the last 30 days. Two is the line that separates a curious individual from an account with internal momentum.
- Multi-threading depth — average number of distinct engaged contacts per open opportunity. Deals with four or more threads survive champion turnover; deals with one do not.
How do you build a baseline you can defend?#
Pick one of three methods, and write down which one you used before the program starts.
Holdout group (best). Split your ICP list. Run ABM on 70%, leave 30% to standard demand gen. Compare win rate, deal size, and cycle length across the two groups after a full sales cycle. It is the only method that proves cause. It is also the only one a skeptical CFO will accept.
Pre/post cohort (good). Compare the same accounts across the four quarters before the program and the four after. It is weaker, because the market shifts underneath you. It still works if you name that risk out loud.
Matched-pair comparison (acceptable). For each target account, find a lookalike by industry, headcount, and tech stack, and compare. Labor-intensive but workable at 50–100 accounts.
What does not count as a baseline: "engagement is up." Up from what? Against which comparable set? Over what window? If you cannot answer all three, you have a trend line, not a result.
What does an ABM measurement stack cost to run?#
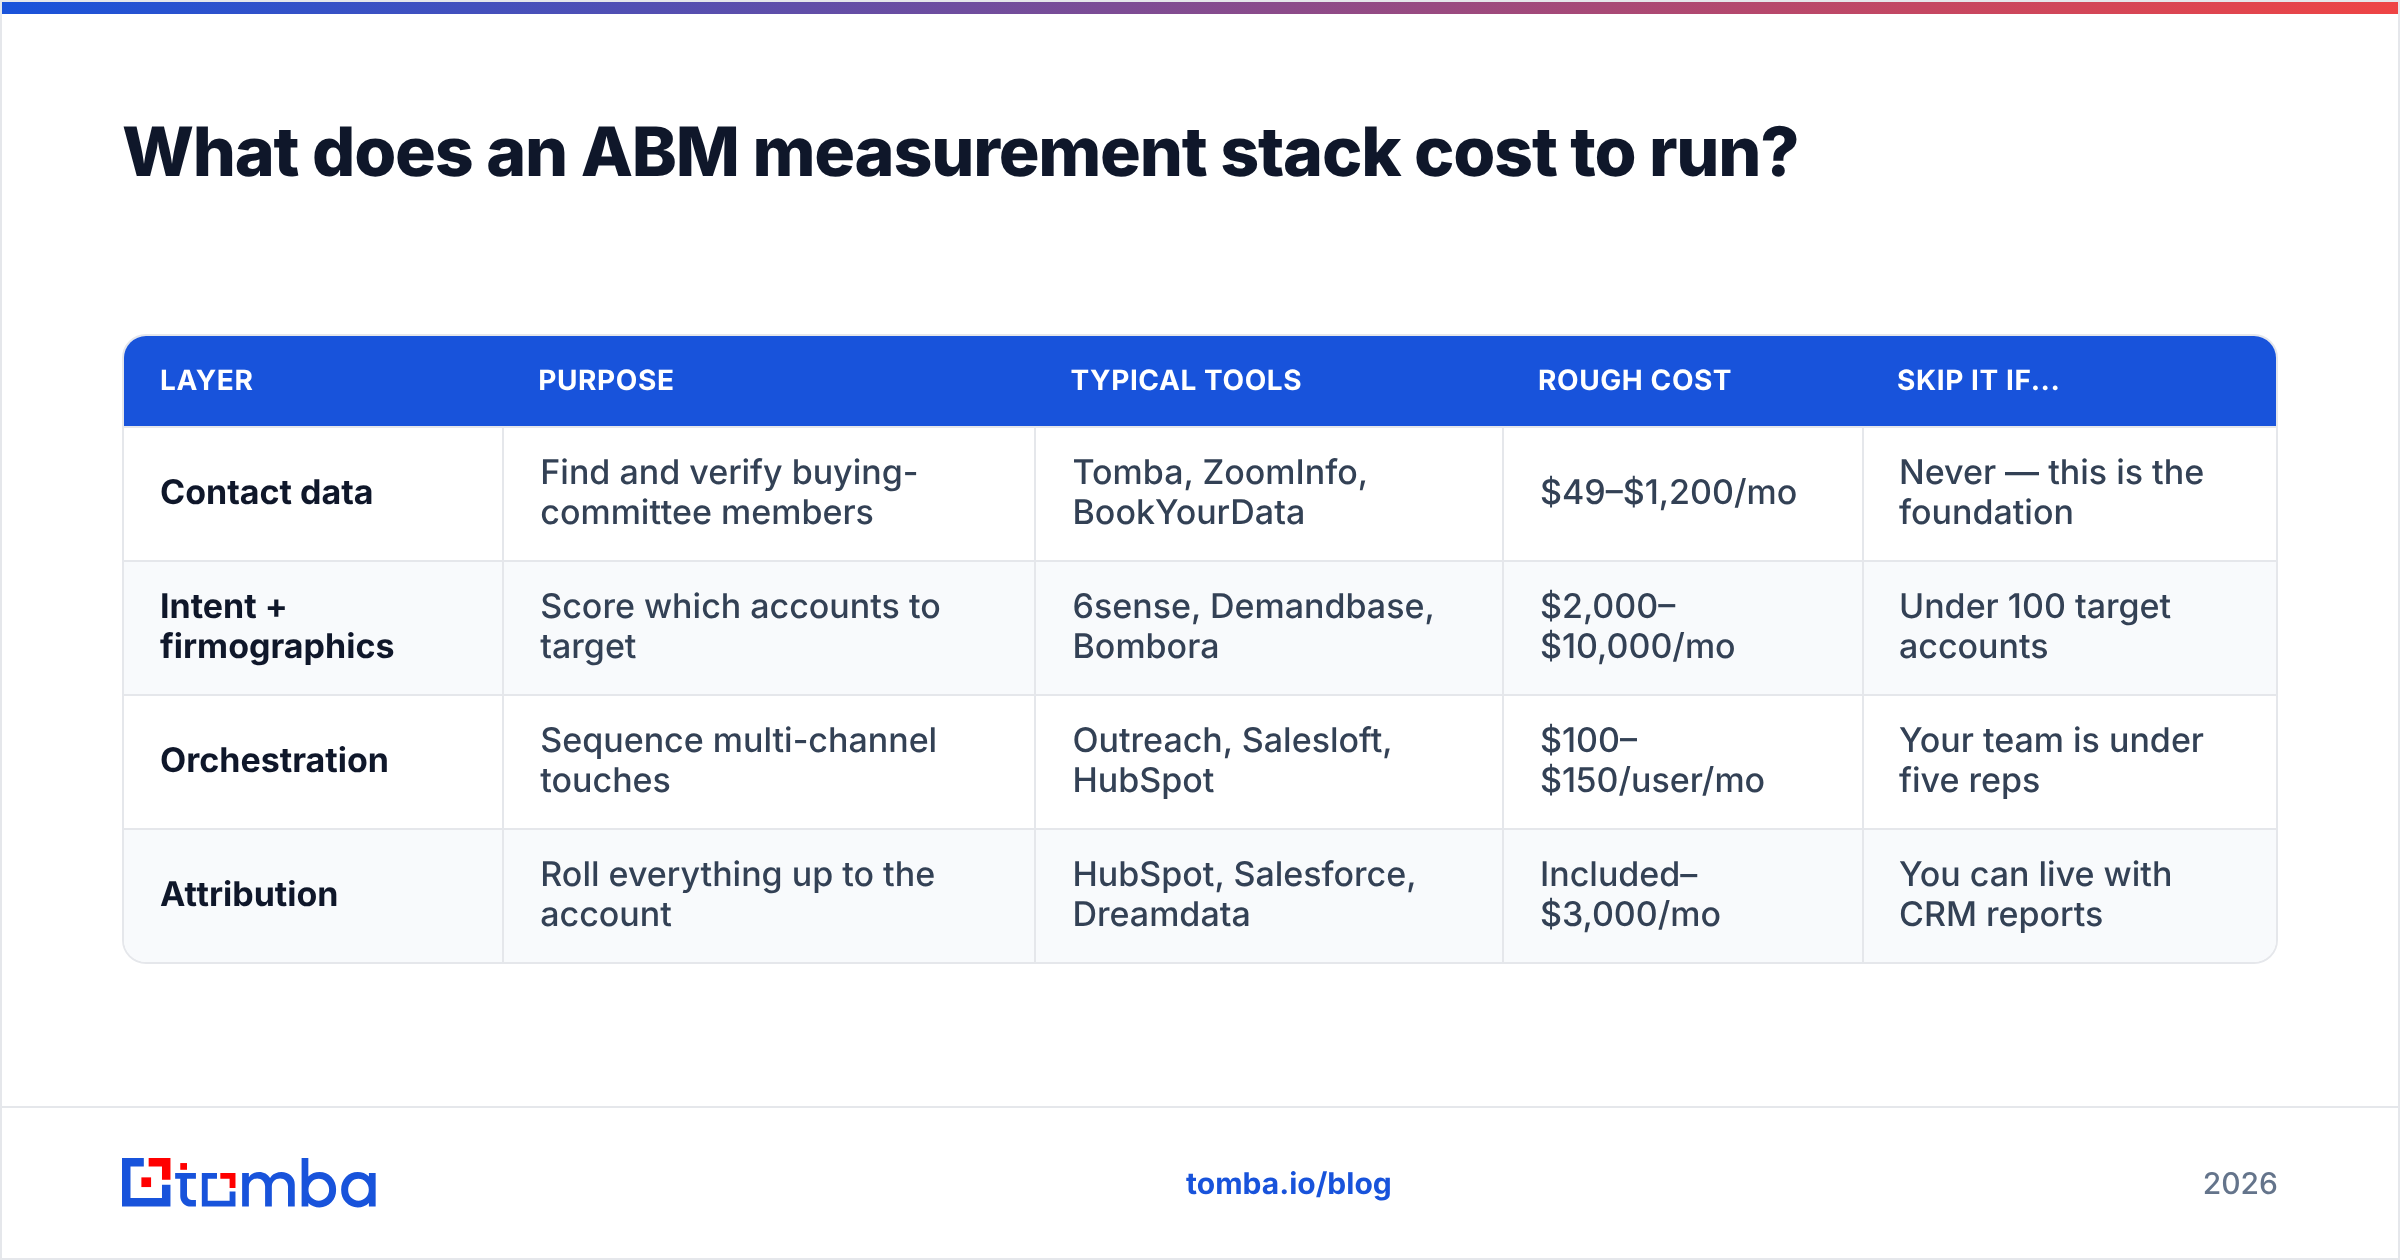
You need four layers, and most teams overbuy at the top while starving the bottom.
| Layer | Purpose | Typical tools | Rough cost | Skip it if... |
|---|---|---|---|---|
| Contact data | Find and verify buying-committee members | Tomba, ZoomInfo, BookYourData | $49–$1,200/mo | Never — this is the foundation |
| Intent + firmographics | Score which accounts to target | 6sense, Demandbase, Bombora | $2,000–$10,000/mo | Under 100 target accounts |
| Orchestration | Sequence multi-channel touches | Outreach, Salesloft, HubSpot | $100–$150/user/mo | Your team is under five reps |
| Attribution | Roll everything up to the account | HubSpot, Salesforce, Dreamdata | Included–$3,000/mo | You can live with CRM reports |
The cheapest layer decides whether every metric above it is real. Say your contact coverage sits at 30%. Your intent platform is then scoring accounts you cannot reach, and your attribution model is splitting revenue across touches that never landed. Fix the bottom of the stack first.
Tomba's pricing starts free at 25 searches per month, with Starter at $49/mo, Growth at $99/mo, and Pro at $249/mo. For most teams that covers ICP list-building and quarterly re-verification without touching the intent-data budget. BookYourData takes a different and equally valid route with prepaid list purchasing, which suits teams that want a one-off ICP build rather than an ongoing API.
How do you measure account penetration correctly?#
Account penetration is the metric ABM teams most often calculate wrong, and it is worth its own section.
The wrong formula: total engagements ÷ accounts. This rewards one hyperactive champion opening twelve emails.
The right formula: distinct engaged contacts per account ÷ estimated buying-committee size. If a mid-market SaaS deal has a seven-person committee and you have meaningful engagement from three, penetration is 43% — and you know exactly what to do next.
To calculate it you need a denominator, so you need the committee shape by segment. Build it from your last twenty closed-won deals. Pull every contact who appeared on a calendar invite or email thread, count the distinct roles, and average them. Most teams find their real committee is larger than their CRM suggests, because procurement and security join late and never get a contact record.
Then you need the numerator, which is a data-hygiene problem. Bounced sends do not count as engagement. A bounce-heavy list also makes penetration look worse than reality while quietly damaging email deliverability. Re-verify your target-account contacts quarterly with an email verifier before you calculate anything — roughly a fifth of B2B contact data decays each year as people change jobs.
How long before ABM results are real?#
Longer than anyone wants. Here is a defensible reporting cadence.
Months 1–2: coverage and data quality. Report account coverage, contact coverage, committee completeness, bounce rate. These are entirely within your control and prove the program is operationally live.
Months 3–5: engagement lift. Report engaged account rate, multi-threading depth, and meeting rate versus the holdout. Now you have a comparison, though not yet a revenue claim.
Months 6–9: pipeline effects. Report pipeline created per target account, stage-conversion deltas, and cycle length. This is the first point where you can say "the program is working" without hedging.
Months 10+: revenue. Win-rate delta, average contract value delta, and revenue per target account net of program cost. Forrester's B2B research has consistently found that ABM programs take multiple quarters to show revenue separation, which matches what most practitioners see.
The political move that saves programs: publish this timeline in month one and get leadership to sign off on it. Every ABM program that got killed early was killed because someone expected a month-three revenue number that was never going to exist.
What ABM metrics should you stop reporting?#
Delete these from the dashboard this quarter.
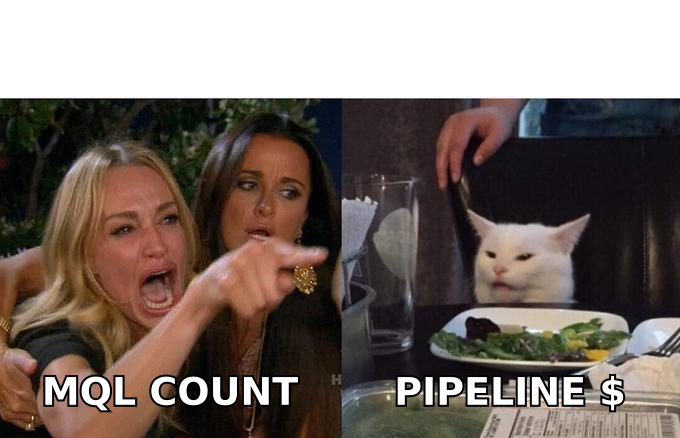
- MQL count. ABM does not produce MQLs, it produces engaged accounts. Reporting both means one of them is a lie.
- Impressions and reach on target accounts. Nobody has ever renewed a budget on impressions. If you must track it, keep it in a diagnostic view, not the exec deck.
- Total email opens. Apple Mail Privacy Protection and its imitators have made opens directionally useless since 2021. Replace with replies and meetings booked.
The next three are subtler, but they fail the same test.
- Cost per lead. The unit is wrong. Use cost per engaged account, or cost per opportunity.
- Content downloads. Measures curiosity, not intent. A whitepaper download from an intern is indistinguishable from one by the CFO unless you enrich the record — which is precisely what contact enrichment is for.
- "Engagement score" with no published formula. If nobody on the team can explain the weights, it is a black box that will be dismissed the first time it is challenged.
The test for any metric: if it went up 40% next month, would you change what you do? If not, stop reporting it.
How do you connect ABM metrics to the CRM?#
Three structural changes, none of them glamorous.
One: make the account the primary object in reporting. Most CRM reporting defaults to leads or contacts. Rebuild your ABM reports on the account object with contacts rolled up. In Salesforce this usually means a custom "Target Account" flag plus account-level rollup fields; HubSpot's ABM tooling has native target-account properties on higher tiers.
Two: log engagement at the contact level and aggregate up. You cannot compute distinct-contact penetration if engagement is stamped only on the account. Every email, meeting, and site visit needs a contact record, which in turn needs a verified email address to match against.
Three: instrument the holdout. Flag control accounts in the CRM at program launch and never touch the flag again. The most common measurement failure is quietly moving accounts out of the holdout when they start showing intent. That guarantees your ABM group outperforms, and it guarantees the result is meaningless.
For teams running this at scale, pushing verified contacts into the CRM programmatically beats manual imports. The Tomba API and the HubSpot integration both handle the find-verify-sync loop, and a bulk email finder run against a fresh ICP list will tell you your true coverage rate in an afternoon rather than a sprint.
What does a good ABM scorecard look like?#
One page. Four sections. Reviewed monthly, not weekly.
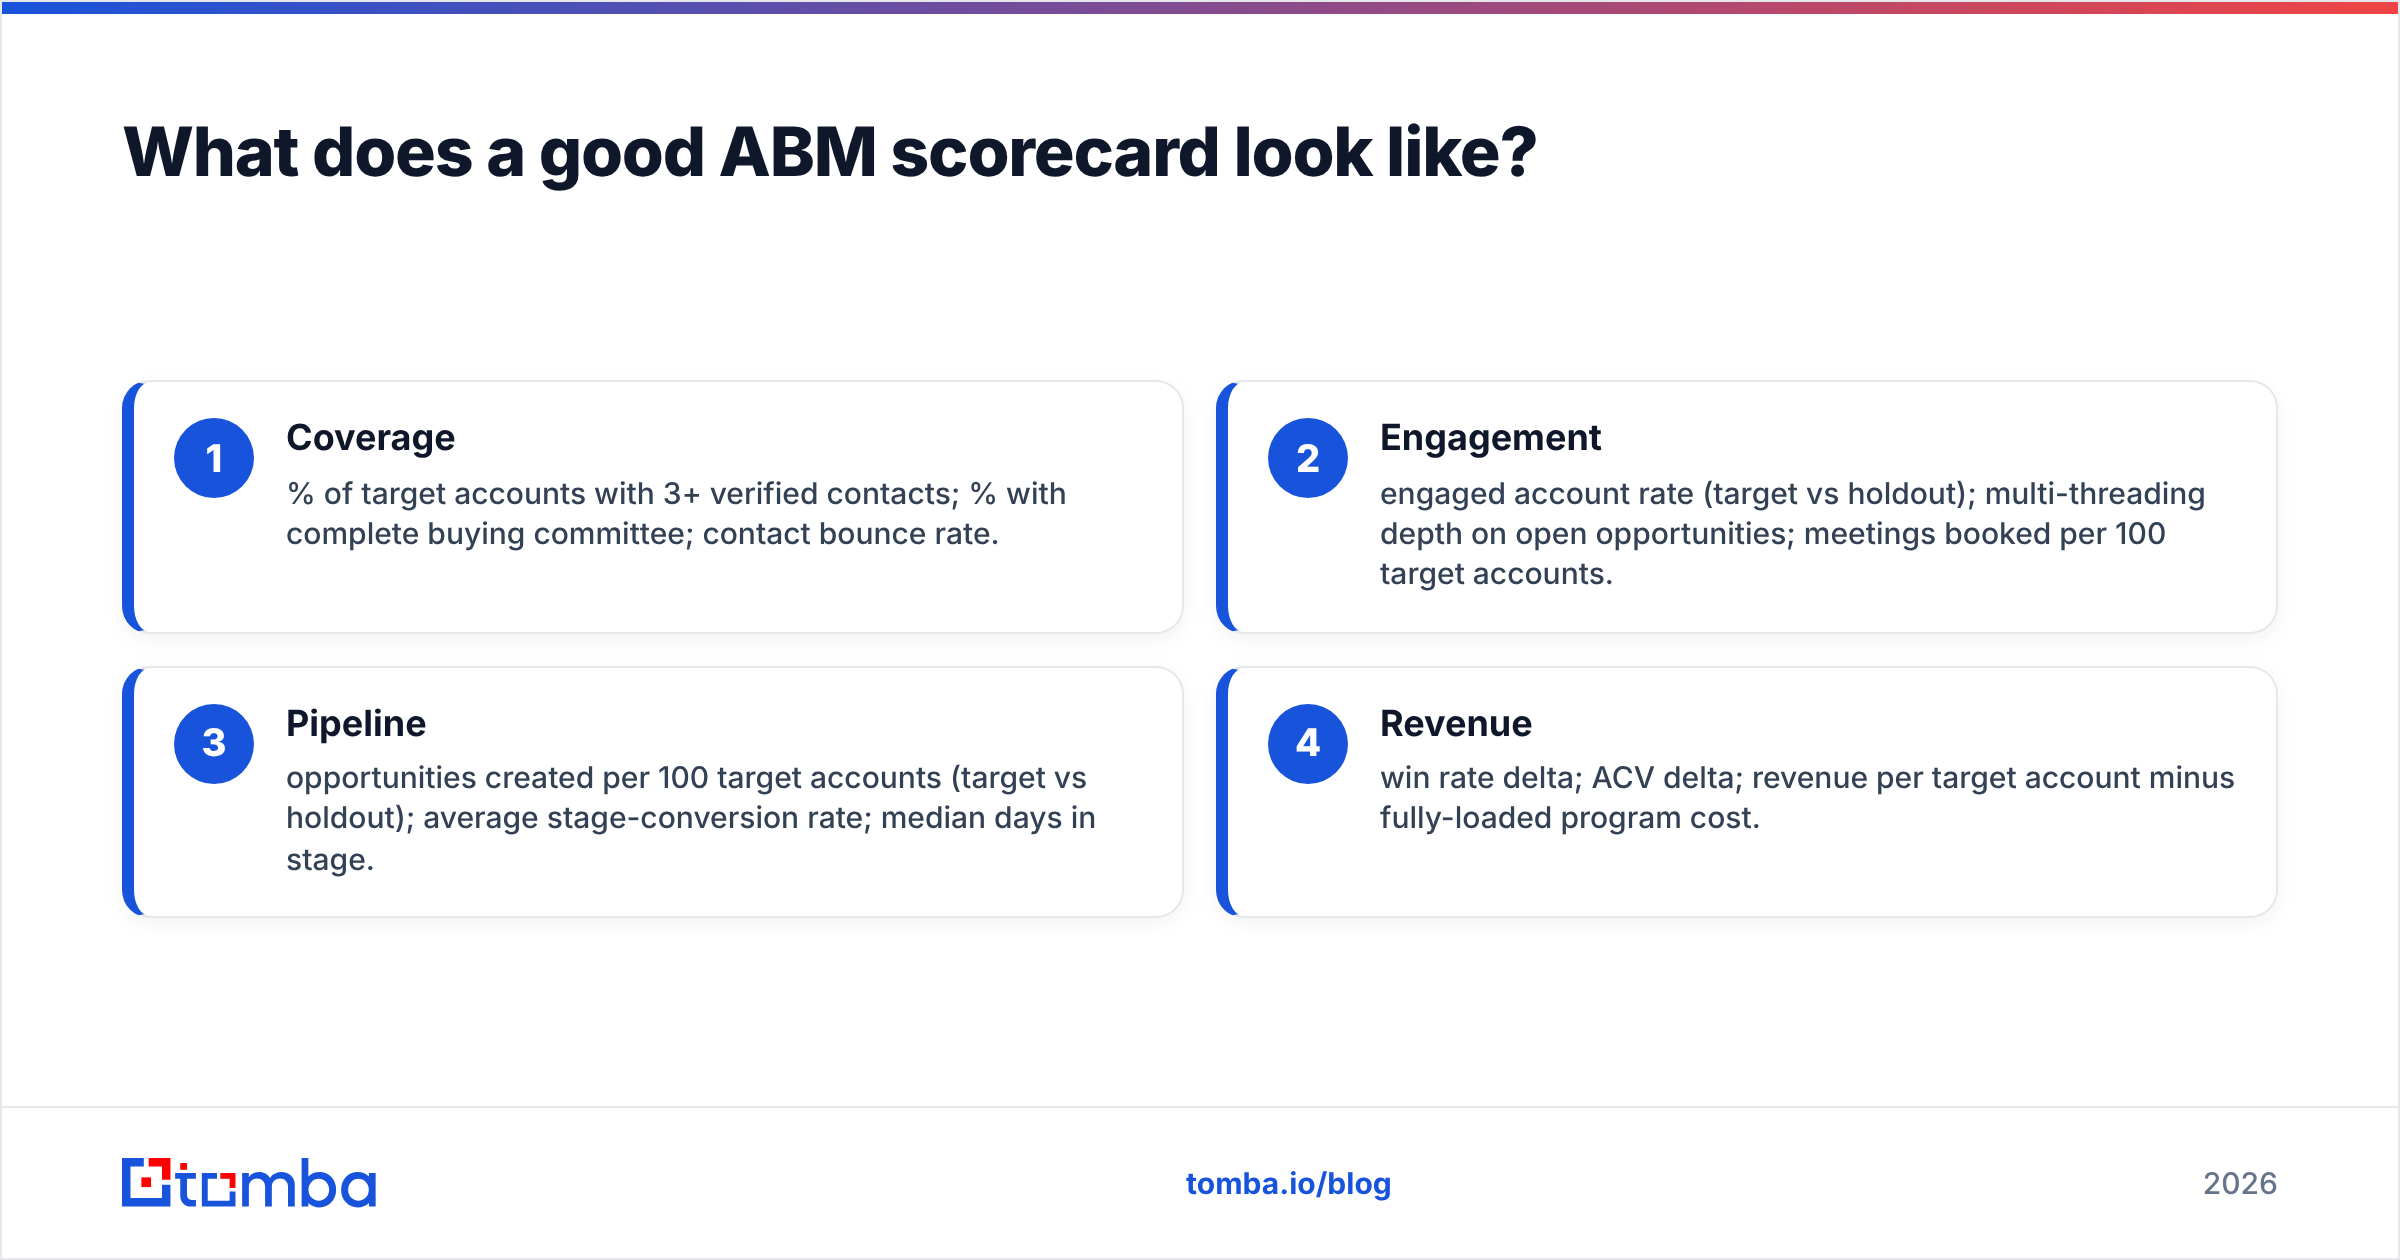
- Coverage — % of target accounts with 3+ verified contacts; % with complete buying committee; contact bounce rate.
- Engagement — engaged account rate (target vs holdout); multi-threading depth on open opportunities; meetings booked per 100 target accounts.
- Pipeline — opportunities created per 100 target accounts (target vs holdout); average stage-conversion rate; median days in stage.
- Revenue — win rate delta; ACV delta; revenue per target account minus fully-loaded program cost.
Every number carries its comparison and its sample size next to it. "Win rate 34% (holdout 26%, n=48)" is a claim. "Win rate up!" is a vibe. The scorecard's job is to make that difference obvious to someone who did not run the program.
Where should you start this week?#
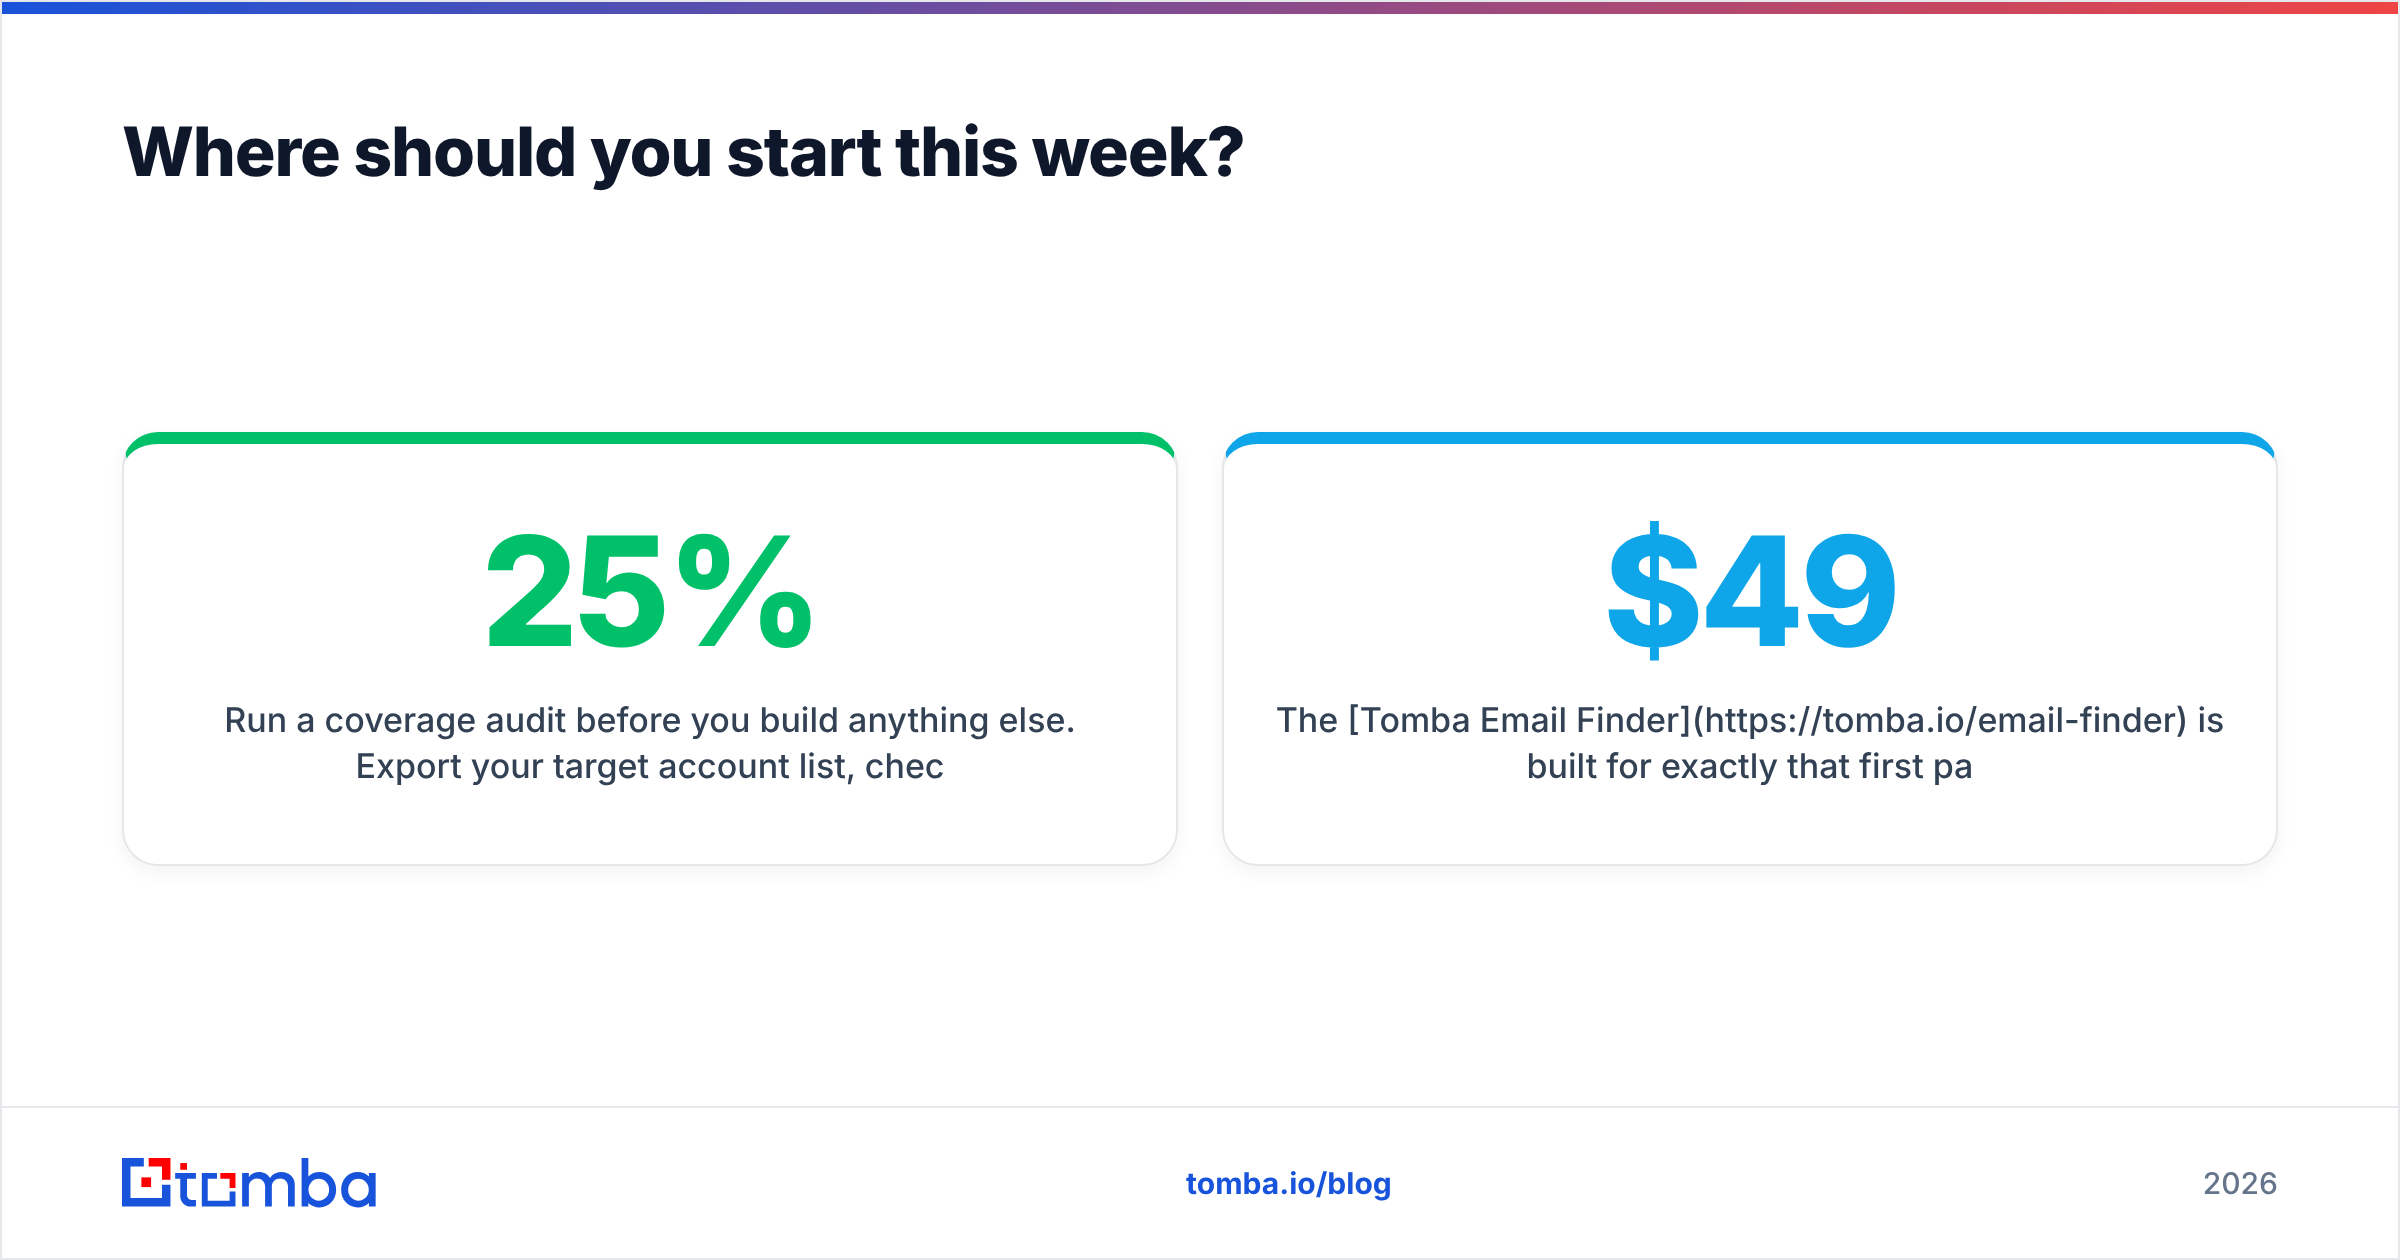
Run a coverage audit before you build anything else. Export your target account list. Check how many contacts you hold per account, verify them, and note which buying-committee roles are missing. Most teams find their coverage sits between 25% and 40% — and that single number reframes how to measure account based marketing across every other metric they report.
The Tomba Email Finder is built for that first pass: feed it your ICP domains and target roles, get verified addresses back, and calculate a real coverage baseline before your next QBR. The free tier gives you 25 searches to sanity-check the data on a handful of accounts; Starter at $49/mo covers a typical 200-account ICP refresh. Fix the denominator first, and the rest of your ABM measurement stack finally has something solid to sit on.
Related guides#
Ready to find emails that actually work?
Join 150,000+ professionals who stopped guessing and started sending. Free credits on signup — no credit card required.
Get the Tomba newsletter
Practical outbound tactics and product updates — once every two weeks.
About the author