How to Measure Lead Quality: A Practical 2026 Framework
Most teams grade leads on gut feel and pay for it in wasted pipeline. Here is a concrete scoring framework, the six metrics that actually predict revenue, and how to audit your data before you score anything.
TL;DR
- Lead quality is not a feeling. It is the measured probability that a lead becomes revenue, and you calculate it from three inputs: fit, intent, and data integrity.
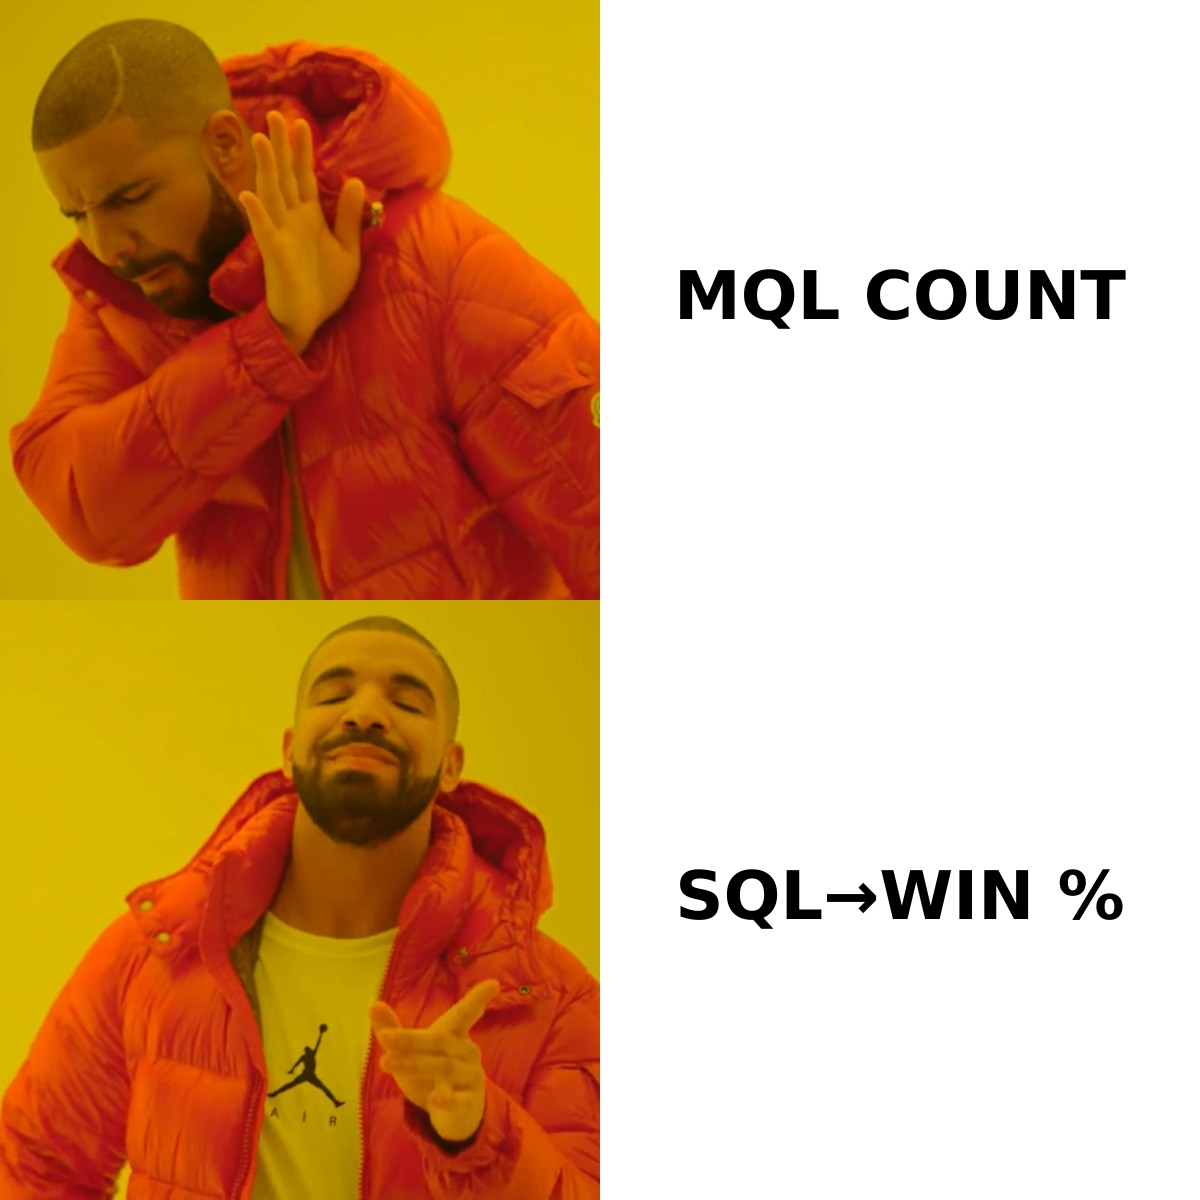
- The six metrics that actually predict revenue are MQL-to-SQL rate, SQL-to-opportunity rate, win rate by source, average deal size by source, sales cycle length by source, and contact reachability.
- Bad contact data silently destroys your scoring model. A lead scored 92/100 with a dead email address is a zero, and most CRMs will never tell you.
- Build a weighted scoring model with no more than eight signals, recalibrate quarterly against closed-won data, and kill any signal that does not correlate.
- Audit reachability first. Verifying and enriching contact records is the cheapest lead-quality improvement available, and it takes an afternoon.
What does "lead quality" actually mean?#
Lead quality is the probability that a given lead converts to closed-won revenue, weighted by the deal size and the cost of pursuing it. That is the whole definition. Everything else — grades, scores, tiers, letters — is a proxy for that number.
The problem is that most teams measure lead volume and call it quality. Marketing reports 1,400 MQLs. Sales says the leads are garbage. Nobody has the data to settle it, so the argument recurs every quarter with different numbers.
To measure lead quality properly you need three separate things, and confusing them is the root of most bad scoring models:
- Fit — does this account match the profile of customers who already buy from you and stay? Industry, headcount, revenue band, tech stack, geography.
- Intent — has this person done something that indicates active buying behavior? Pricing page visits, demo requests, competitor comparison searches, repeat sessions within 14 days.
- Data integrity — can you actually reach this person? Is the email deliverable, is the job title current, does the phone number connect?
Fit tells you whether they should buy. Intent tells you whether they want to buy now. Data integrity tells you whether you can talk to them at all. A lead that fails any one of the three is not a qualified lead, no matter what your score says.
Which metrics actually measure lead quality?#
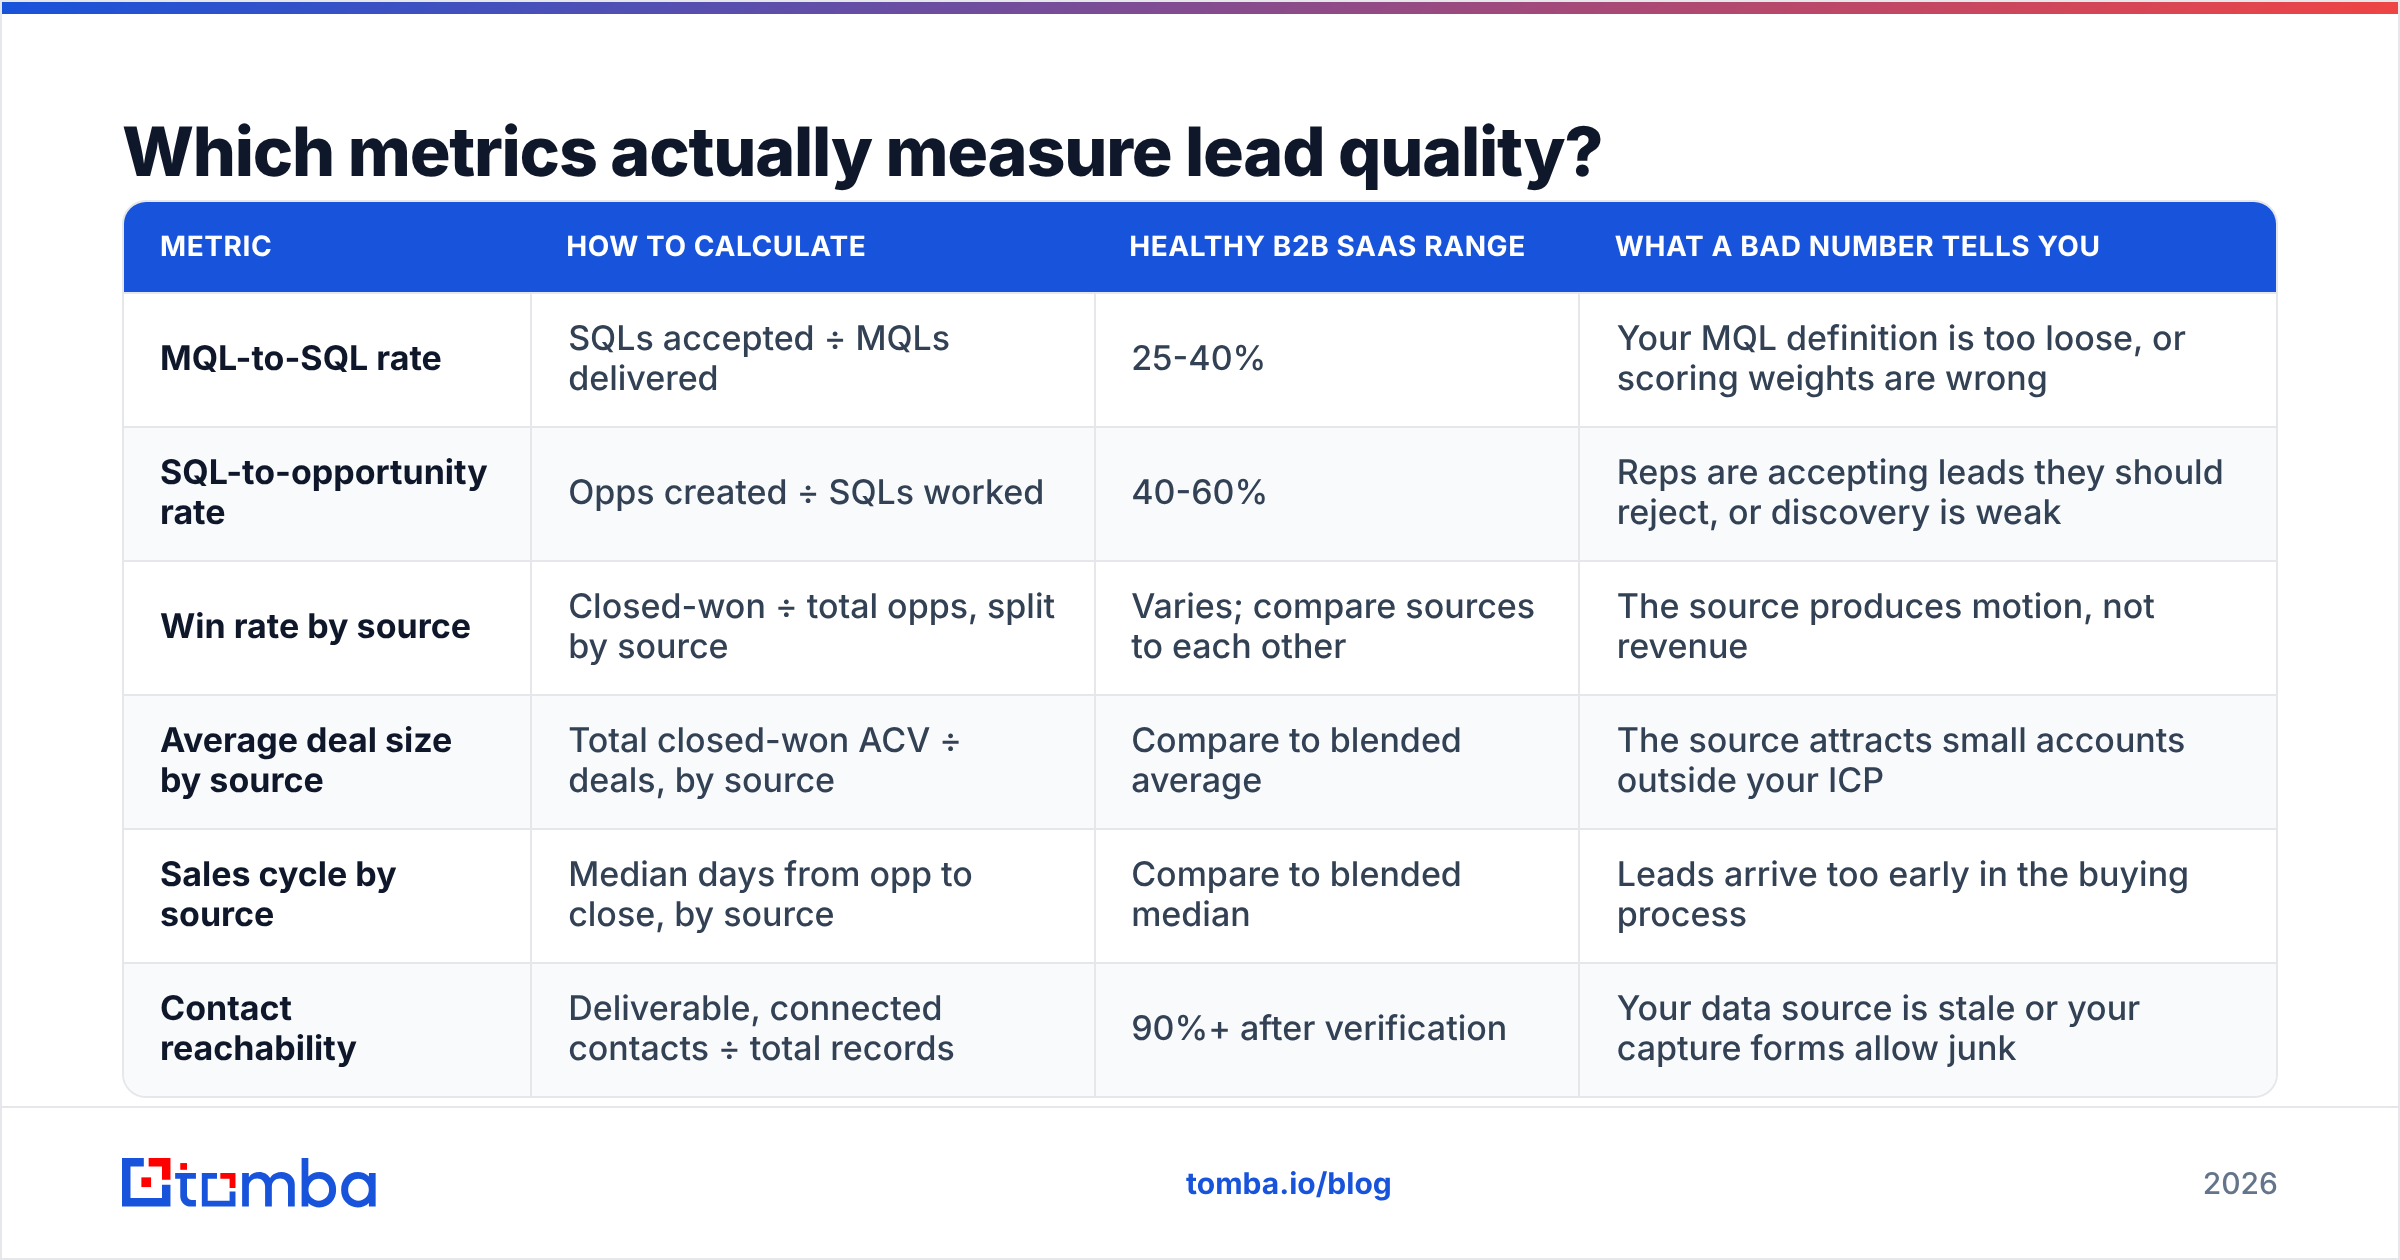
Here are the six that survive scrutiny. Each one is a ratio or an average, not a raw count, because raw counts reward volume and volume is not quality.
| Metric | How to calculate | Healthy B2B SaaS range | What a bad number tells you |
|---|---|---|---|
| MQL-to-SQL rate | SQLs accepted ÷ MQLs delivered | 25-40% | Your MQL definition is too loose, or scoring weights are wrong |
| SQL-to-opportunity rate | Opps created ÷ SQLs worked | 40-60% | Reps are accepting leads they should reject, or discovery is weak |
| Win rate by source | Closed-won ÷ total opps, split by source | Varies; compare sources to each other | The source produces motion, not revenue |
| Average deal size by source | Total closed-won ACV ÷ deals, by source | Compare to blended average | The source attracts small accounts outside your ICP |
| Sales cycle by source | Median days from opp to close, by source | Compare to blended median | Leads arrive too early in the buying process |
| Contact reachability | Deliverable, connected contacts ÷ total records | 90%+ after verification | Your data source is stale or your capture forms allow junk |
The fifth and sixth deserve extra attention because they are the ones teams skip.
Sales cycle by source exposes the trap of high-volume, low-intent channels. A source can post a respectable win rate while doubling your cycle length. That source is quietly consuming rep capacity that a faster channel would convert twice over in the same window.
Contact reachability is the one that breaks models. If 22% of your inbound records have undeliverable email addresses — a normal figure for forms without validation — then your MQL-to-SQL rate is understated by a factor that has nothing to do with lead fit. You are measuring your data pipeline, not your leads. Run those records through an email verifier before you attribute anything.
How do you build a lead scoring model that works?#
Start with closed-won data, not with a whiteboard. The single most common failure mode is a scoring model designed by committee in a meeting room, where every stakeholder contributes their favorite signal and nothing gets removed.
Follow this sequence:
- Pull your last 200 closed-won deals and 200 closed-lost deals. You need both. A model trained only on wins learns what customers look like, not what distinguishes them from non-customers.
- List every attribute you have on those records at the moment they entered the funnel. Not enrichment you added later — what you knew on day one. This is the honest input set.
- Calculate the lift for each attribute. If 40% of all leads are in the software industry but 65% of closed-won leads are, software carries positive lift. Attributes with lift near 1.0 are noise; delete them.
- Assign weights proportional to lift, capped at eight signals total. More signals feels more rigorous and performs worse. Every extra signal adds variance without adding predictive power, and it makes the model impossible to explain to a rep.
- Add a hard disqualifier layer. Some conditions should zero out a score regardless of points: undeliverable email, competitor domain, student email, or a headcount below your minimum viable account size.
- Set your threshold from capacity, not from the score distribution. If your reps can work 300 leads a month, the MQL threshold is whatever score yields roughly 300 leads. Thresholds set at "80 because it sounds high" produce either starved or drowning reps.
That last point is worth restating. A scoring threshold is a capacity allocation decision disguised as a quality decision. Set it by dividing available rep hours by the average hours needed per lead, then work backward to the score cutoff.
Fit signals vs intent signals: how should you weight them?#
| Signal type | Example | Typical weight | Decay rate |
|---|---|---|---|
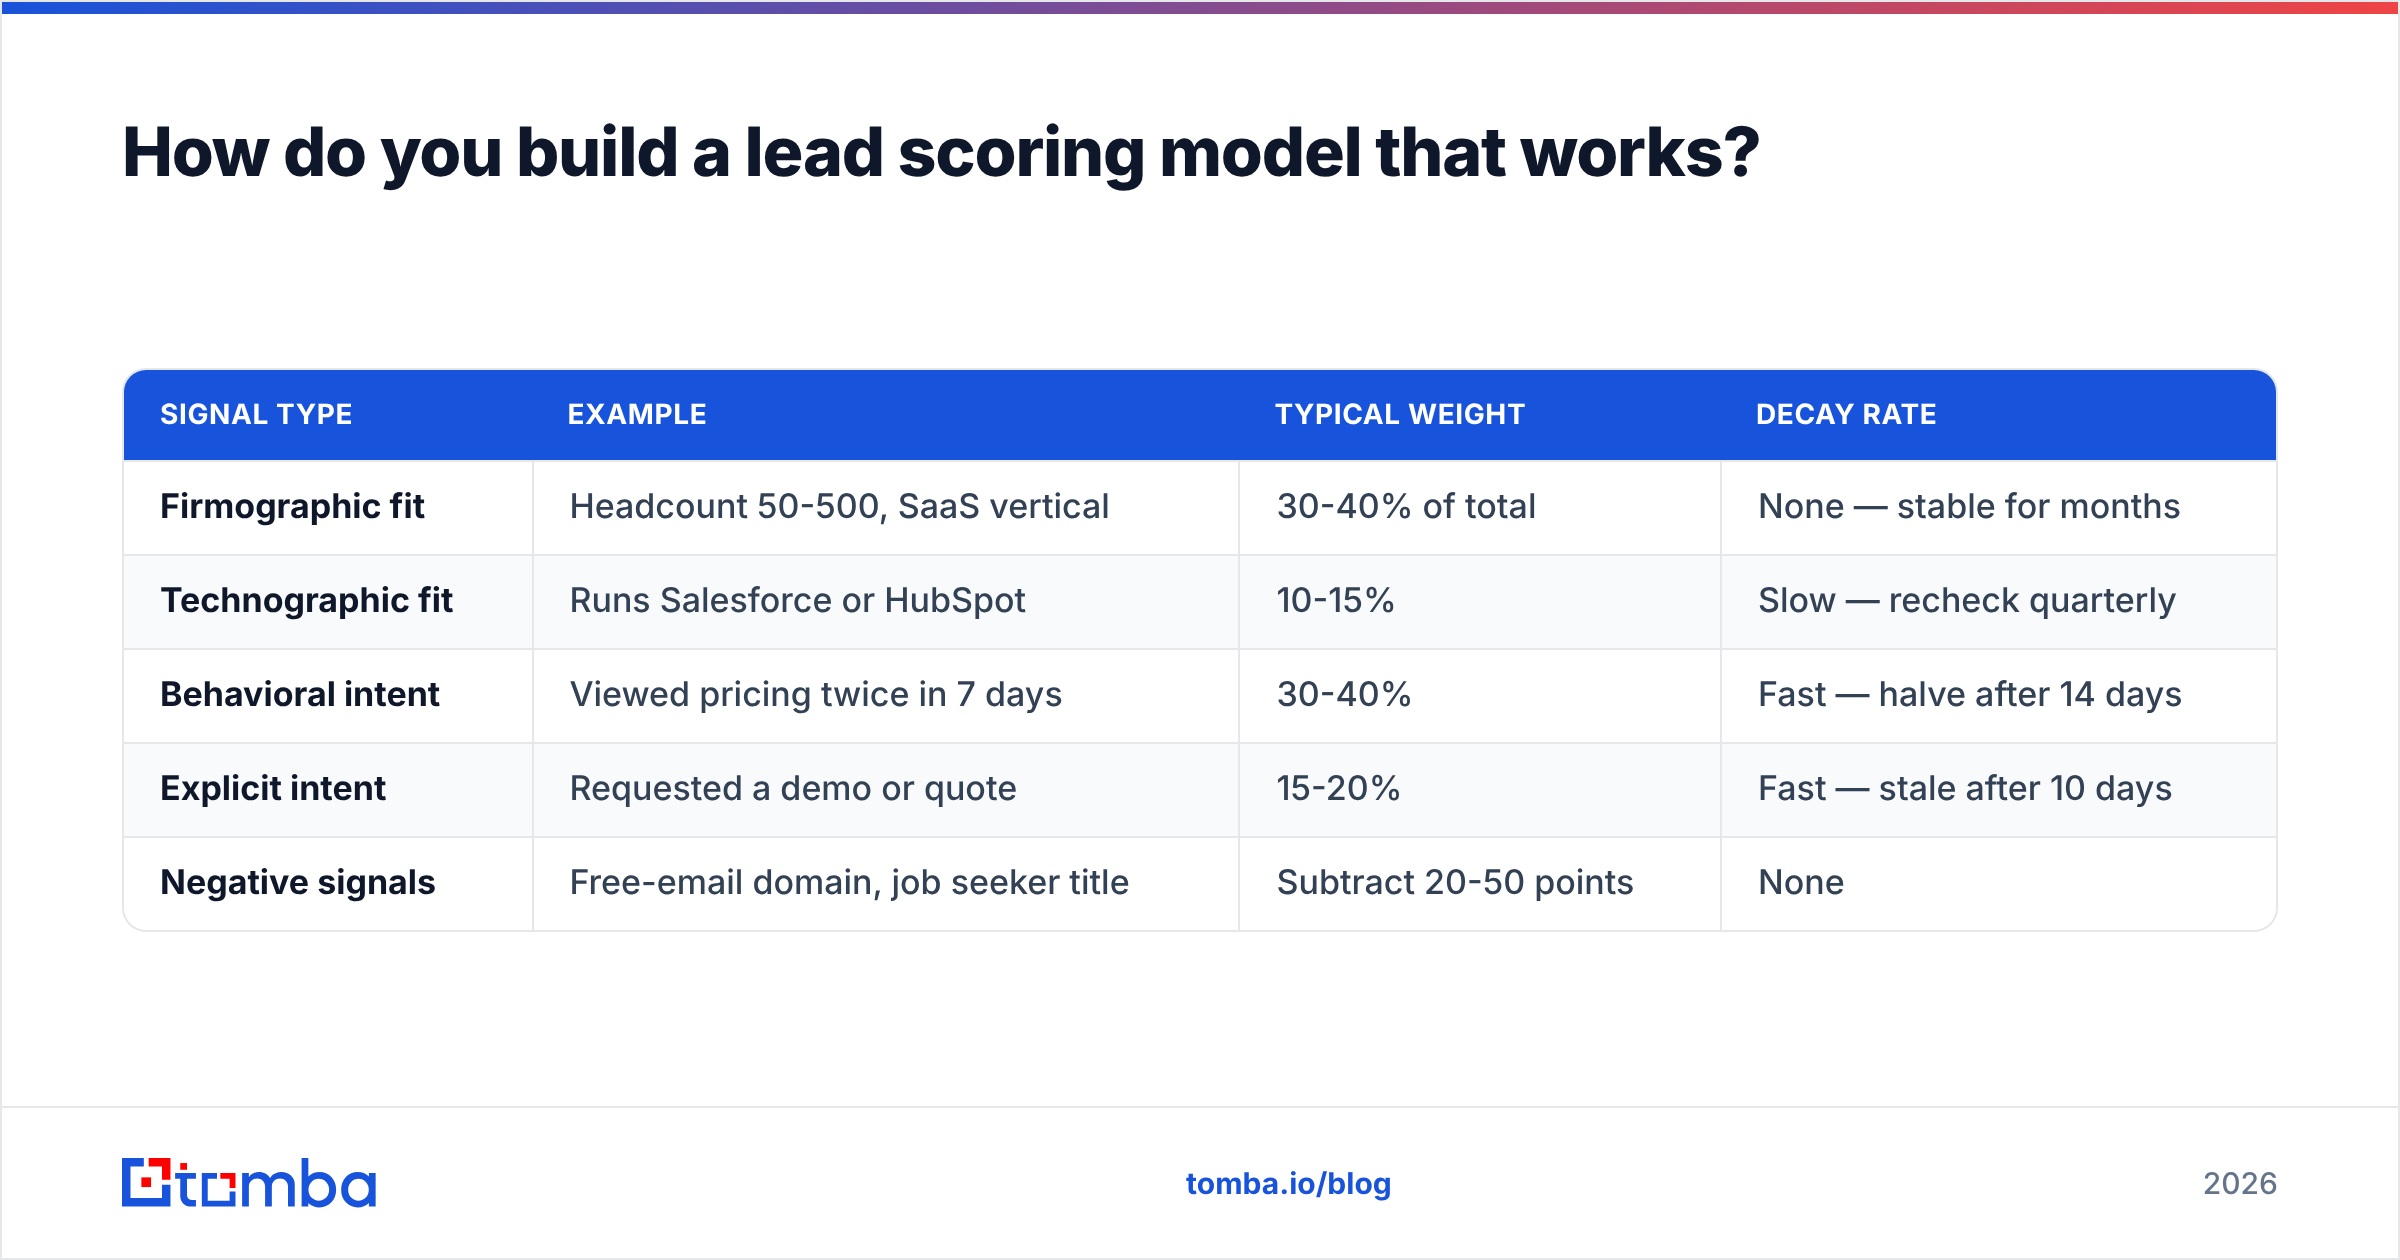
| Firmographic fit | Headcount 50-500, SaaS vertical | 30-40% of total | None — stable for months |
| Technographic fit | Runs Salesforce or HubSpot | 10-15% | Slow — recheck quarterly |
| Behavioral intent | Viewed pricing twice in 7 days | 30-40% | Fast — halve after 14 days |
| Explicit intent | Requested a demo or quote | 15-20% | Fast — stale after 10 days |
| Negative signals | Free-email domain, job seeker title | Subtract 20-50 points | None |
Intent decays and fit does not. If your CRM applies a static score, a lead who visited your pricing page four months ago carries the same weight as one who visited this morning. Add a decay function — even a crude one that removes half the behavioral points after 14 days — and your MQL-to-SQL rate typically improves without any other change.
Why does data quality break lead scoring?#
Because scoring models assume the underlying record is true, and frequently it is not.
Consider what happens across a normal quarter. Roughly 2-3% of B2B contacts change jobs every month, which compounds to about 25-30% annual decay in a contact database. Job titles drift. Companies get acquired and change domains. People use personal addresses on forms to avoid sales follow-up.
Your scoring model sees none of this. It sees "VP of Engineering at Acme Corp, score 87" and routes it to an AE, who spends 40 minutes researching a person who left the company in March.
Three checks fix most of it:
- Verify deliverability at capture, not at send. A real-time check on the form catches typos and disposable addresses before they ever enter the CRM. The free email checker handles one-off validation; an API call handles it at scale.
- Re-verify the database quarterly. Anything older than 90 days without engagement should be re-checked. Suppress hard bounces rather than deleting them, so you keep the negative signal.
- Enrich rather than ask. Every extra form field cuts conversion. Ask for email and company, then use data enrichment to fill in headcount, industry, and role — which are exactly the fit attributes your model needs.
There is a measurable second-order effect here too. Sending to unverified lists damages sender reputation, which suppresses inbox placement for your good leads. A dirty list does not just waste the bad records — it degrades results for the clean ones.
How do you compare lead sources fairly?#
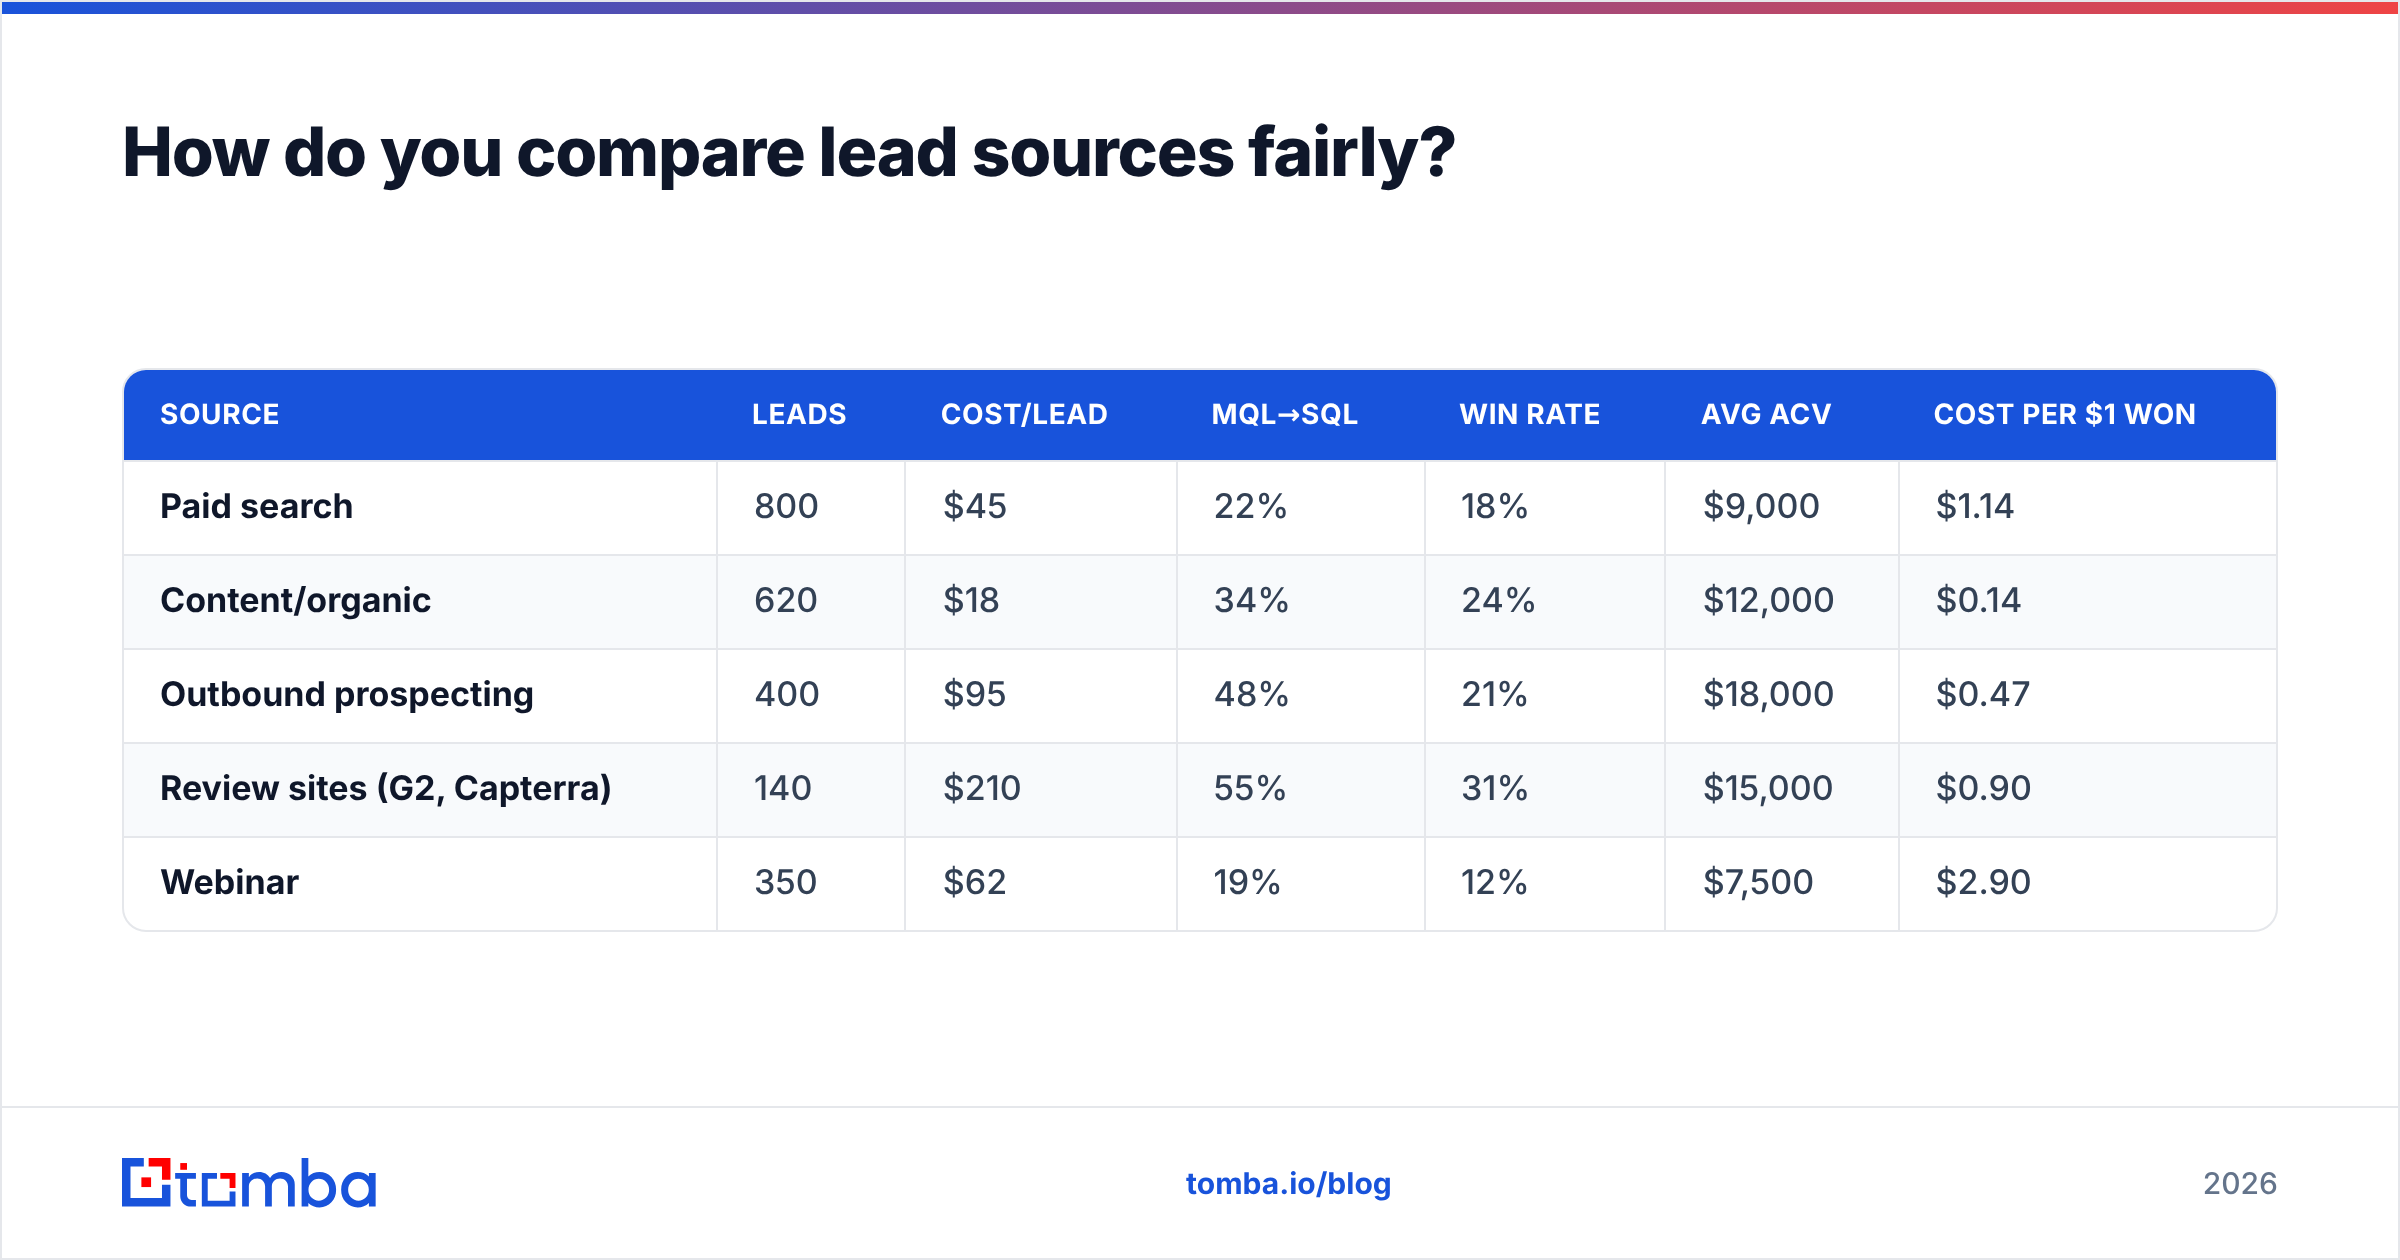
Most source comparisons are unfair because they stop at cost per lead. Cost per lead rewards whichever channel produces the cheapest clicks, which is almost never the channel producing the best revenue.
Compare on cost per closed-won dollar instead. The math is simple and it reorders your channel rankings immediately:
| Source | Leads | Cost/lead | MQL→SQL | Win rate | Avg ACV | Cost per $1 won |
|---|---|---|---|---|---|---|
| Paid search | 800 | $45 | 22% | 18% | $9,000 | $1.14 |
| Content/organic | 620 | $18 | 34% | 24% | $12,000 | $0.14 |
| Outbound prospecting | 400 | $95 | 48% | 21% | $18,000 | $0.47 |
| Review sites (G2, Capterra) | 140 | $210 | 55% | 31% | $15,000 | $0.90 |
| Webinar | 350 | $62 | 19% | 12% | $7,500 | $2.90 |
Read that table and paid search looks fine on cost per lead and terrible on cost per dollar won. The webinar channel — the one everyone defends because attendance is high — is the worst performer by a factor of twenty against organic content.
Two caveats before you cut budgets on a table like this. First, attribution windows matter; a channel that influences deals without originating them will look worse than it is. Second, sample size matters; 140 review-site leads is thin, and one anomalous deal moves the average ACV meaningfully. Run the analysis on at least two quarters before acting.
For outbound specifically, quality is largely a function of list construction. A targeted list built from domain search against a tight ICP definition converts at a different order of magnitude than a purchased list. Peers in this space — including BookYourData, which sells verified B2B contact data with a similar accuracy-first stance — have made the same argument: pre-verified, tightly targeted data outperforms volume every time.
What tools help you measure lead quality?#
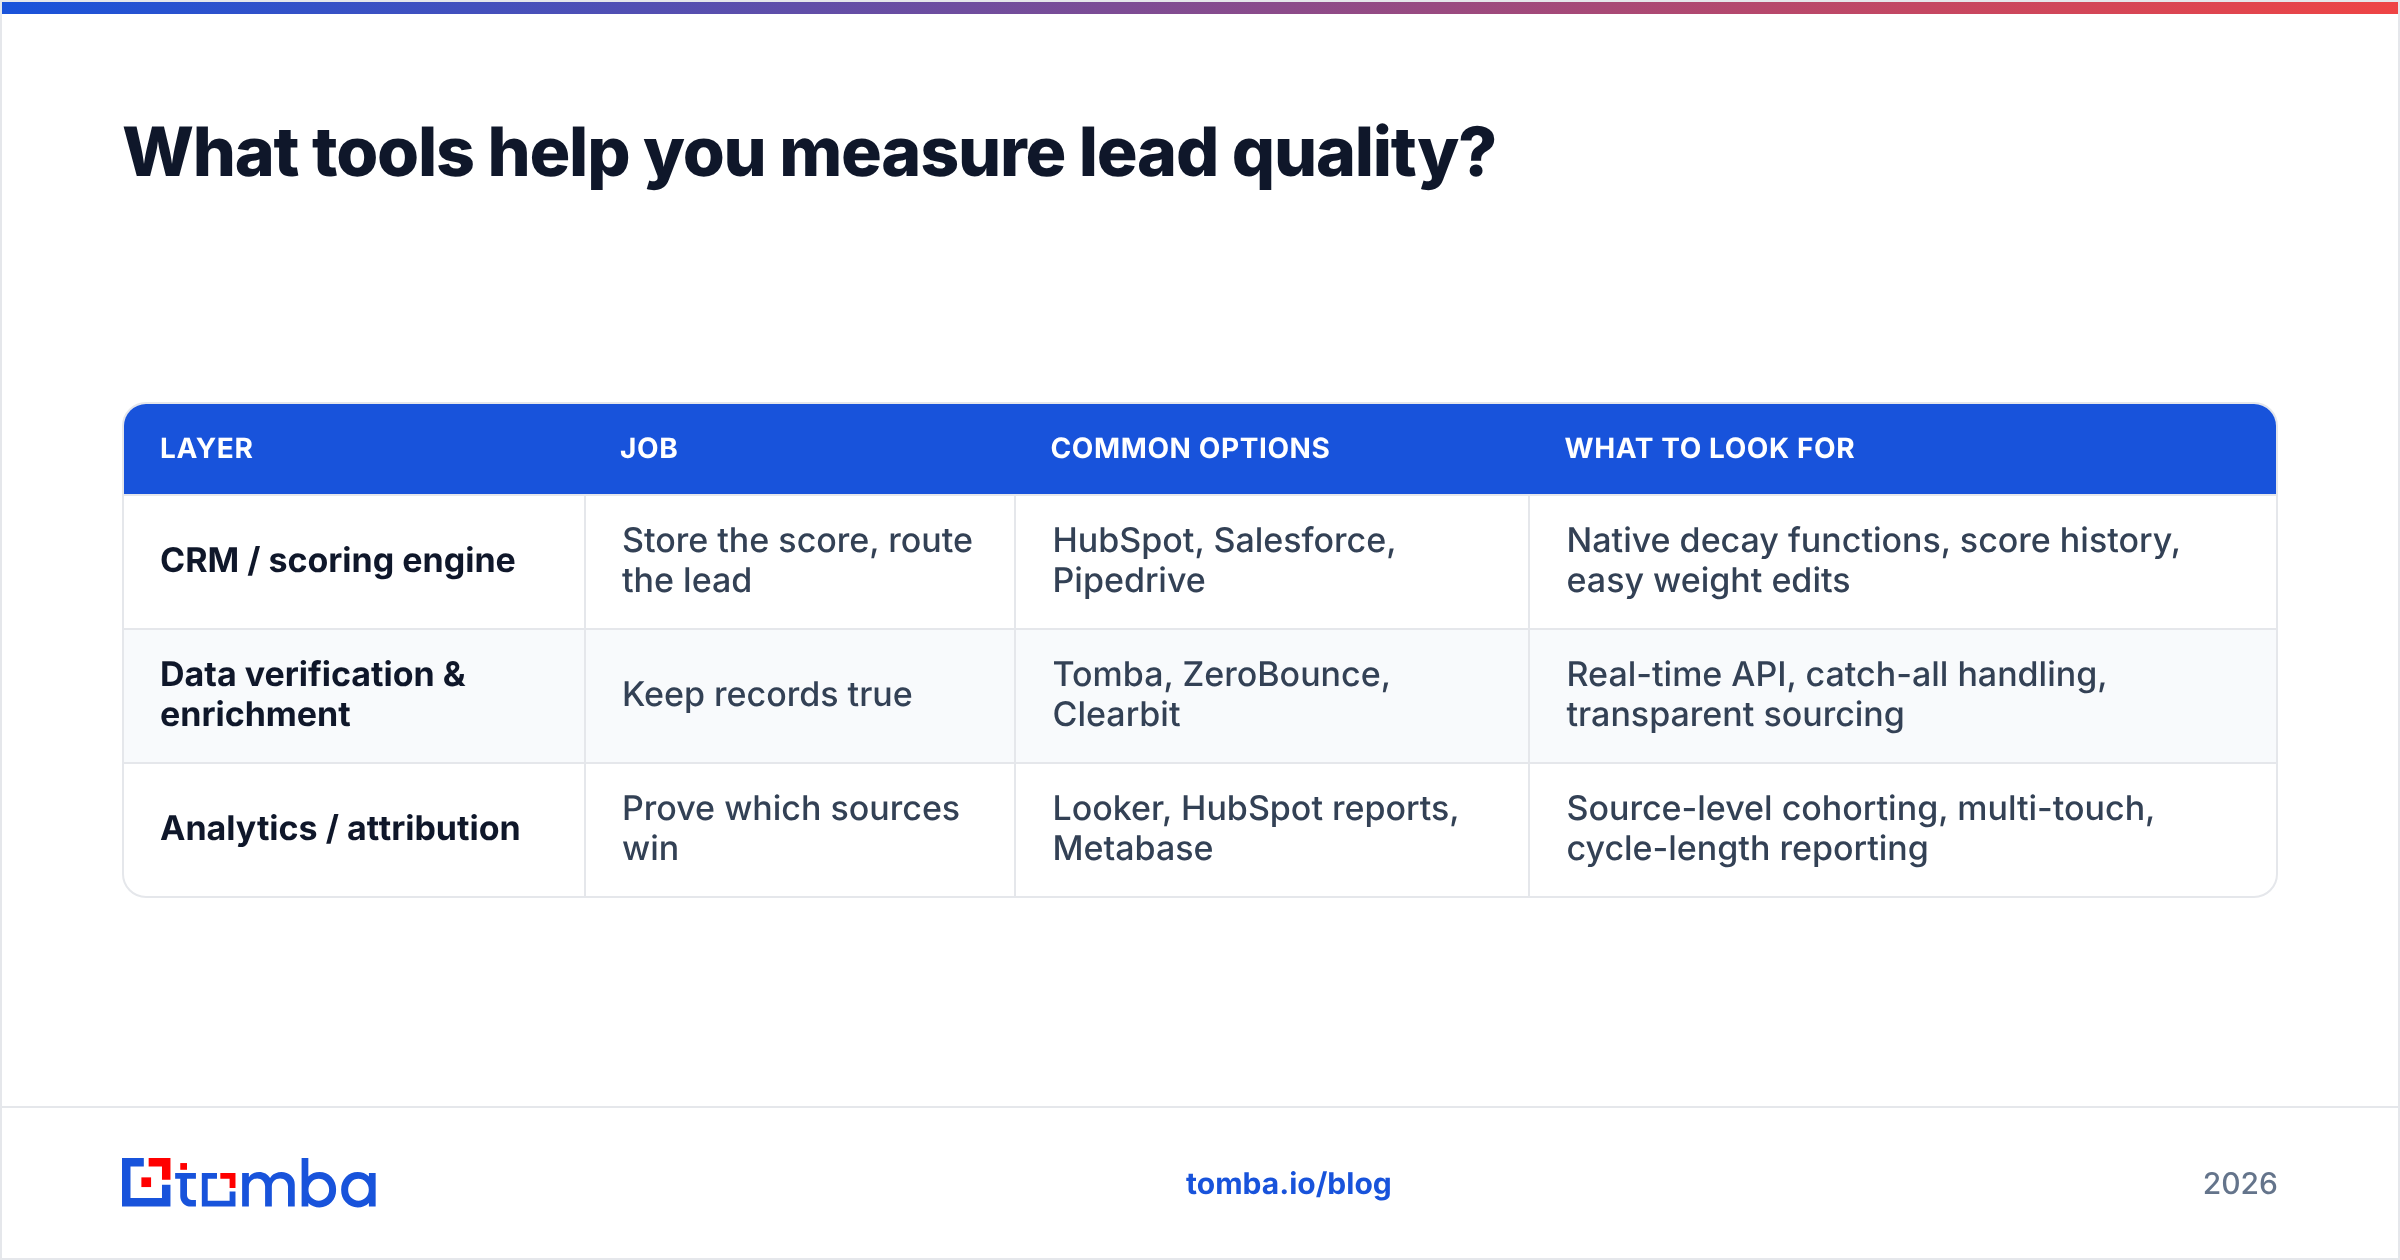
You need three layers, and most teams over-invest in the first and neglect the other two.
| Layer | Job | Common options | What to look for |
|---|---|---|---|
| CRM / scoring engine | Store the score, route the lead | HubSpot, Salesforce, Pipedrive | Native decay functions, score history, easy weight edits |
| Data verification & enrichment | Keep records true | Tomba, ZeroBounce, Clearbit | Real-time API, catch-all handling, transparent sourcing |
| Analytics / attribution | Prove which sources win | Looker, HubSpot reports, Metabase | Source-level cohorting, multi-touch, cycle-length reporting |
On the CRM layer, HubSpot's documentation on lead scoring is a reasonable free reference for implementing decay and negative scoring, regardless of which CRM you run. For vendor evaluation, G2's category pages give you unfiltered review volume, which is more useful than any vendor comparison chart.
On the verification layer, the requirement is boring but strict: it must run at capture speed via API, and it must tell you honestly when a domain is catch-all rather than guessing. A catch-all verifier that flags ambiguity beats one that returns confident garbage, because a false "valid" is more expensive than an honest "unknown" — you act on the first and investigate the second.
What should you do in the next 30 days?#
A realistic sequence, in order of return on effort:
- Week 1 — Audit reachability. Export your entire contact database and run it through verification. Report the percentage of invalid, catch-all, and valid records. This number alone usually changes the conversation with your leadership team.
- Week 2 — Build the source comparison table. Pull cost, lead volume, MQL→SQL, win rate, and ACV by source for the last two quarters. Calculate cost per dollar won.
- Week 3 — Rebuild the score from closed-won data. Run the lift analysis. Cut every signal with lift under 1.15. Add negative scoring and a decay function.
- Week 4 — Set the threshold from rep capacity and agree a written MQL definition that both marketing and sales sign. Put it in a shared doc with the date. Revisit it quarterly.
The step people skip is week 1, because it feels like plumbing rather than strategy. It is the one with the highest return. You cannot score, route, or attribute a lead you cannot reach, and the fastest way to raise measured lead quality is to stop counting unreachable records as leads.
Ready to fix the data layer first?#
Lead scoring models fail on data before they fail on math. Before you rebuild weights or renegotiate the MQL definition, make sure the contact records underneath are real.
The Tomba Email Finder finds and validates professional email addresses by domain, name, or company, so the leads entering your scoring model are reachable people rather than expired records. Start on the free tier with 25 searches a month to test your data quality hypothesis, then scale up — Starter is $49/mo, Growth $99/mo, and Pro $249/mo, with full Tomba pricing and an API for capture-time verification. Audit one segment this week and see what your real reachability rate is.
Related guides#
// get started
Find, verify and enrich your first contacts today
Start on the free plan with 25 searches a month, then scale when your team is ready.
Free plan · No credit card required · GDPR & CCPA
// about the author