How To Measure Sales Performance: Metrics That Matter
Most sales dashboards track activity, not performance. Here is a practical framework for measuring sales performance in 2026 — the metrics, the cadence, and the traps that make numbers lie.
TL;DR — how to measure sales performance in one page
- Sales performance sits in three layers: activity (what reps do), pipeline (what those actions create), and outcome (what closes). Most teams over-measure the first layer and skip the middle one.
- Seven metrics actually predict revenue: win rate, sales cycle length, average deal size, pipeline coverage, quota attainment spread, stage-to-stage conversion, and cost per new customer.
- Activity metrics work as leading indicators only. Normalize them for data quality first. 200 calls to a stale list is not 200 calls.
- Set a review cadence: activity weekly, pipeline health biweekly, outcomes monthly, unit economics quarterly. Reviewing everything every week just makes noise.
- Bad contact data corrupts every ratio you compute. Clean the source list before you argue about rep performance.
How to measure sales performance: what it actually means#
Learning how to measure sales performance starts with one question you answer in numbers: is the way this team sells working, and where is it breaking?
That is not the same as reporting revenue. Revenue tells you what happened. Performance measurement tells you why it happened, and what to change. A team can hit quota with a broken process. One hero rep carries eight who are struggling, and a revenue-only dashboard shows green while the org quietly rots.
Think of it like a car dashboard. Revenue is the odometer: fine for the record, useless for driving. What you need is the fuel gauge, the temperature warning, and the RPM. Those are leading signals. They tell you whether the engine will still be running in 90 days.
A working measurement system separates three layers:
- Activity metrics — calls, emails sent, meetings booked, demos delivered. Fast-moving and easy to game. Useful as an early warning, dangerous as a target.
- Pipeline metrics — new opportunities created, stage conversion rates, pipeline coverage, average deal age. This is the diagnostic layer, and most real problems surface here.
- Outcome metrics — closed-won revenue, win rate, quota attainment, customer acquisition cost, net revenue retention. Honest, but too slow to steer by alone.
Almost every mid-market team makes the same mistake. They coach and pay on layer 1, report on layer 3, and ignore layer 2. Layer 2 is where you learn that reps create plenty of opportunities, but 71% die at the technical-evaluation stage because nobody brings in a solutions engineer.
Which sales performance metrics actually matter in 2026?#
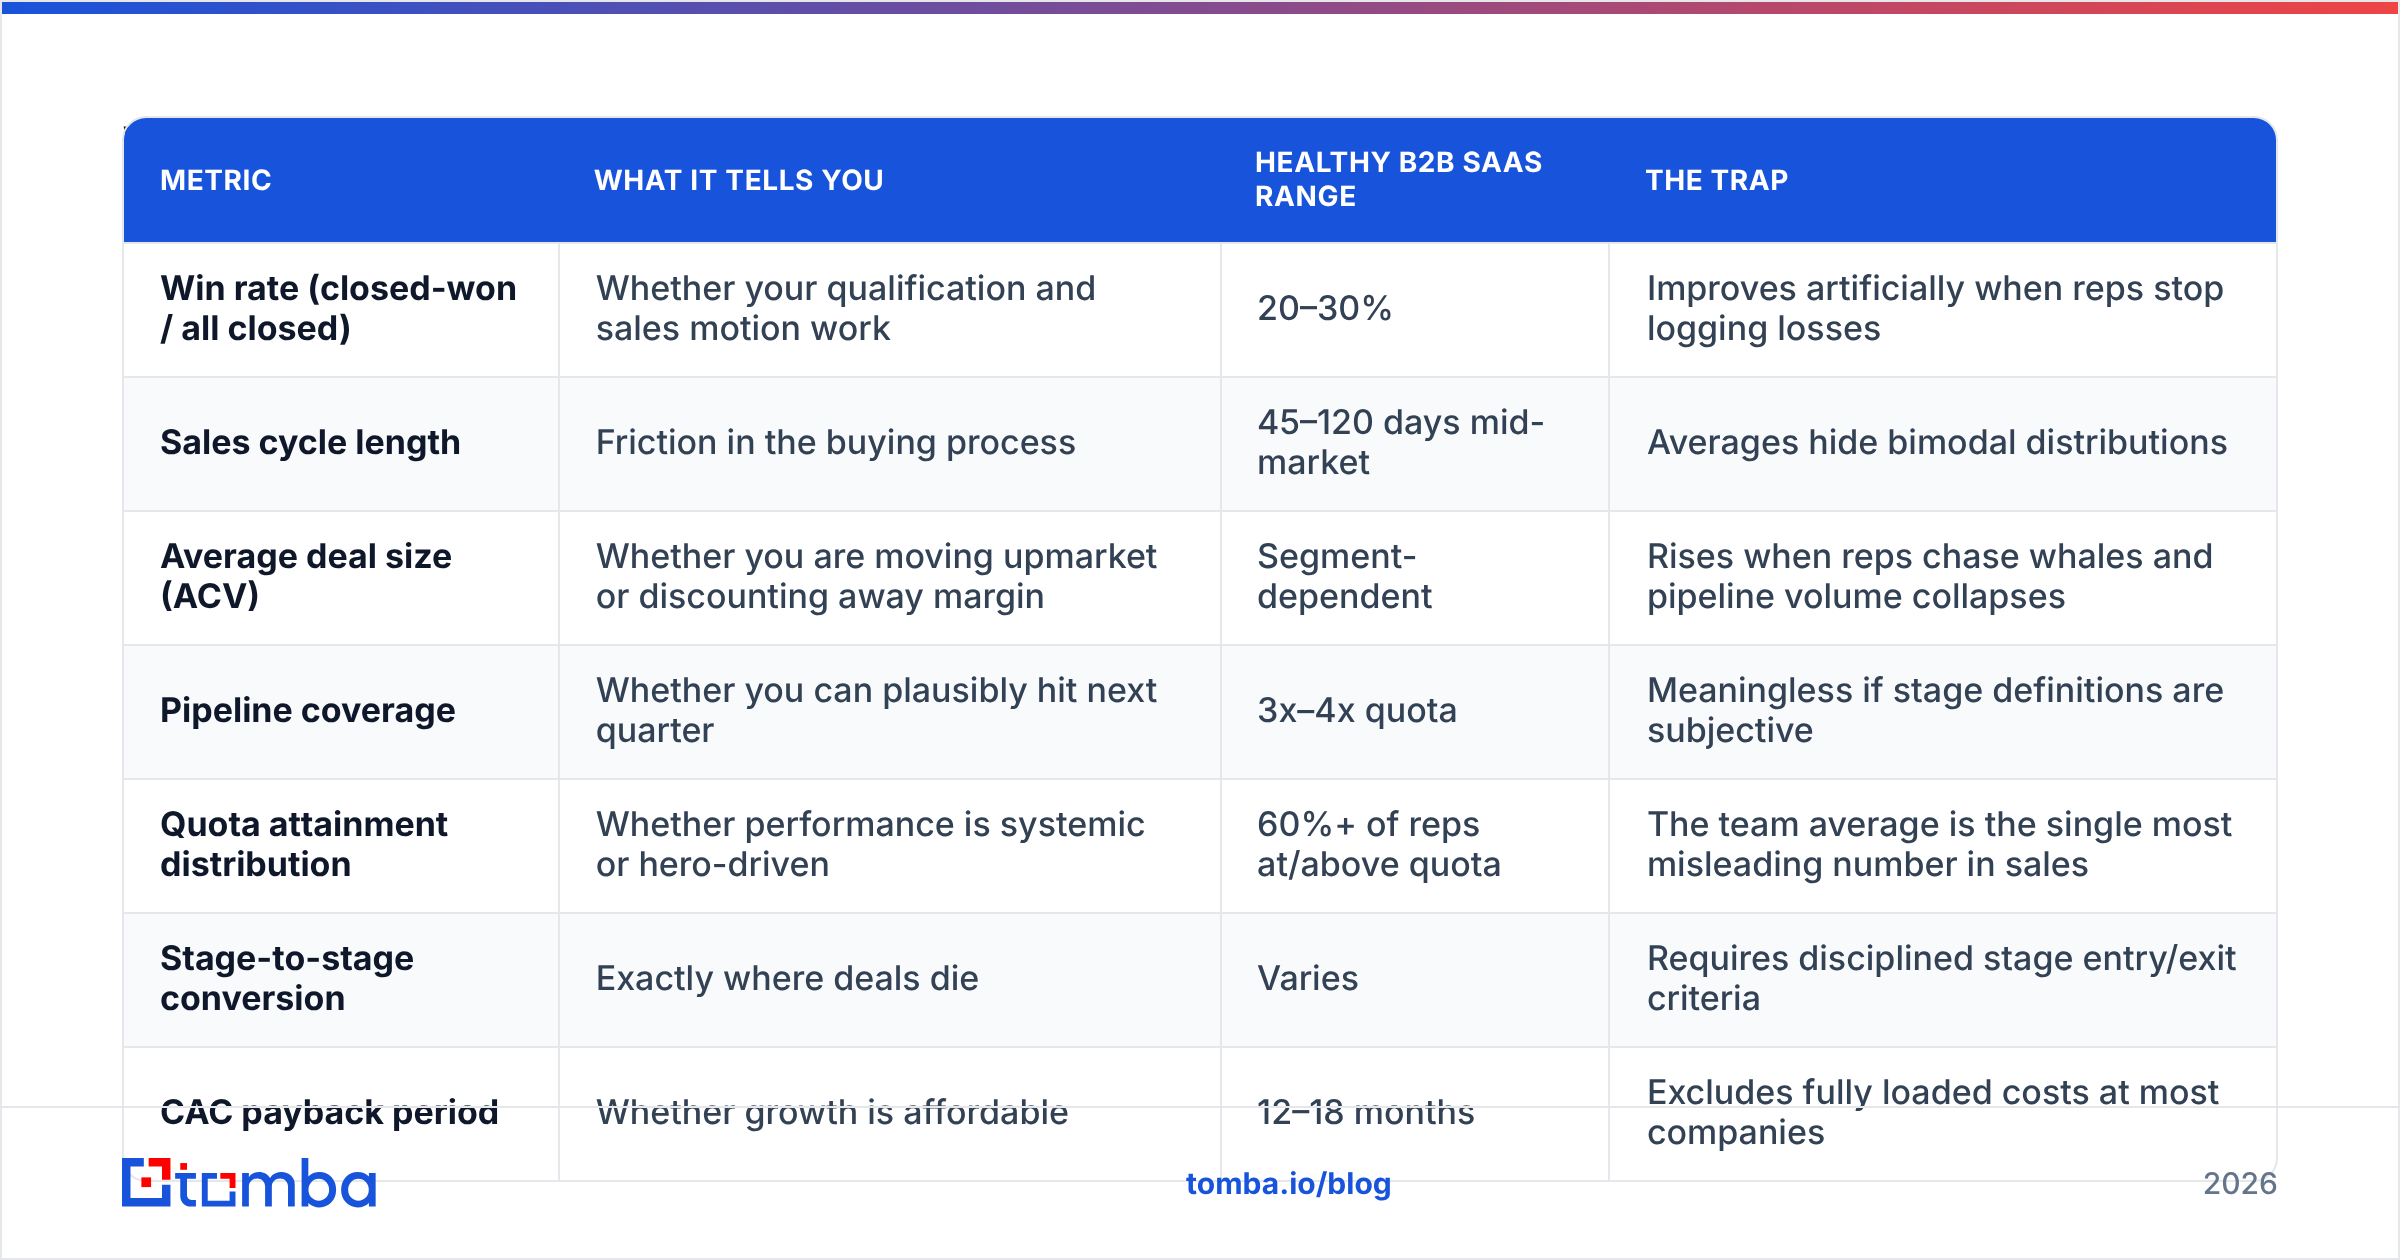
Here are the seven that earn their place on a dashboard, with what each one tells you and the trap attached to it.
| Metric | What it tells you | Healthy B2B SaaS range | The trap |
|---|---|---|---|
| Win rate (closed-won / all closed) | Whether your qualification and sales motion work | 20–30% | Improves artificially when reps stop logging losses |
| Sales cycle length | Friction in the buying process | 45–120 days mid-market | Averages hide two very different groups |
| Average deal size (ACV) | Whether you are moving upmarket or discounting away margin | Segment-dependent | Rises when reps chase whales and pipeline volume collapses |
| Pipeline coverage | Whether you can plausibly hit next quarter | 3x–4x quota | Meaningless if stage definitions are subjective |
| Quota attainment spread | Whether performance is team-wide or hero-driven | 60%+ of reps at/above quota | The team average is the most misleading number in sales |
| Stage-to-stage conversion | Exactly where deals die | Varies | Requires disciplined stage entry/exit criteria |
| CAC payback period | Whether growth is affordable | 12–18 months | Excludes fully loaded costs at most companies |
Two of these deserve extra attention.
Quota attainment spread beats quota attainment average. A team average of 94% sounds fine. Then you look at the spread: two reps at 180%, seven reps at 45%. That is not a 94% team. That is a hiring and enablement failure hidden by arithmetic. Report the median and the share of reps at or above 100%. The win rate picture changes completely.
Stage-to-stage conversion is your highest-leverage diagnostic. A 20% win rate could mean 90% of deals stall at discovery. Or it could mean discovery works fine and pricing kills everything. Those need opposite fixes. Without per-stage conversion, you are guessing.
How do you build a measurement framework from scratch?#
Do it in this order. Skipping step one is why most dashboards are decorative: metrics computed on a list where a third of emails bounce are fiction.
- Fix your data foundation first. Give each stage objective entry and exit criteria. "Budget and timeline confirmed in writing" beats "feels warm." Then audit your contact data.
- Pick one metric per layer. Meetings booked, stage-2-to-3 conversion, win rate. Three numbers you watch beat thirty you export and ignore.
- Build a 90-day baseline. You cannot spot a change without a before. Set targets later, or you will anchor on noise.
- Segment before you conclude. Inbound and outbound win rates are different businesses sharing a CRM. Blend them and the average describes nobody.
- Give each metric one owner and one action. A metric nobody owns is a screensaver. Write the trigger condition and name who responds.
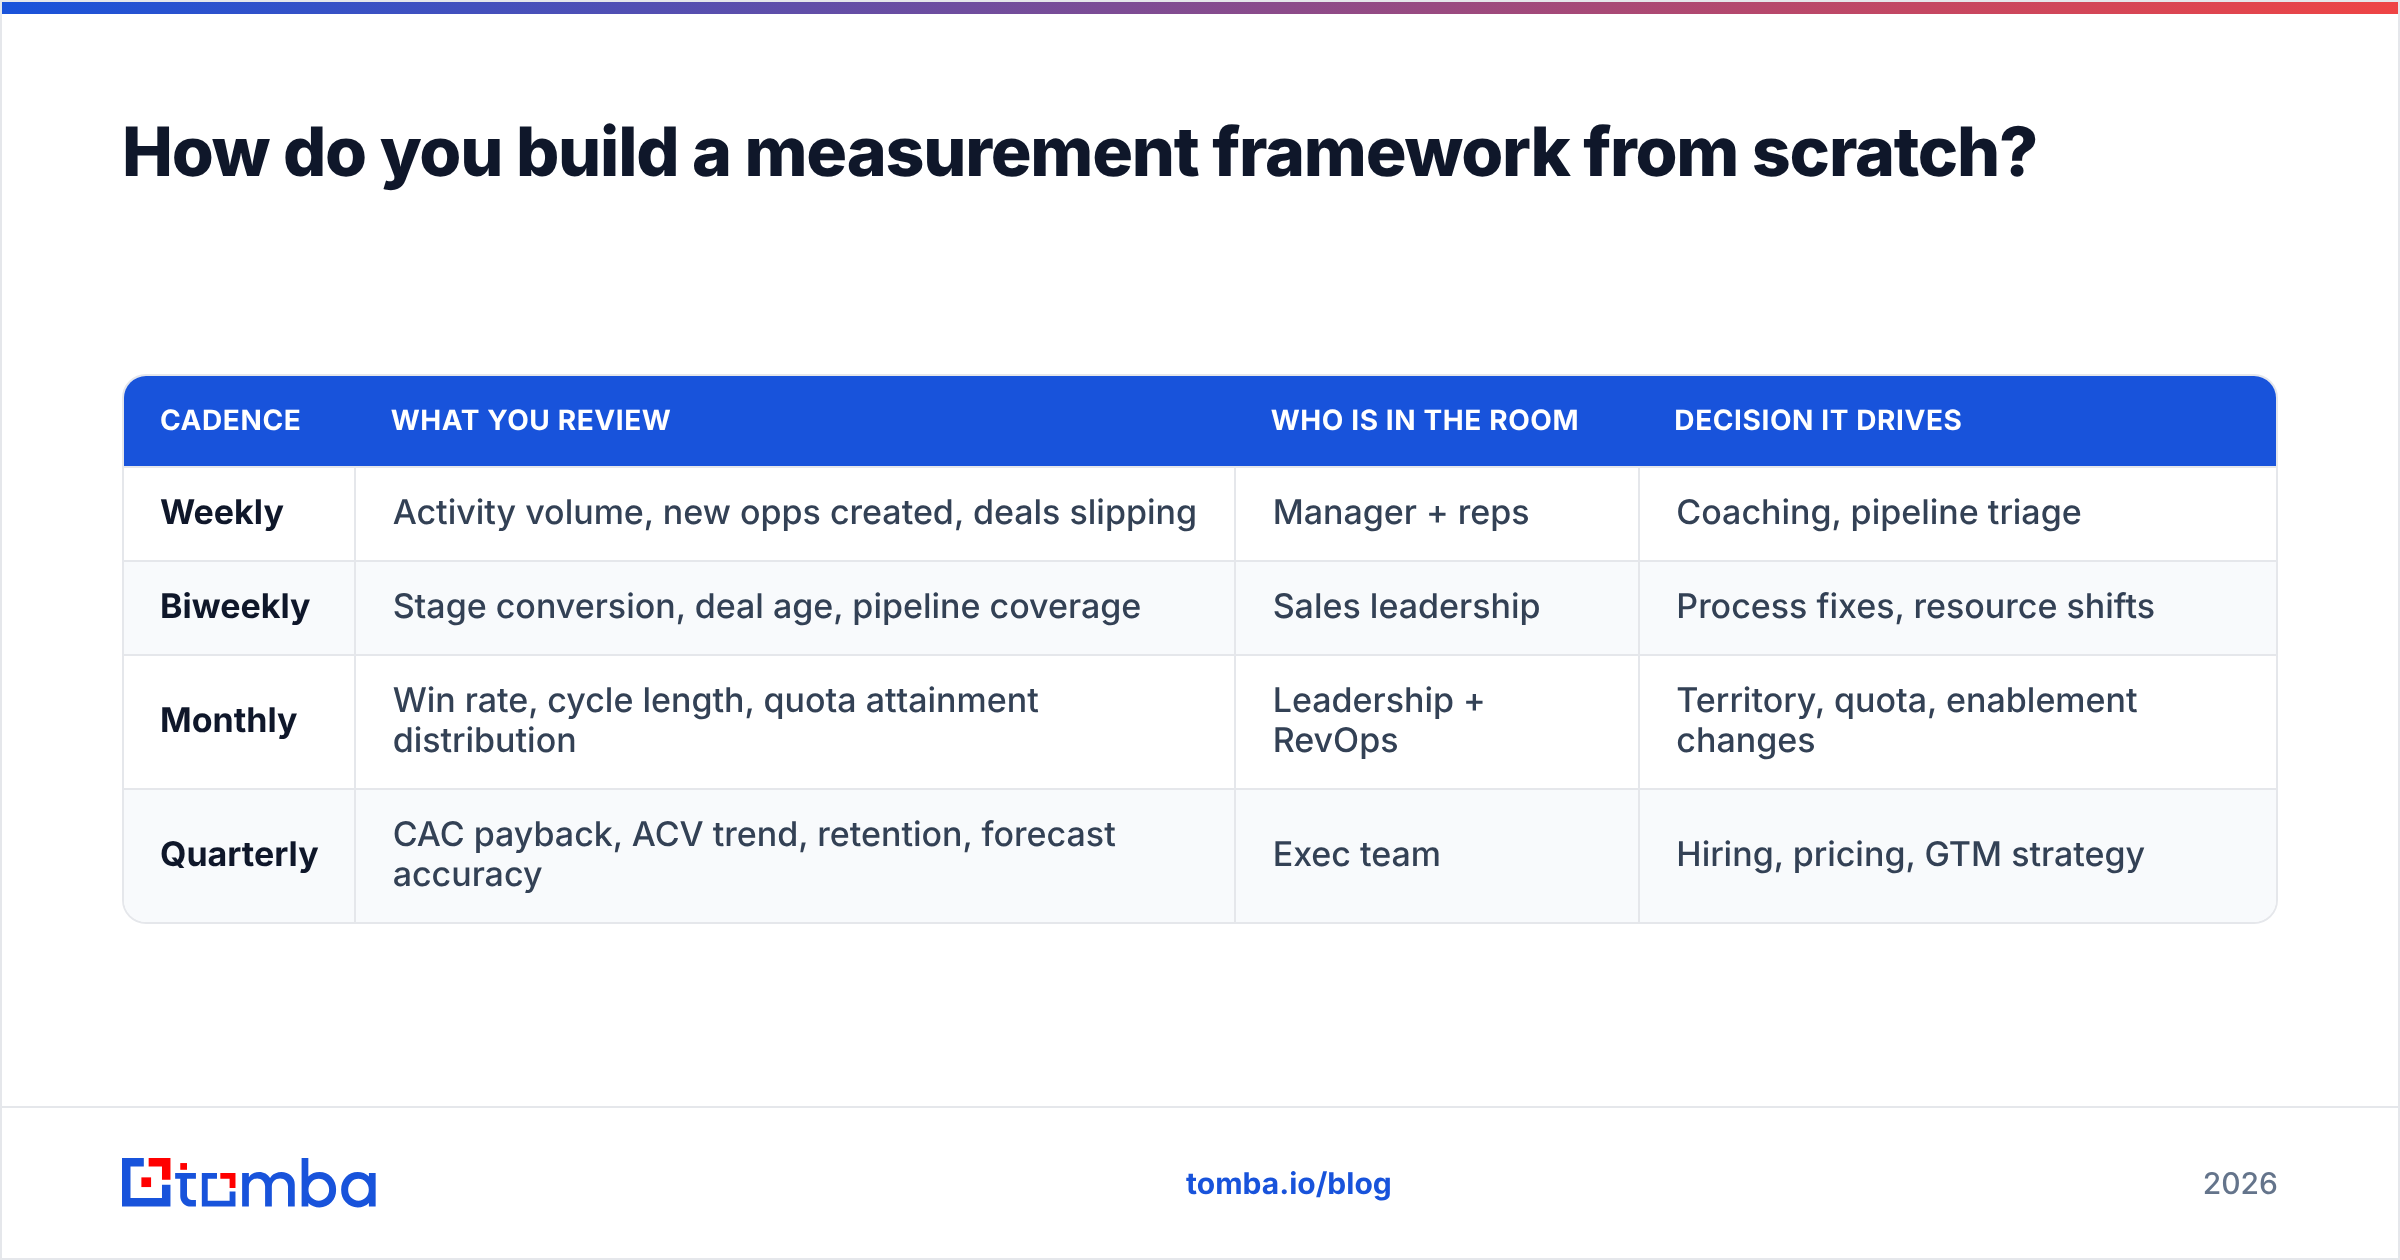
- Match the review cadence to the metric. See the table below.
| Cadence | What you review | Who is in the room | Decision it drives |
|---|---|---|---|
| Weekly | Activity volume, new opps created, deals slipping | Manager + reps | Coaching, pipeline triage |
| Biweekly | Stage conversion, deal age, pipeline coverage | Sales leadership | Process fixes, resource shifts |
| Monthly | Win rate, cycle length, quota attainment spread | Leadership + RevOps | Territory, quota, enablement changes |
| Quarterly | CAC payback, ACV trend, retention, forecast accuracy | Exec team | Hiring, pricing, GTM strategy |
The cadence discipline matters more than it sounds. Win rate reviewed weekly on a 60-day cycle is pure noise. You will chase random swings and whipsaw the team. Activity reviewed quarterly is useless, because the quarter is already lost.
Why do most sales dashboards give you the wrong answer?#
Because the inputs are dirty, and nobody audits the inputs.
Every ratio you compute has a denominator built from your prospect list and CRM hygiene. Win rate, conversion rate, cost per meeting: all of them. Corrupt either input and every conclusion is wrong in a way that still looks plausible.
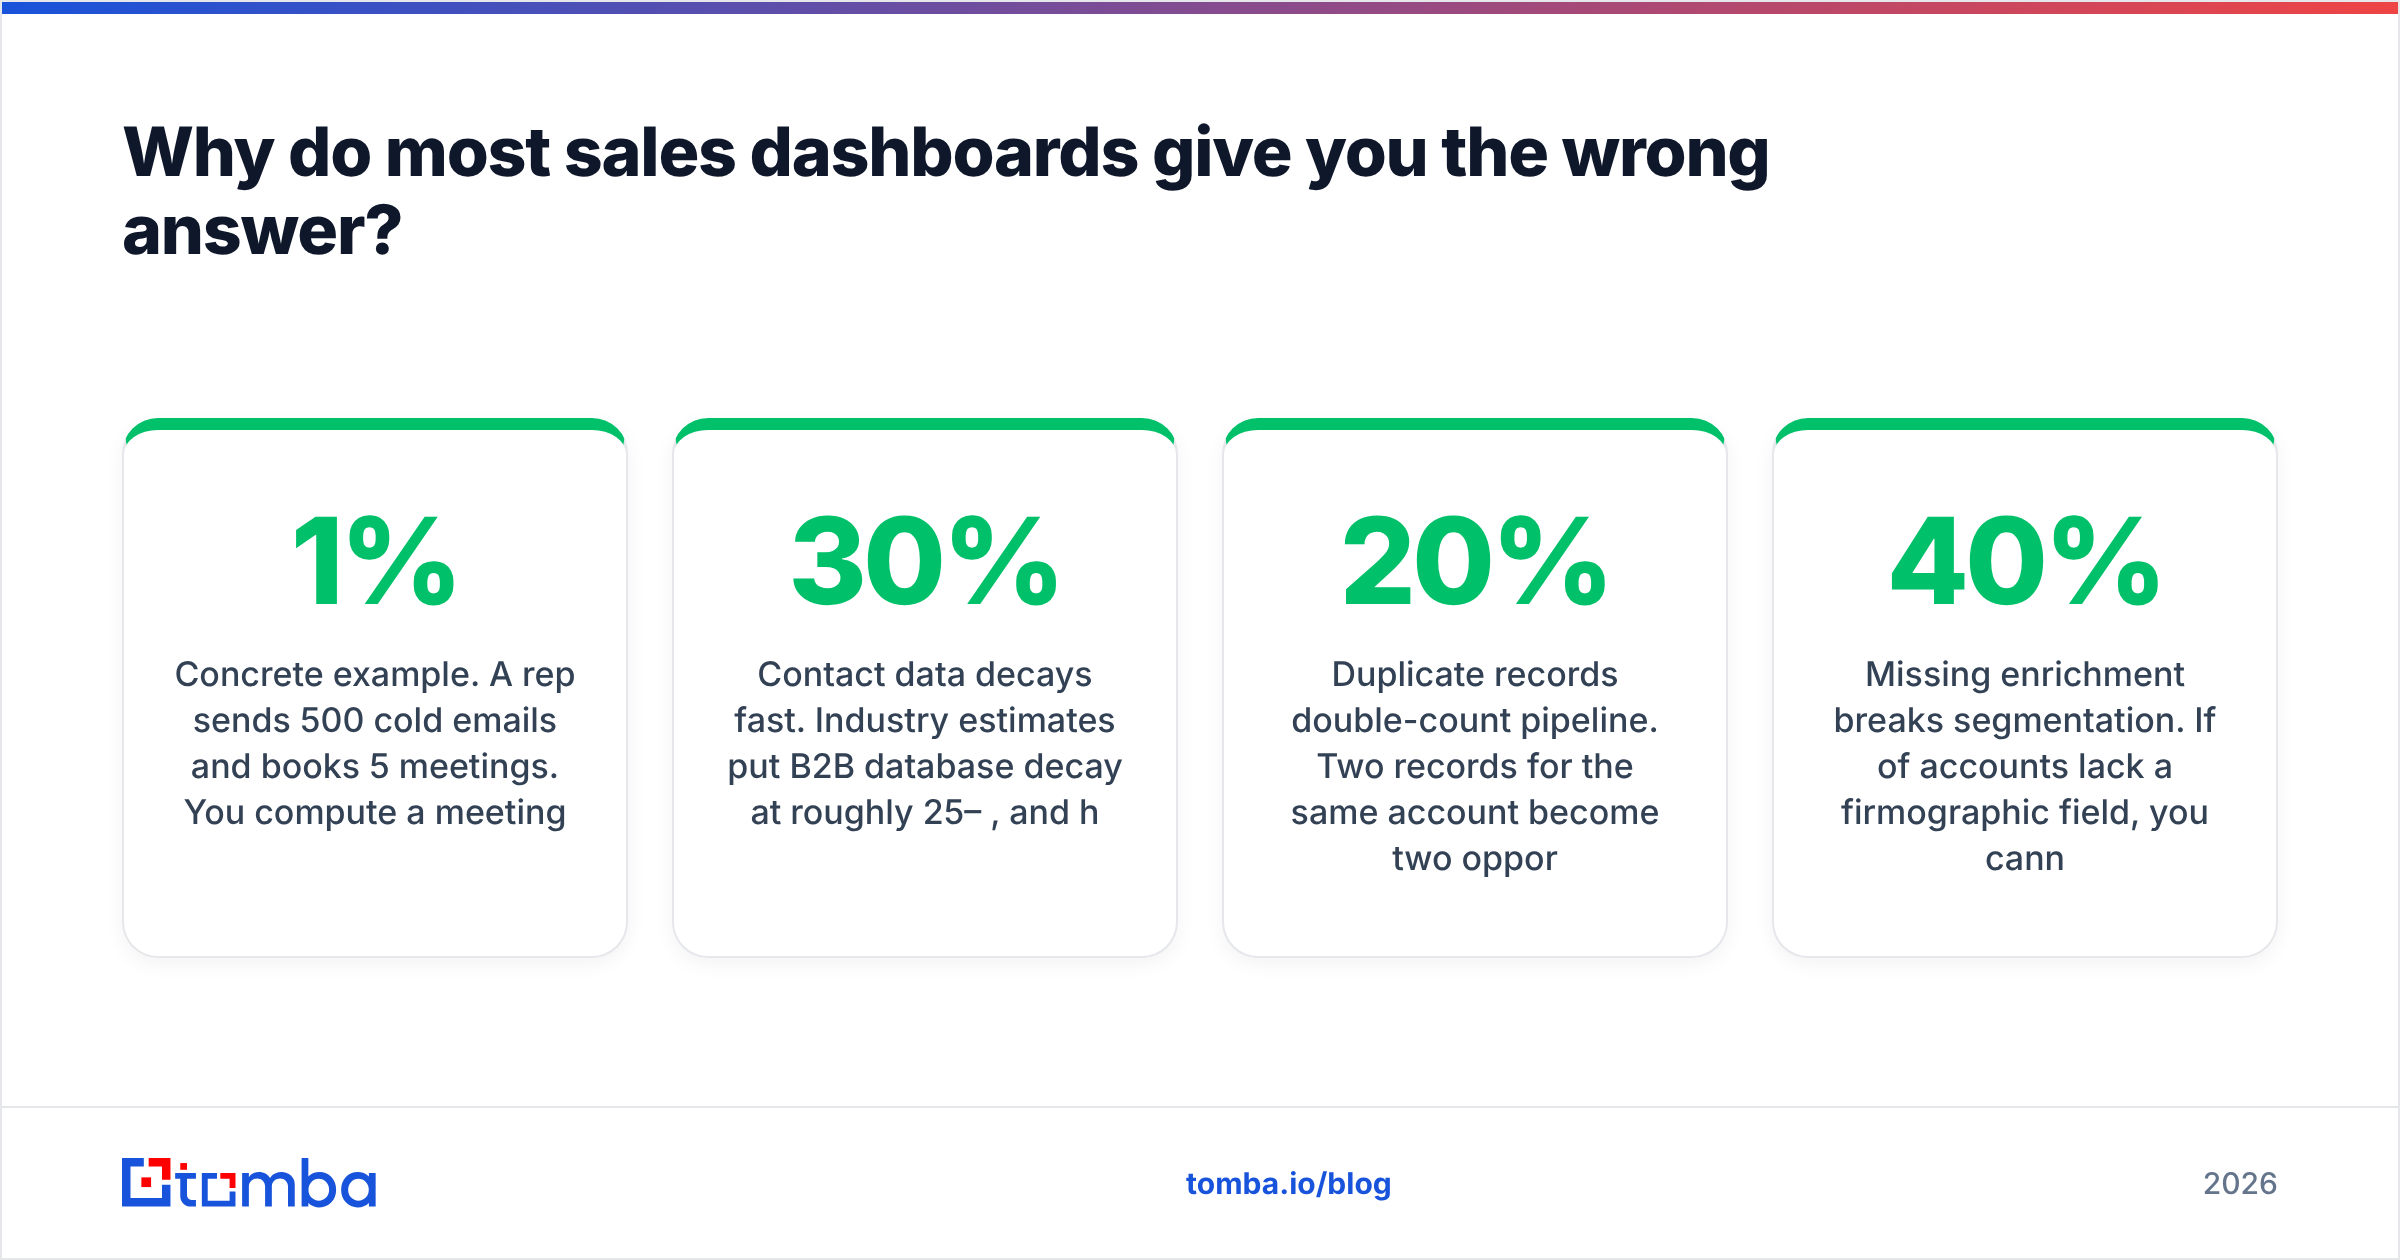
Here is a concrete example. A rep sends 500 cold emails and books 5 meetings. You compute a 1% meeting rate and blame the messaging. But 180 of those emails bounced or hit dead mailboxes. The real delivered-to-meeting rate is 5/320, or over 1.5%. That is roughly benchmark. You were about to rewrite a sequence that worked and blame a rep who did nothing wrong.
Contact data decays fast. Industry estimates put B2B database decay at 25–30% per year, and higher in volatile segments. HubSpot's research on database decay has tracked this pattern for over a decade. Job changes, domain migrations, and acquisitions quietly rot your list. Meanwhile your dashboard keeps computing confident-looking ratios on top of it.

Three data problems break performance measurement in particular:
- Bounces inflate your activity denominators. Normalize on delivered volume, not sent volume. Run your list through an email verifier before the campaign, not after the postmortem.
- Duplicate records double-count pipeline. Two records for one account become two opportunities, and coverage looks 20% healthier than it is. Deduplicate on domain, not on display name.
- Missing enrichment breaks segmentation. If 40% of accounts lack company size or industry, you cannot split win rate by segment. And unsegmented win rate is close to meaningless. Contact enrichment is a prerequisite for honest analysis, not a nice-to-have.
Before you accept any performance number, ask two things: what is the denominator, and who verified it?
How do you measure individual reps without destroying the team?#
Measure reps on inputs they control and on ratios, not on raw outcome volume alone.
Raw closed-won favors whoever got the good territory. A rep with a 34% win rate on 20 opportunities often beats a rep with a 19% win rate on 45. The first one qualifies properly. The second sprays. Territory, inbound allocation, and segment mix all distort raw numbers. Ratios even them out.
A defensible rep scorecard looks like this:
- Activity quality, not just volume — meetings held per 100 verified contacts reached, not emails sent
- Conversion efficiency — their stage-to-stage rates against the team median
- Pipeline hygiene — share of deals with an accurate next step and close date
- Forecast accuracy — how close their call was 30 days out, tracked over time
- Outcome — quota attainment and win rate, segmented by deal source
Forecast accuracy is the underrated one. A rep who calls their number within 10% every quarter is worth more to leadership than one who wildly overshoots and undershoots at the same average. You can plan around the first rep. You cannot plan around the second.
For the comparison layer, G2's sales analytics category is a reasonable neutral place to start when you evaluate tooling. But resist buying an analytics platform to fix a definitions problem. No dashboard will fix subjective stage criteria.
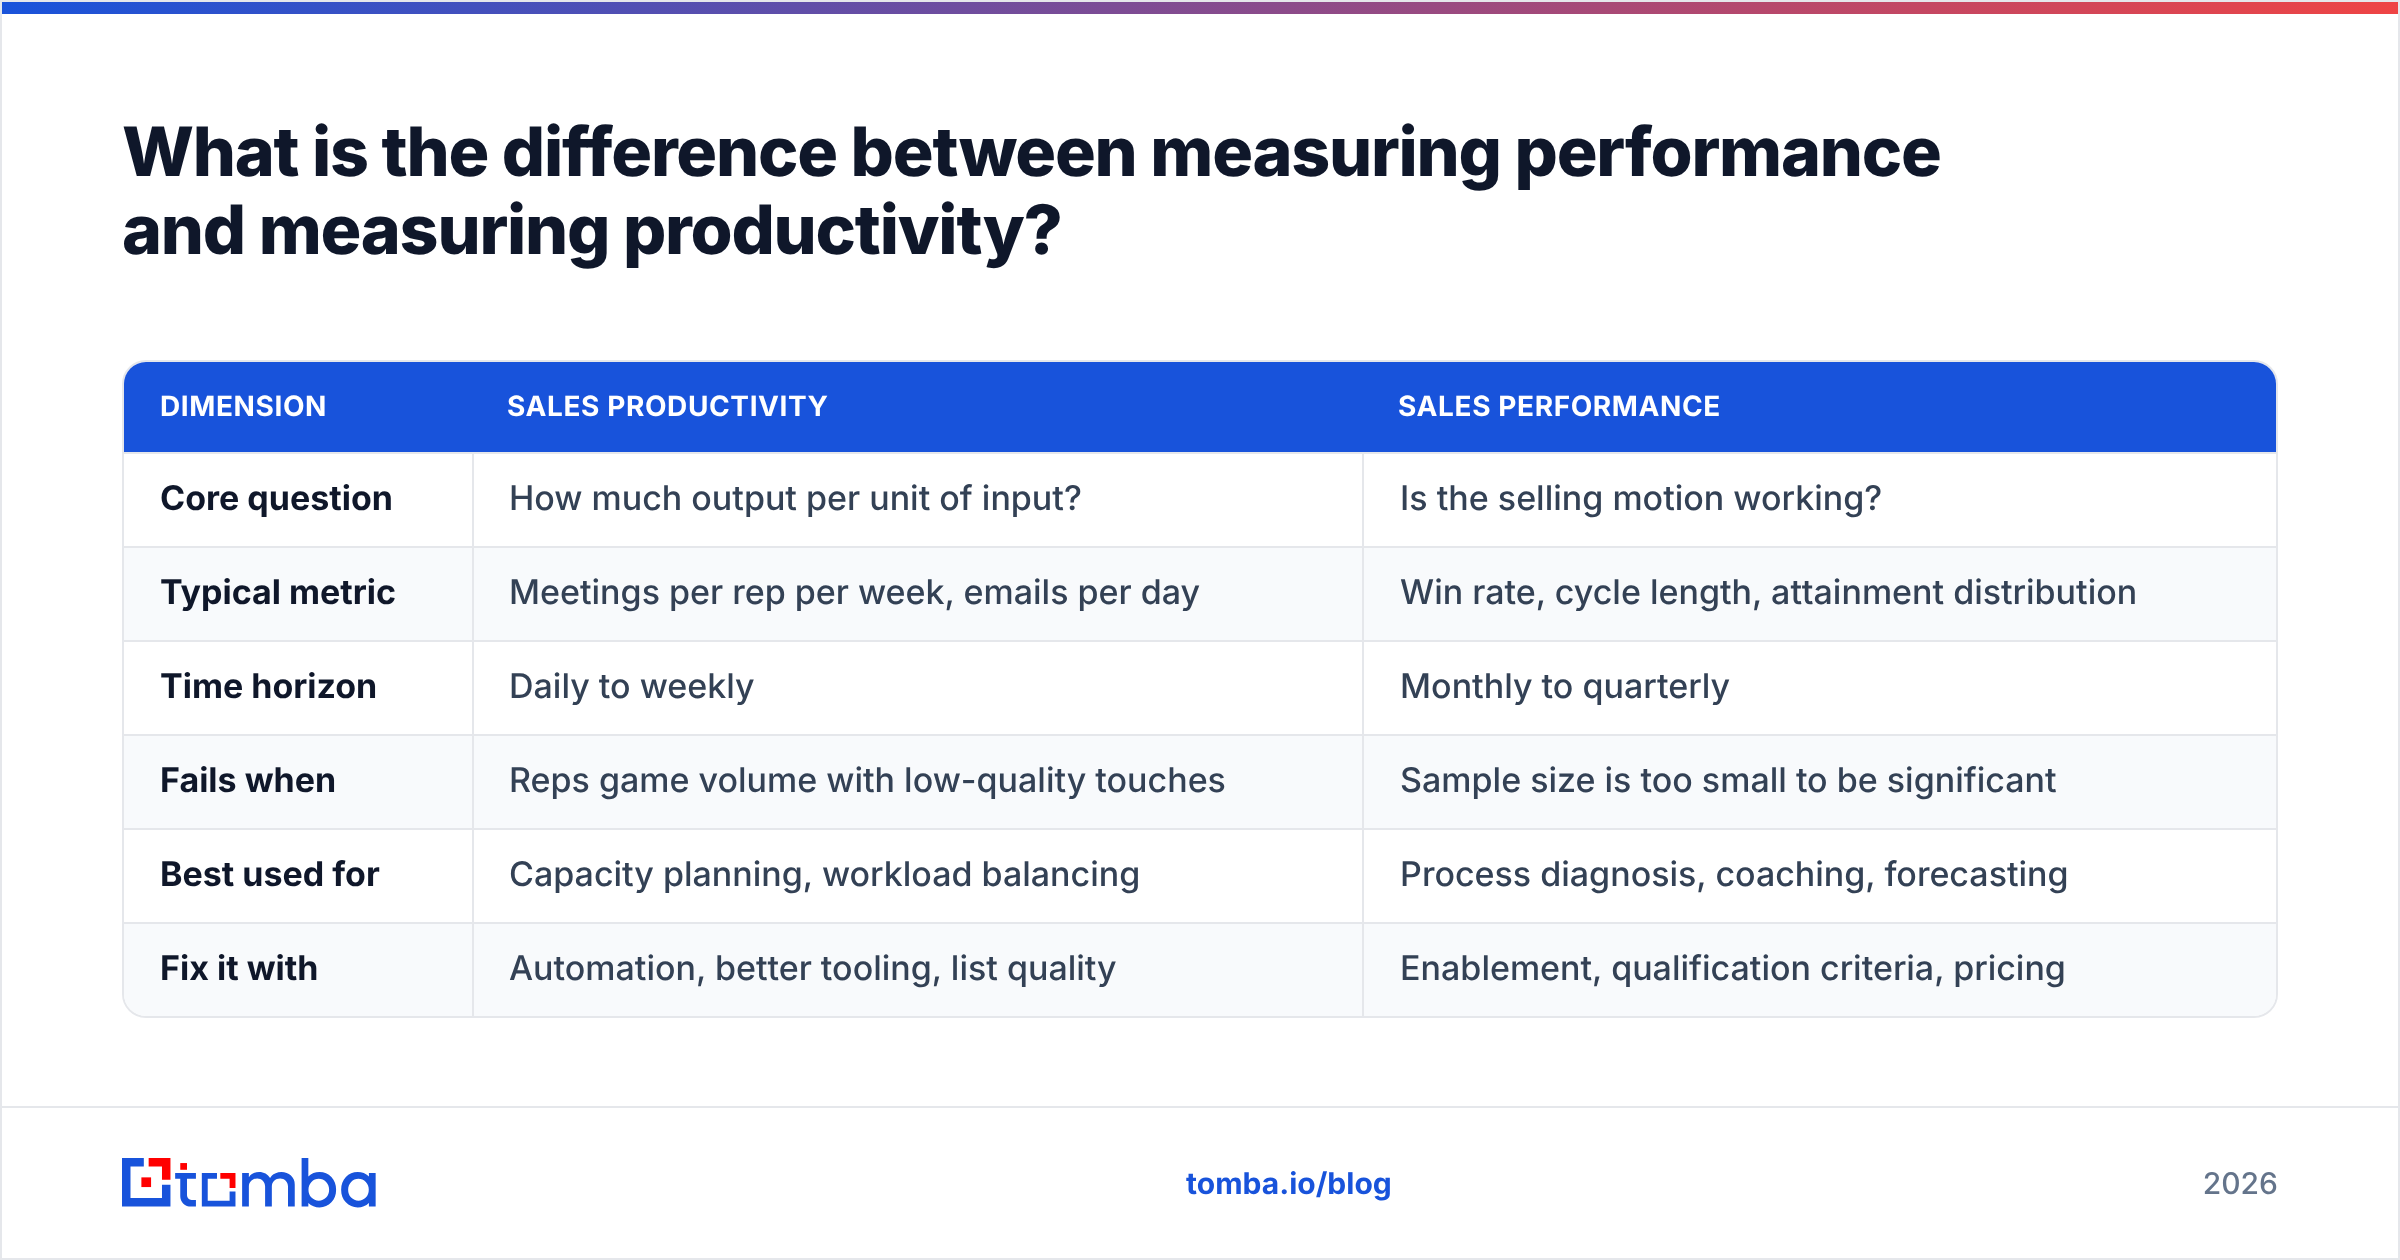
What is the difference between measuring performance and measuring productivity?#
They answer different questions. Confusing them causes most bad sales-management decisions.
| Dimension | Sales productivity | Sales performance |
|---|---|---|
| Core question | How much output per unit of input? | Is the selling motion working? |
| Typical metric | Meetings per rep per week, emails per day | Win rate, cycle length, attainment spread |
| Time horizon | Daily to weekly | Monthly to quarterly |
| Fails when | Reps game volume with low-quality touches | Sample size is too small to be significant |
| Best used for | Capacity planning, workload balancing | Process diagnosis, coaching, forecasting |
| Fix it with | Automation, better tooling, list quality | Enablement, qualification criteria, pricing |
Productivity problems are solved with tools and automation. Performance problems are solved with skill, positioning, and qualification. Throw an automation tool at a 12% win rate and reps just lose faster. Throw enablement at a rep who spends four hours a day researching contacts by hand, and you spend a training budget on a data problem.
Diagnose which one you have before you spend money. The tell is simple. High activity and low conversion means a performance problem. Fine conversion and low activity means a productivity problem, and usually that your reps are doing data entry instead of selling. A bulk email finder or a CRM-connected enrichment step removes hours of manual lookup per rep each week. That is a productivity fix, not a performance one.
How often should you change what you measure?#
Rarely. Metric churn is a real failure mode.
Change a definition and you reset your trend line to zero. That applies to how a stage is entered, what counts as a qualified opportunity, and whether renewals count in win rate. Teams that redefine metrics every quarter never build enough history to see anything.
A reasonable policy:
- Definitions change at most once a year, at planning time, with a changelog
- Targets can move quarterly as the business changes
- New metrics run in shadow for one full cycle before they affect comp or decisions
- Never change a metric mid-quarter while it is tied to compensation
When you do change something, keep computing the old definition in parallel for two quarters. Otherwise "win rate improved from 22% to 29%" is indistinguishable from "we changed what counts as a loss."
Where should you start this week?#
If you are working out how to measure sales performance from a blank page, use this 30-day sequence:
- Week 1 — Write objective entry and exit criteria for every pipeline stage. Get the team to agree in one meeting, not a Slack thread.
- Week 2 — Audit data quality. Verify your active prospect list, deduplicate accounts by domain, and measure your true bounce rate. Log the number. It is your baseline.
- Week 3 — Instrument the three starter metrics: meetings held, stage-2-to-3 conversion, win rate. Segment each by inbound versus outbound from day one.
- Week 4 — Set the review cadence and give each metric an owner. Write the trigger conditions that turn a red number into a scheduled action.
Then wait 90 days before you draw conclusions. Sales data is noisy at small sample sizes. The fastest way to lose your team's trust is to redraw territories based on six weeks of random swings.
Start with data you can trust#
Knowing how to measure sales performance is worthless if the contact data underneath is wrong. Bounce-inflated denominators, duplicate accounts, and missing company fields do more than add noise. They produce confident, specific, wrong conclusions, and reps get coached for problems they do not have.
Fix the foundation first. Tomba's Email Finder gives you verified professional email addresses by domain, name, or company. Your delivered-volume denominators then reflect reality instead of guesswork. The free tier includes 25 searches a month, enough to test your current list quality. Paid plans start at $49/mo on Starter and $99/mo on Growth if you need volume, and full Tomba pricing is public. Verify your list, rerun your ratios, and see how many of your performance problems were data problems all along.
Related guides#
// get started
Find, verify and enrich your first contacts today
Start on the free plan with 25 searches a month, then scale when your team is ready.
Free plan · No credit card required · GDPR & CCPA
// about the author