Inbound Lead Conversion Rate: Benchmarks and How to Fix Yours
Most teams report an inbound lead conversion rate that flatters the funnel and hides the leak. Here is the honest math, realistic 2026 benchmarks by stage and channel, and the levers that actually move the number.
TL;DR
- Inbound lead conversion rate is not one number. It is a chain of stage-to-stage rates, and reporting only the end-to-end figure hides exactly where you are losing money.
- Realistic B2B ranges: 25-45% form-fill to MQL, 10-25% MQL to SQL, 15-30% SQL to closed-won. End-to-end inbound lead to customer usually lands between 2% and 6%.
- The biggest single lever is almost never landing page copy. It is response time, routing accuracy, and whether the contact record is complete enough to act on.
- Bad contact data silently caps your ceiling: a 15% bounce rate on nurture and a missing phone number on 40% of records will beat any subject line test you run.
- Fix the denominator first. Half of "low conversion rate" problems are counting problems — duplicate records, bot fills, and snapshot math instead of cohort math.
Your inbound lead conversion rate is the number your CFO quotes back at you in board meetings and the number your demand gen team least wants to explain. It is also the most commonly mismeasured metric in B2B. This guide covers what the number actually means, what a defensible benchmark looks like in 2026, how to calculate it without fooling yourself, and which levers move it in a quarter rather than a year.
What is an inbound lead conversion rate?#
Inbound lead conversion rate is the percentage of self-initiated leads that advance to a defined next stage. The formula is trivial:
Conversion rate = (leads that reached stage B ÷ leads that entered stage A) × 100
The trap is that "stage A" and "stage B" are wildly different from company to company. When a peer tells you they run a 22% inbound conversion rate, that number is meaningless until you know which two stages they picked.
Here is the chain most B2B teams are actually working with:
- Visitor to lead — an anonymous session becomes a known contact via a form, chat, demo request, or content download. This is where volume is decided.
- Lead to MQL — the contact passes a scoring or fit threshold. A marketing qualified lead is a marketing-side judgment, not a sales commitment.
- MQL to SQL — sales accepts the lead as worth working. This is the handoff where most organizations bleed, because it is the only stage where two departments must agree.
- SQL to opportunity — a real, forecastable deal with a stated need and a rough budget.
- Opportunity to closed-won — the conversion everyone else in the company means when they say "conversion."
Report the whole chain or you will optimize the wrong stage. A team celebrating a 40% lead-to-MQL rate while MQL-to-SQL sits at 8% does not have a marketing win. It has a scoring model that is rubber-stamping unqualified traffic.
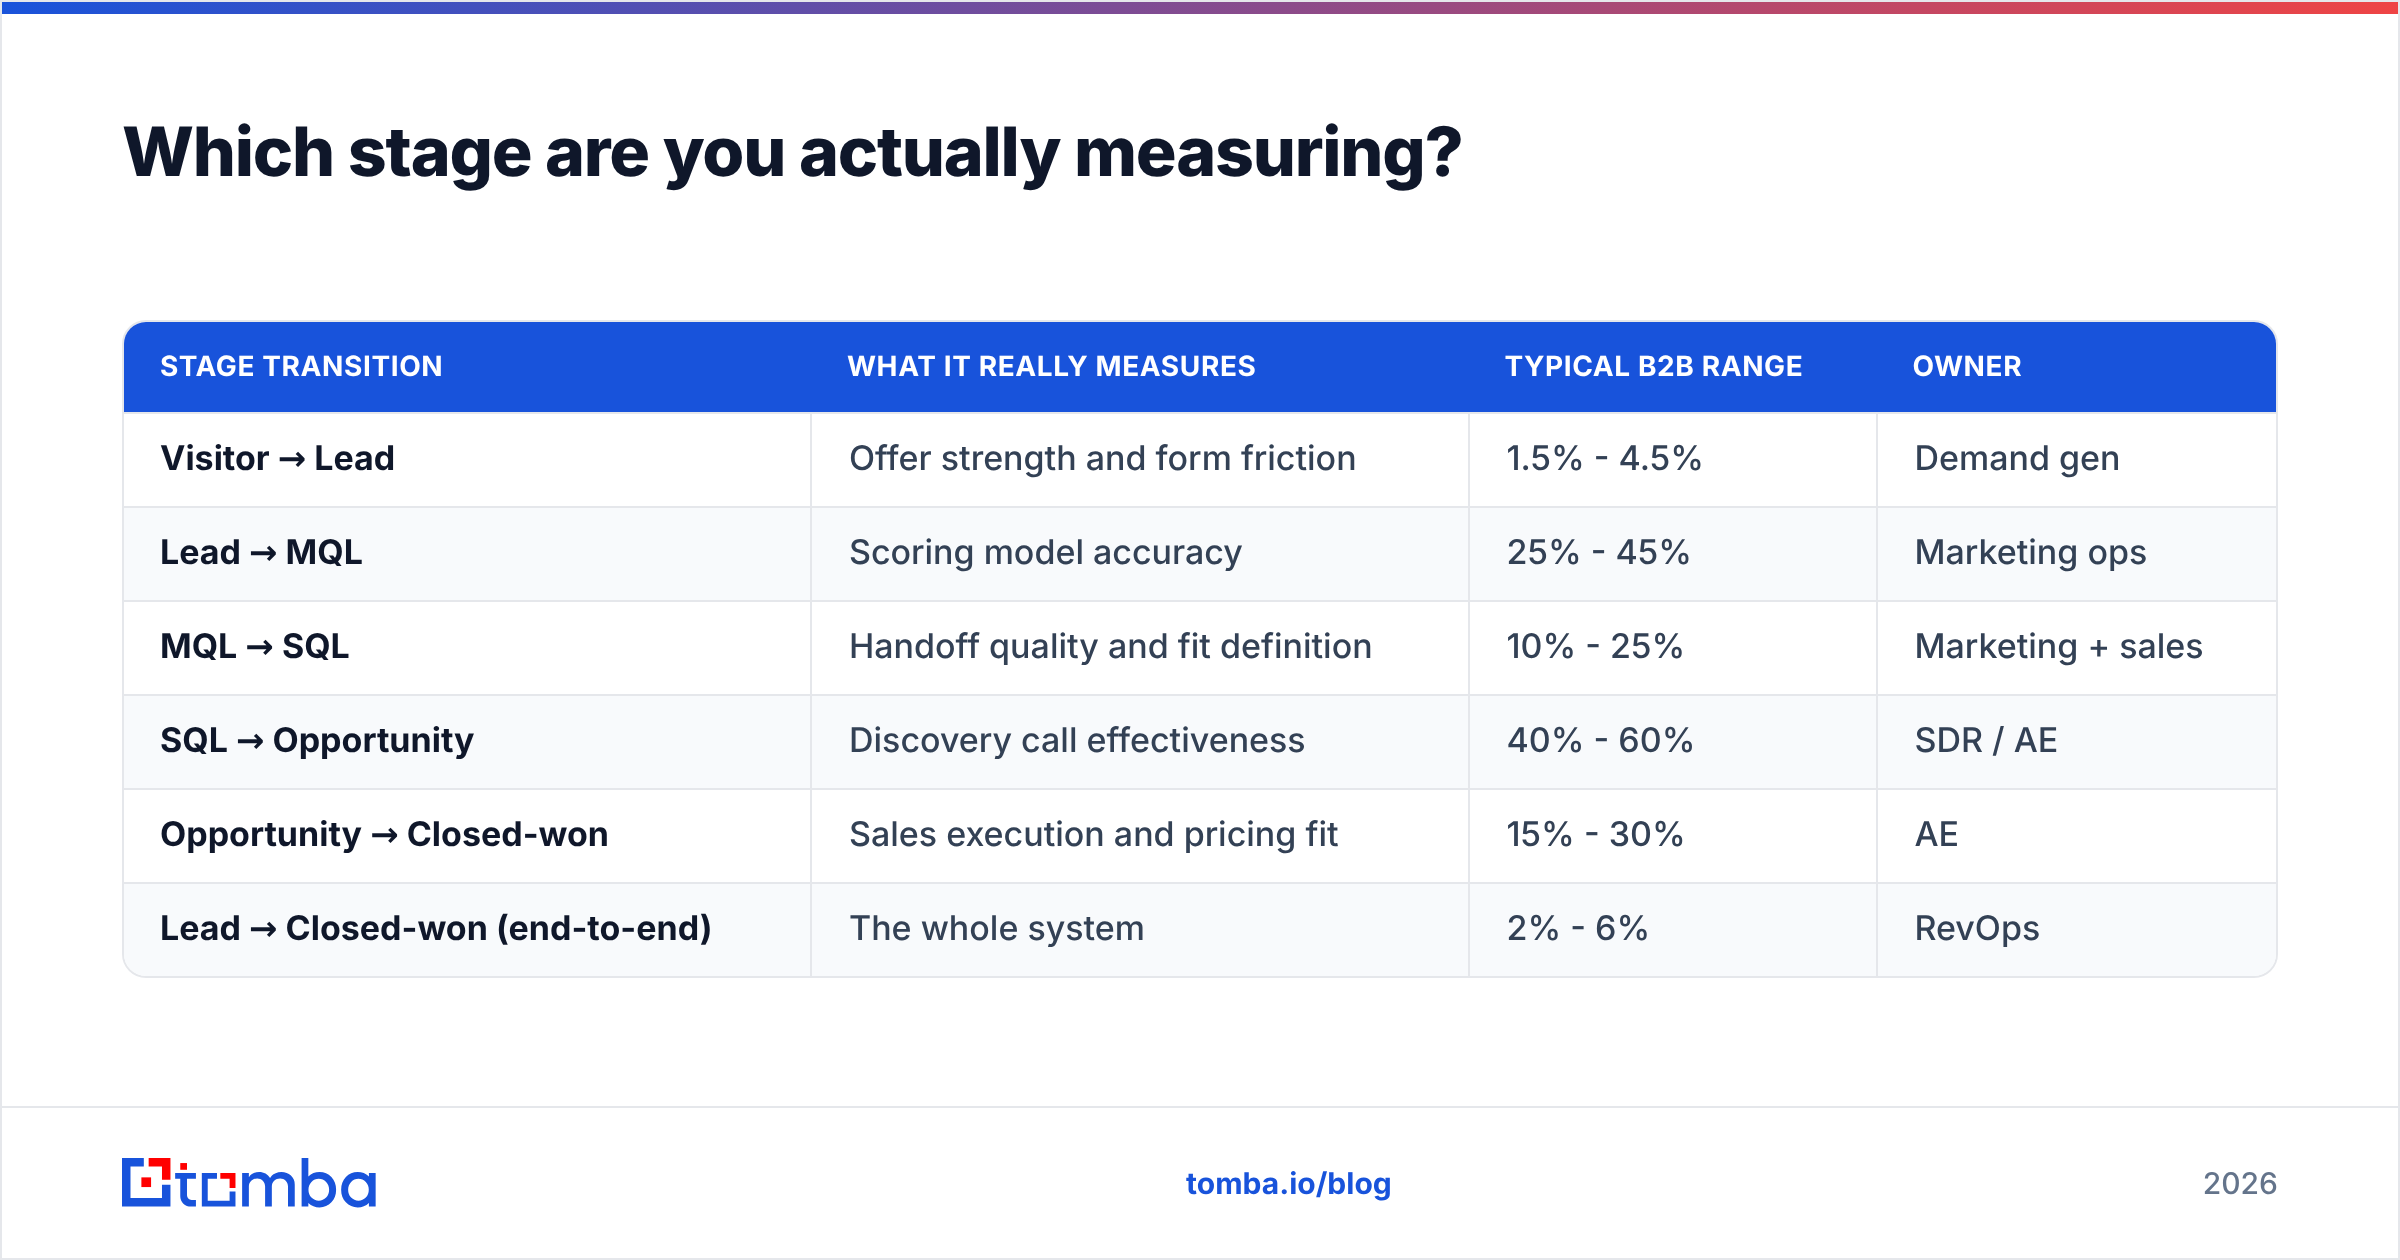
Which stage are you actually measuring?#
| Stage transition | What it really measures | Typical B2B range | Owner |
|---|---|---|---|
| Visitor → Lead | Offer strength and form friction | 1.5% - 4.5% | Demand gen |
| Lead → MQL | Scoring model accuracy | 25% - 45% | Marketing ops |
| MQL → SQL | Handoff quality and fit definition | 10% - 25% | Marketing + sales |
| SQL → Opportunity | Discovery call effectiveness | 40% - 60% | SDR / AE |
| Opportunity → Closed-won | Sales execution and pricing fit | 15% - 30% | AE |
| Lead → Closed-won (end-to-end) | The whole system | 2% - 6% | RevOps |
Those ranges are composites of publicly reported vendor benchmarks and should be treated as orientation, not gospel. A $200 self-serve product and a $180k enterprise platform will not share a distribution. Your own trailing four quarters are a better benchmark than anyone else's median.
What counts as a good inbound lead conversion rate in 2026?#
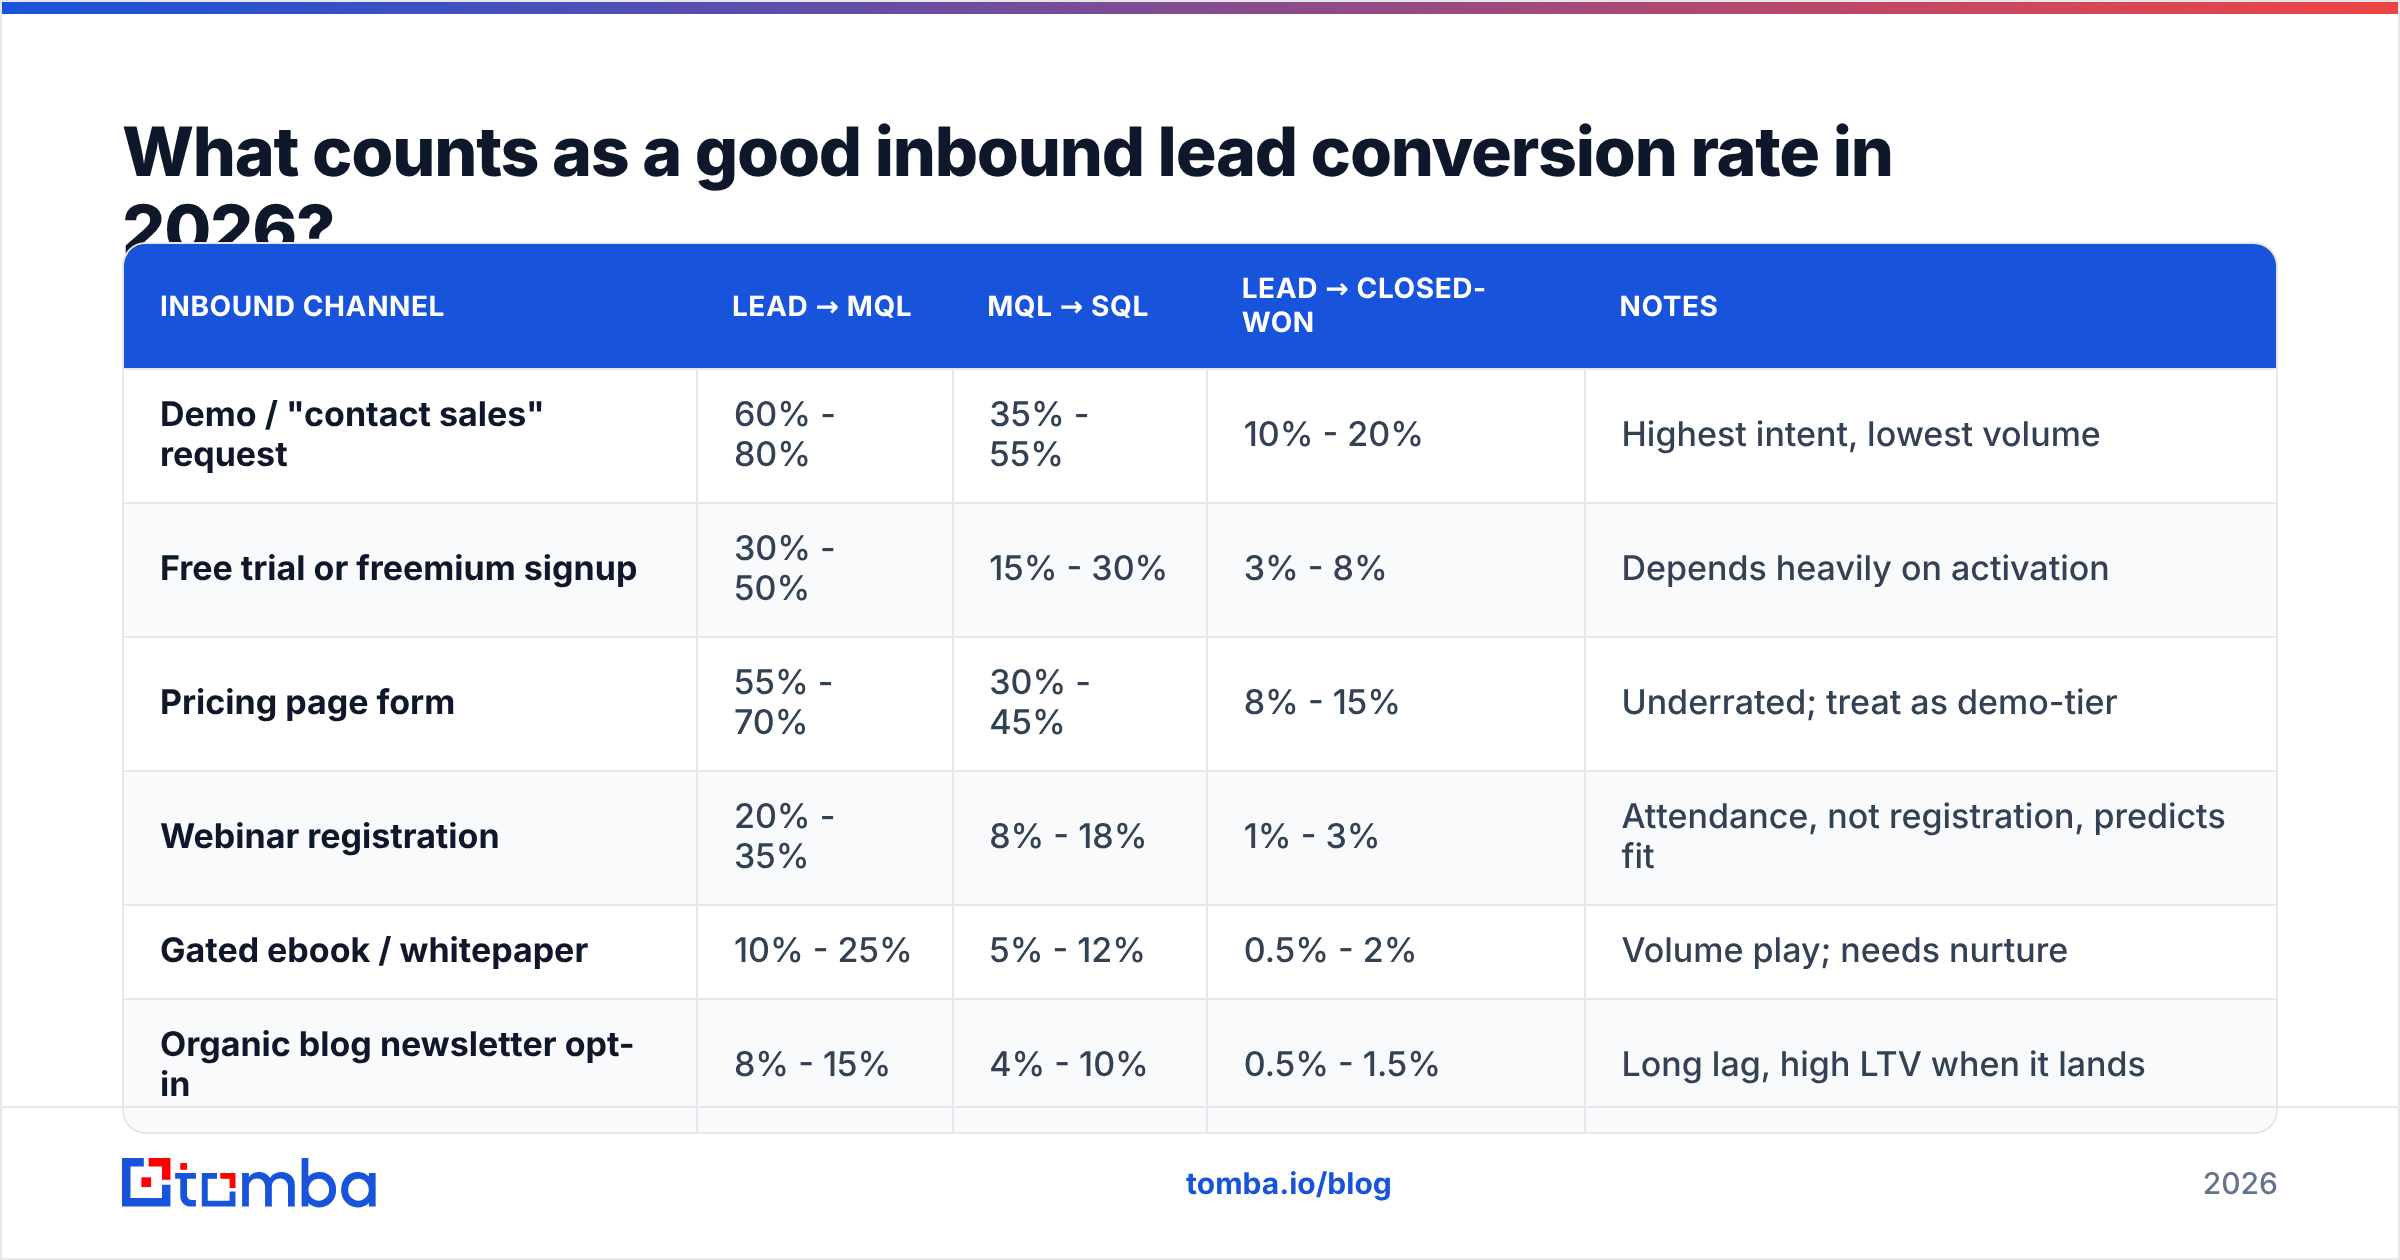
Channel matters more than most dashboards admit. A demo request and an ebook download are both "inbound leads" in your CRM and they are nothing alike.
| Inbound channel | Lead → MQL | MQL → SQL | Lead → Closed-won | Notes |
|---|---|---|---|---|
| Demo / "contact sales" request | 60% - 80% | 35% - 55% | 10% - 20% | Highest intent, lowest volume |
| Free trial or freemium signup | 30% - 50% | 15% - 30% | 3% - 8% | Depends heavily on activation |
| Pricing page form | 55% - 70% | 30% - 45% | 8% - 15% | Underrated; treat as demo-tier |
| Webinar registration | 20% - 35% | 8% - 18% | 1% - 3% | Attendance, not registration, predicts fit |
| Gated ebook / whitepaper | 10% - 25% | 5% - 12% | 0.5% - 2% | Volume play; needs nurture |
| Organic blog newsletter opt-in | 8% - 15% | 4% - 10% | 0.5% - 1.5% | Long lag, high LTV when it lands |
Two conclusions fall out of this table immediately. First, if your blended inbound number is dropping, check the mix before you check the execution — a successful ebook campaign will tank your average while adding pipeline. Second, high-intent channels deserve disproportionate operational investment. A pricing page form that sits unworked for six hours is a more expensive failure than a hundred ungated ebook downloads.
Public benchmark libraries like HubSpot's marketing statistics roundup and Gartner's B2B sales research are useful for sanity-checking direction, but they aggregate across company sizes and deal values that may not resemble yours.
Why is your inbound lead conversion rate below benchmark?#
In roughly this order of frequency:
- Speed to lead. The gap between form submission and first human contact is the highest-correlation variable in inbound. Response inside five minutes versus inside an hour is not a marginal difference — it is a different business. Most teams measure their median response time and quietly ignore the tail, where 20% of leads wait more than a day.
- Routing errors. Leads land with the wrong owner, in the wrong territory, or in an unowned queue. This is a plumbing problem that produces a "conversion" symptom, and it is invisible unless you audit ownership assignment against a random sample.
- A scoring model nobody has retrained. Lead scores built two years ago against a different ICP will keep firing confidently at the wrong accounts. If your MQL-to-SQL rate is under 10%, the score is the suspect, not the sales team.
- Incomplete contact records. A lead with a personal Gmail address, no company domain, no title, and no phone number is not a lead — it is a name. Reps deprioritize records they cannot act on, and the CRM logs that as a conversion failure.
- A denominator full of junk. Bot form fills, competitor research, duplicate submissions from the same person across three campaigns, and internal test records. Every one of them makes your rate look worse than reality while burning rep hours.

How do you calculate it without fooling yourself?#
Most CRM dashboards compute conversion rate as a snapshot: leads created this month divided by opportunities created this month. That is wrong whenever your sales cycle is longer than your reporting period, which is essentially always in B2B.
Use cohort math instead. Take every lead created in a fixed window — say, January — and follow that same set forward. If 1,000 January leads produced 340 MQLs, 71 SQLs, and 14 closed-won deals by September, your January cohort converted at 34%, 20.9% (of MQLs), and 1.4% end-to-end. That number will keep climbing as slow deals land, which is why you report cohorts with an explicit maturity note: "January cohort, measured at day 240."
Three hygiene rules that change the number more than any campaign:
- Deduplicate before you divide. One human filling three forms is one lead. Run a dedupe pass on email and normalized company domain before any rate is calculated.
- Exclude non-prospects from the denominator. Students, job seekers, competitors, existing customers, and obvious bot fills. Tag them, do not delete them, and report both the raw and the qualified rate.
- Verify the email before it counts. A record with an undeliverable address cannot convert. Running new inbound through an email verifier at capture time both protects your sender reputation and stops phantom leads from inflating your denominator.
Do this once and you will typically find your "real" inbound lead conversion rate is 20-40% higher than the number on the dashboard. That is not cheating. That is removing records that were never capable of converting.
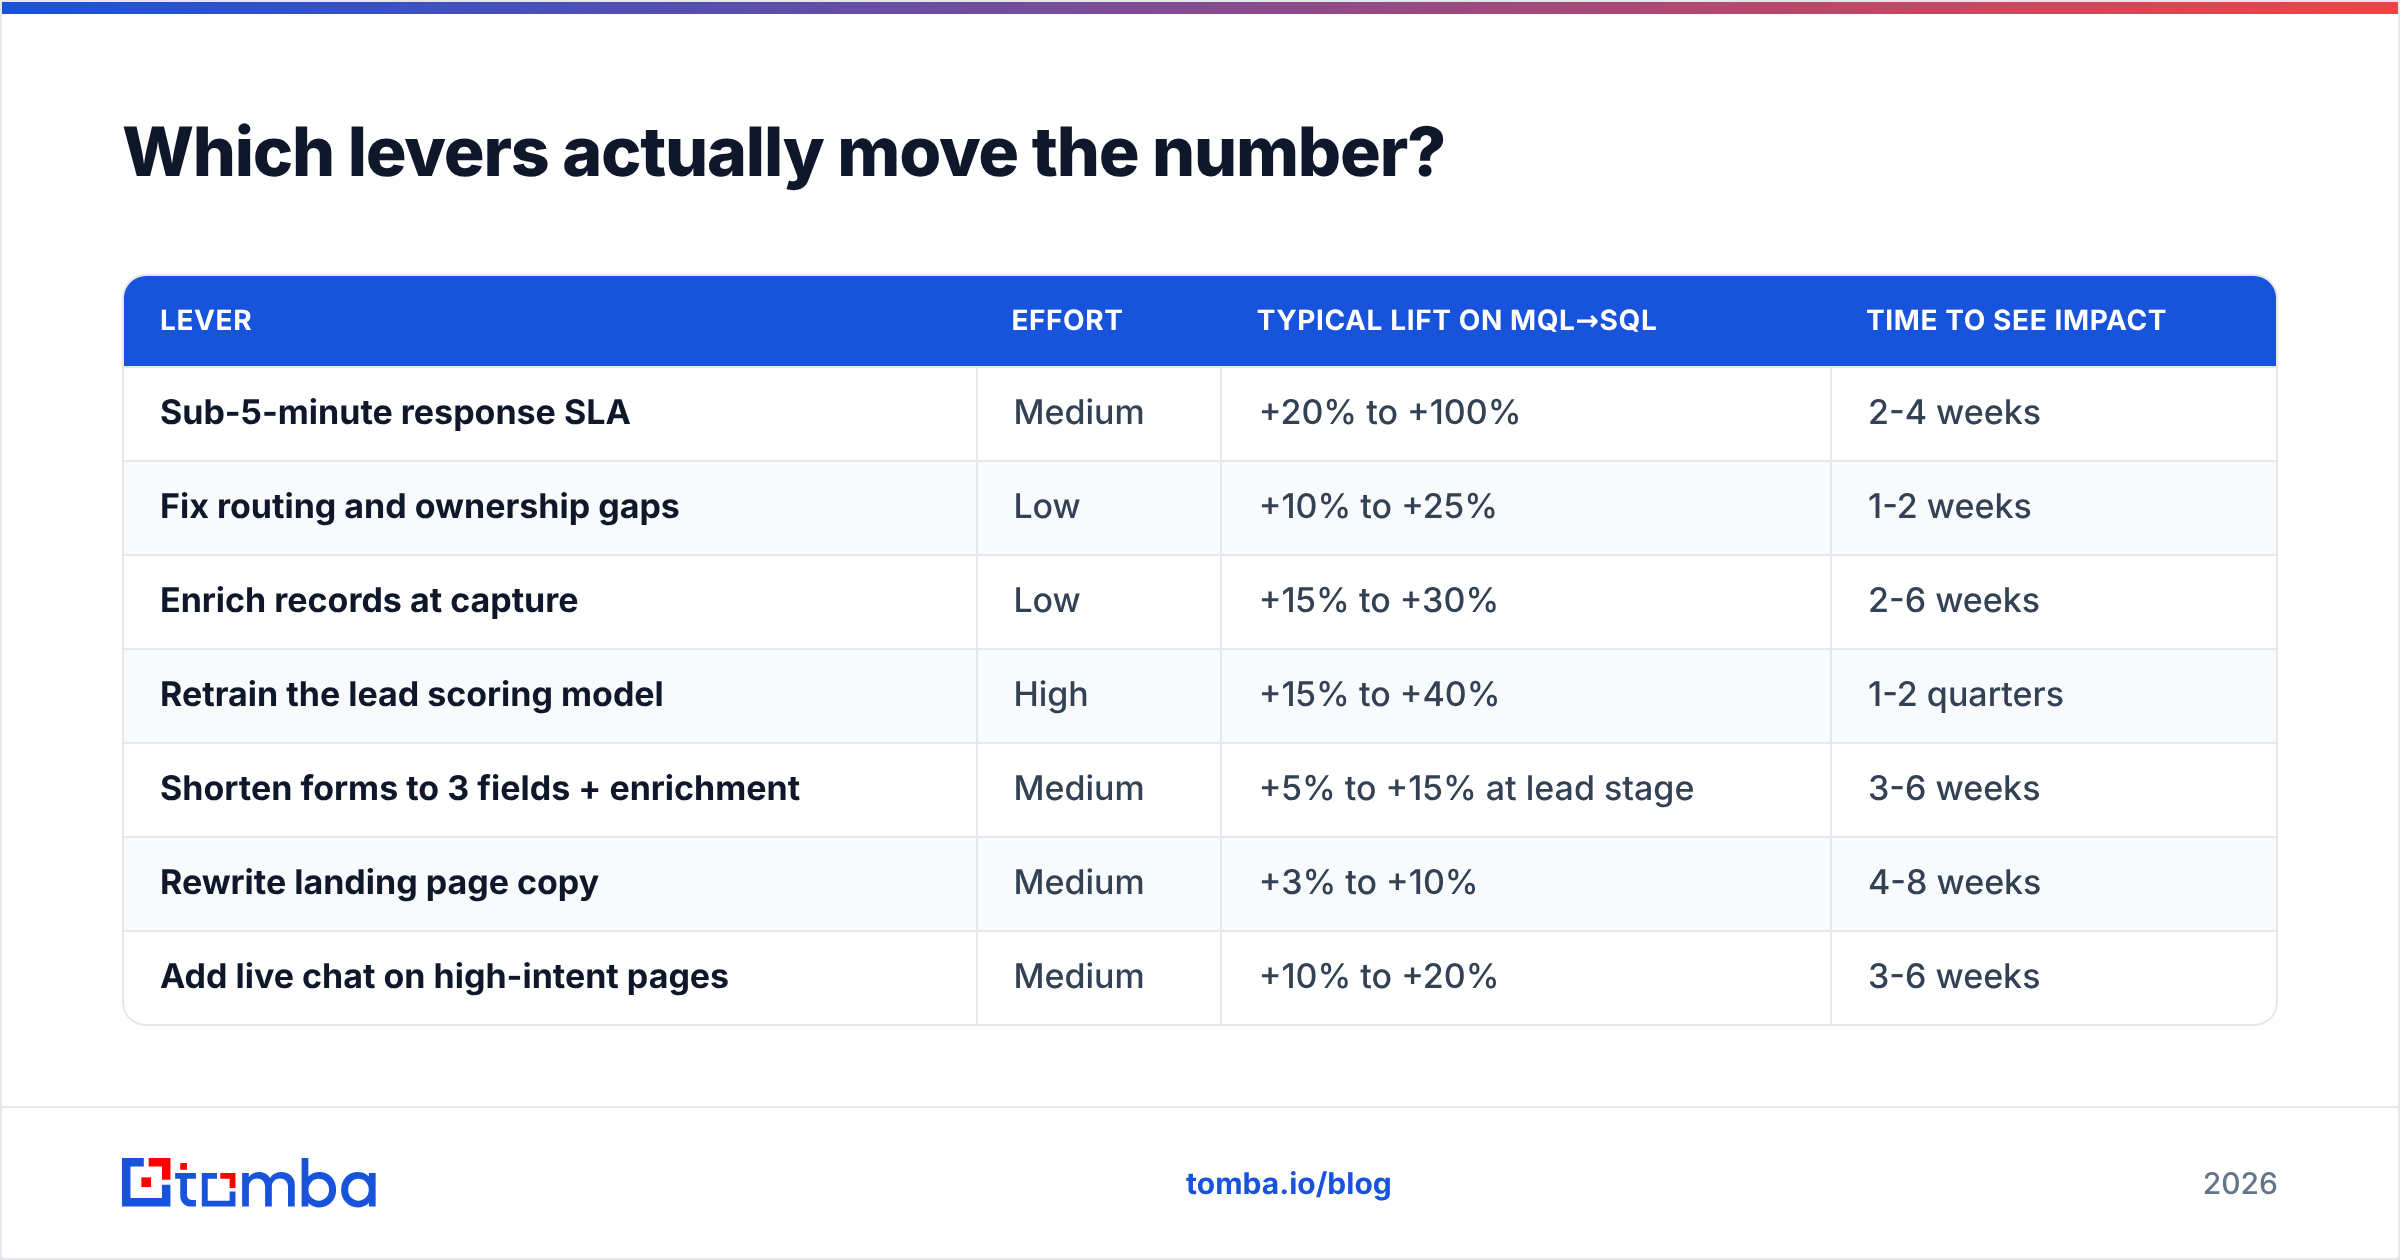
Which levers actually move the number?#
| Lever | Effort | Typical lift on MQL→SQL | Time to see impact |
|---|---|---|---|
| Sub-5-minute response SLA | Medium | +20% to +100% | 2-4 weeks |
| Fix routing and ownership gaps | Low | +10% to +25% | 1-2 weeks |
| Enrich records at capture | Low | +15% to +30% | 2-6 weeks |
| Retrain the lead scoring model | High | +15% to +40% | 1-2 quarters |
| Shorten forms to 3 fields + enrichment | Medium | +5% to +15% at lead stage | 3-6 weeks |
| Rewrite landing page copy | Medium | +3% to +10% | 4-8 weeks |
| Add live chat on high-intent pages | Medium | +10% to +20% | 3-6 weeks |
Note the ordering. Copy testing — the thing most teams start with — sits near the bottom. Operational levers are cheaper, faster, and larger. The reason they get skipped is that they are boring and they belong to RevOps rather than to a creative brief.
The short-form play deserves a specific note. Cutting a form from nine fields to three raises submission volume, but only pays off if you can rebuild the missing attributes automatically. That is what contact enrichment is for: capture email and company, append title, seniority, headcount, tech stack, and phone number in the background, then score on the enriched record. You get the volume of a short form and the routing precision of a long one.
Does lead data quality really change the conversion rate?#
Yes, and it shows up in three separate places in the funnel, which is why the impact is usually underestimated.
At the routing stage, missing firmographics force fallback rules. A lead with no company size lands in the generic queue instead of with the enterprise team, gets a templated response, and converts at the generic rate.
At the outreach stage, a rep who has an email, a direct phone number, and a title runs a materially different first touch than a rep with an email alone. Multi-channel first touch on inbound consistently outperforms email-only, and you cannot run it without the phone number.
At the nurture stage, undeliverable addresses damage your sending domain. Once your sender reputation slips, your legitimate nurture stops reaching the inbox and your slow-lane conversions quietly disappear. Nobody attributes that loss to data quality, but that is where it came from.

There is also a volume angle. A meaningful share of your high-intent traffic never fills anything in. Website visitor reveal turns a portion of that anonymous traffic into named companies you can prospect deliberately, which expands the top of the inbound funnel without touching your conversion rate math.
Is inbound conversion better than outbound?#
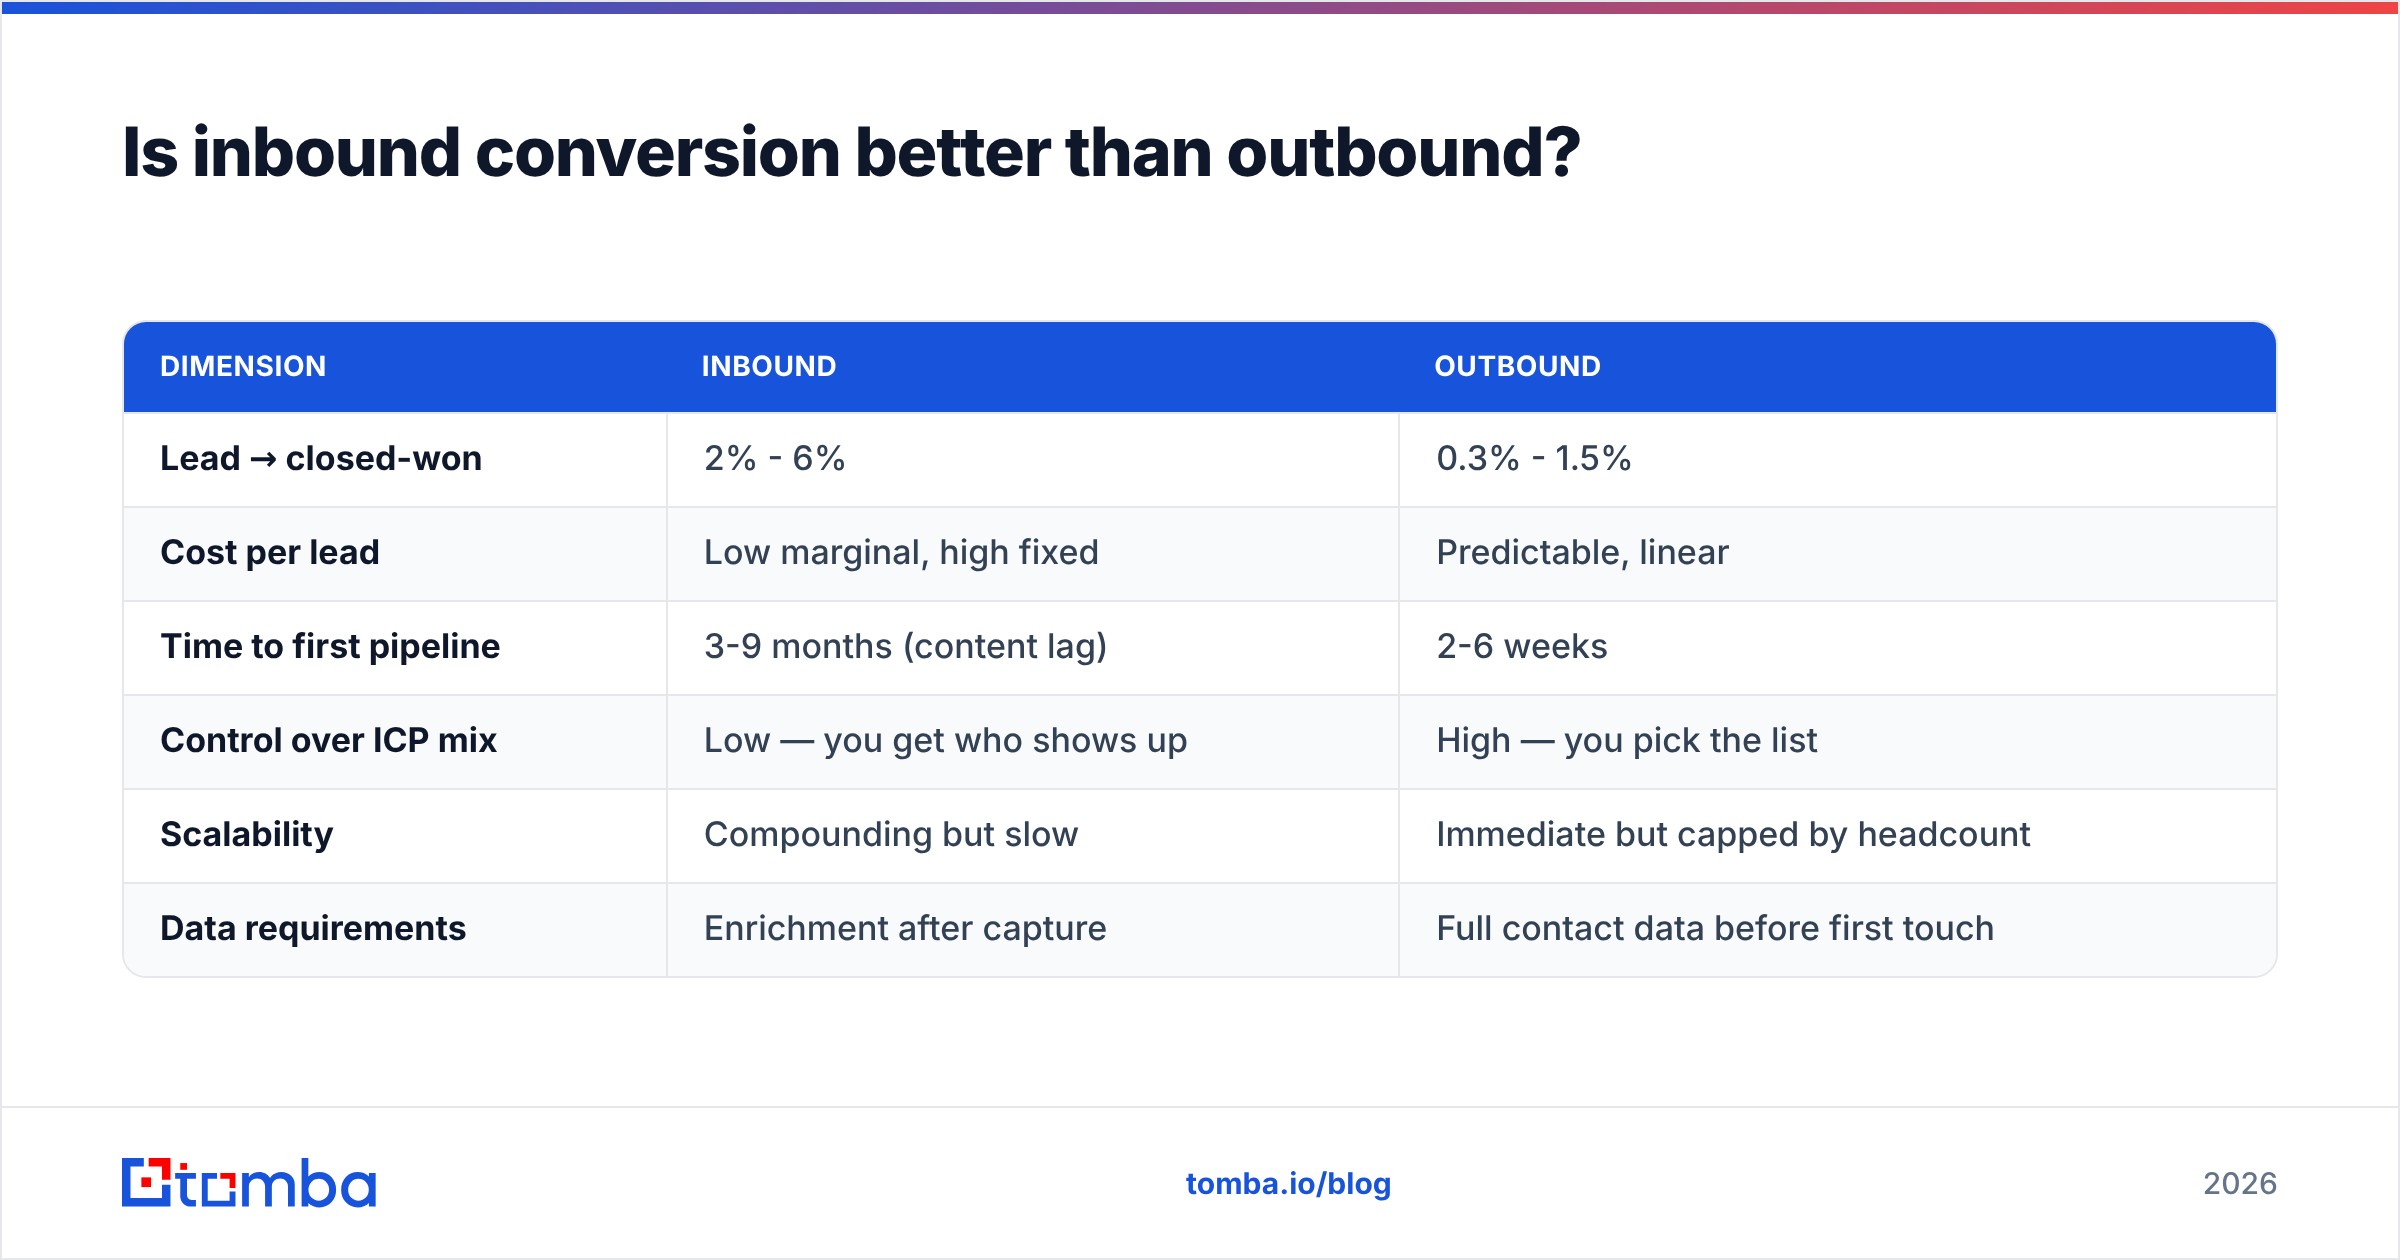
Inbound converts better per lead. Outbound converts better per dollar in some segments. The honest comparison:
| Dimension | Inbound | Outbound |
|---|---|---|
| Lead → closed-won | 2% - 6% | 0.3% - 1.5% |
| Cost per lead | Low marginal, high fixed | Predictable, linear |
| Time to first pipeline | 3-9 months (content lag) | 2-6 weeks |
| Control over ICP mix | Low — you get who shows up | High — you pick the list |
| Scalability | Compounding but slow | Immediate but capped by headcount |
| Data requirements | Enrichment after capture | Full contact data before first touch |
The practical answer for most teams in 2026 is that these are the same motion with different entry points. Your inbound records need the same enrichment your outbound list needs, run through the same verification, scored against the same ICP definition, and routed by the same rules. Teams that maintain two parallel data stacks end up with two different definitions of a qualified lead and an MQL-to-SQL rate that nobody trusts. Comparing tooling options on a neutral source like G2's marketing automation category is a reasonable starting point, but consolidate the data layer before you consolidate the tools.
What should your inbound conversion reporting look like?#
- One cohort report, refreshed weekly. Leads grouped by creation month, with each stage rate shown at fixed maturity intervals (day 30, 90, 180).
- Segmented by channel and by ICP fit, never blended into a single vanity number.
- A response-time distribution, not an average — show p50, p90, and the count of leads over 24 hours.
- A data completeness score per cohort — percentage of records with verified email, title, company size, and phone. Plot it against conversion rate and the correlation will make your case for you.
- A rejected-lead log with reasons, reviewed monthly by marketing and sales together. This is the fastest scoring-model feedback loop that exists.
If you build only one of these, build the first. Cohort reporting alone will change what your team believes about the funnel.
Where to start this week#
Pick the cheapest lever with the fastest feedback: fix the record before it reaches the rep. Verify the email at capture, append the company domain, title, and direct phone, then route on the enriched record instead of the raw form fill. That one change tends to move MQL-to-SQL more in six weeks than a quarter of copy testing.
Tomba Email Finder handles the front half of that job — resolving work email addresses from names and company domains, validating deliverability, and returning the firmographic context your routing rules need. It starts free at 25 searches per month, with paid plans from $49/mo on Starter and $99/mo on Growth; full Tomba pricing is public. Wire it into your form handler, stop scoring incomplete records, and let the conversion rate tell you the truth for once.
Related guides#
// get started
Find, verify and enrich your first contacts today
Start on the free plan with 25 searches a month, then scale when your team is ready.
Free plan · No credit card required · GDPR & CCPA
// about the author