Inbound Lead Scoring: How to Build a Model That Works
Most inbound lead scoring models are point systems built on guesswork. Here is how to separate fit from intent, weight the signals that actually correlate with closed revenue, and stop routing noise to your reps.
TL;DR
- Inbound lead scoring fails most often because teams blend fit and intent into one number. Score them on separate axes, then decide routing from the combination.
- Points assigned by committee opinion are guesses. Derive weights from your own closed-won data, even if the sample is only 80 deals.
- Intent decays. A demo request from 40 days ago is not worth the same as one from this morning — build time decay in from day one.
- Bad contact data quietly breaks scoring: a lead you cannot reach never converts, so the model learns the wrong lesson. Verify and enrich before scoring.
- Rules-based scoring is fine below roughly 500 inbound leads a month. Above that, predictive models start to earn their cost.
What is inbound lead scoring, and why does it break?#
Inbound lead scoring is the process of assigning a numeric value to each inbound contact so sales can work the ones most likely to become revenue first. That is the textbook definition, and it is also where most implementations stop thinking.
Here is the analogy: scoring is a triage desk in an emergency room. The nurse is not diagnosing anyone. She is deciding who sees a doctor in the next five minutes and who waits. If the triage desk gives 30 points for arriving in an ambulance and 30 points for having a headache, you get chaos — someone with a migraine outranks someone with chest pain. That is exactly what happens when a marketing team gives 15 points for a pricing-page view and 15 points for a job title match. The numbers look symmetrical. The outcomes are not.
Three failure patterns cause the majority of broken models:
One score, two questions. "Should we sell to this person?" and "Are they ready to buy right now?" are different questions. Collapsing them into a single 0-100 number means a perfect-fit CFO who downloaded one whitepaper scores the same as a student who read nine blog posts. Reps learn to ignore the score within a quarter.
Weights set by opinion. A team sits in a room and votes that a webinar attendance is worth 10 points. Nobody checks whether webinar attendees close at a higher rate than non-attendees. Frequently they close worse — webinars attract researchers and competitors.
No negative scoring. Free-mail domains, competitor domains, job applicants, students, and unsubscribes all need to subtract. Models that only add points inflate over time until everyone is an MQL and the threshold becomes meaningless.
Actually, let that image stand for the progression most teams walk: gut feel, then form-fill counting, then a proper fit-plus-intent matrix, then a matrix fed by enriched, verified data. Each step is a real jump in precision.

What signals actually predict pipeline?#
Pull your last 200 closed-won and 200 closed-lost inbound deals and compute conversion rate by signal. You will typically find these five categories carry the weight:
- Firmographic fit — employee count, industry, revenue band, region, and tech stack. This is the most stable predictor and the least likely to change week to week. If your best customers are 200-2,000 employee B2B SaaS companies in North America, a 30-person agency in a different vertical should be scored down regardless of how many pages they read.
- Persona fit — seniority and function. Not job title strings. "VP of Revenue Operations" and "Head of RevOps" are the same buyer; a title-string match will catch one and miss the other. Normalize to seniority tier plus department.
- High-intent behavior — pricing page views, demo requests, free-trial signups, security/compliance page views, and integration documentation views. These convert several times better than top-of-funnel content consumption in almost every dataset we have seen published.
- Buying-committee density — two or more contacts from the same domain active within 30 days. This is the single most underused signal in inbound scoring, and it is easy to compute if your CRM resolves contacts to accounts properly.
- Recency and frequency — three visits this week beats twelve visits last quarter. Time-weight every behavioral signal.
Note what is not on the list: email opens. Since Apple Mail Privacy Protection began pre-fetching images, open data has been noisy enough that scoring on it is closer to a coin flip than a signal. Clicks still carry information. Opens largely do not.
How do fit and intent scores differ?#
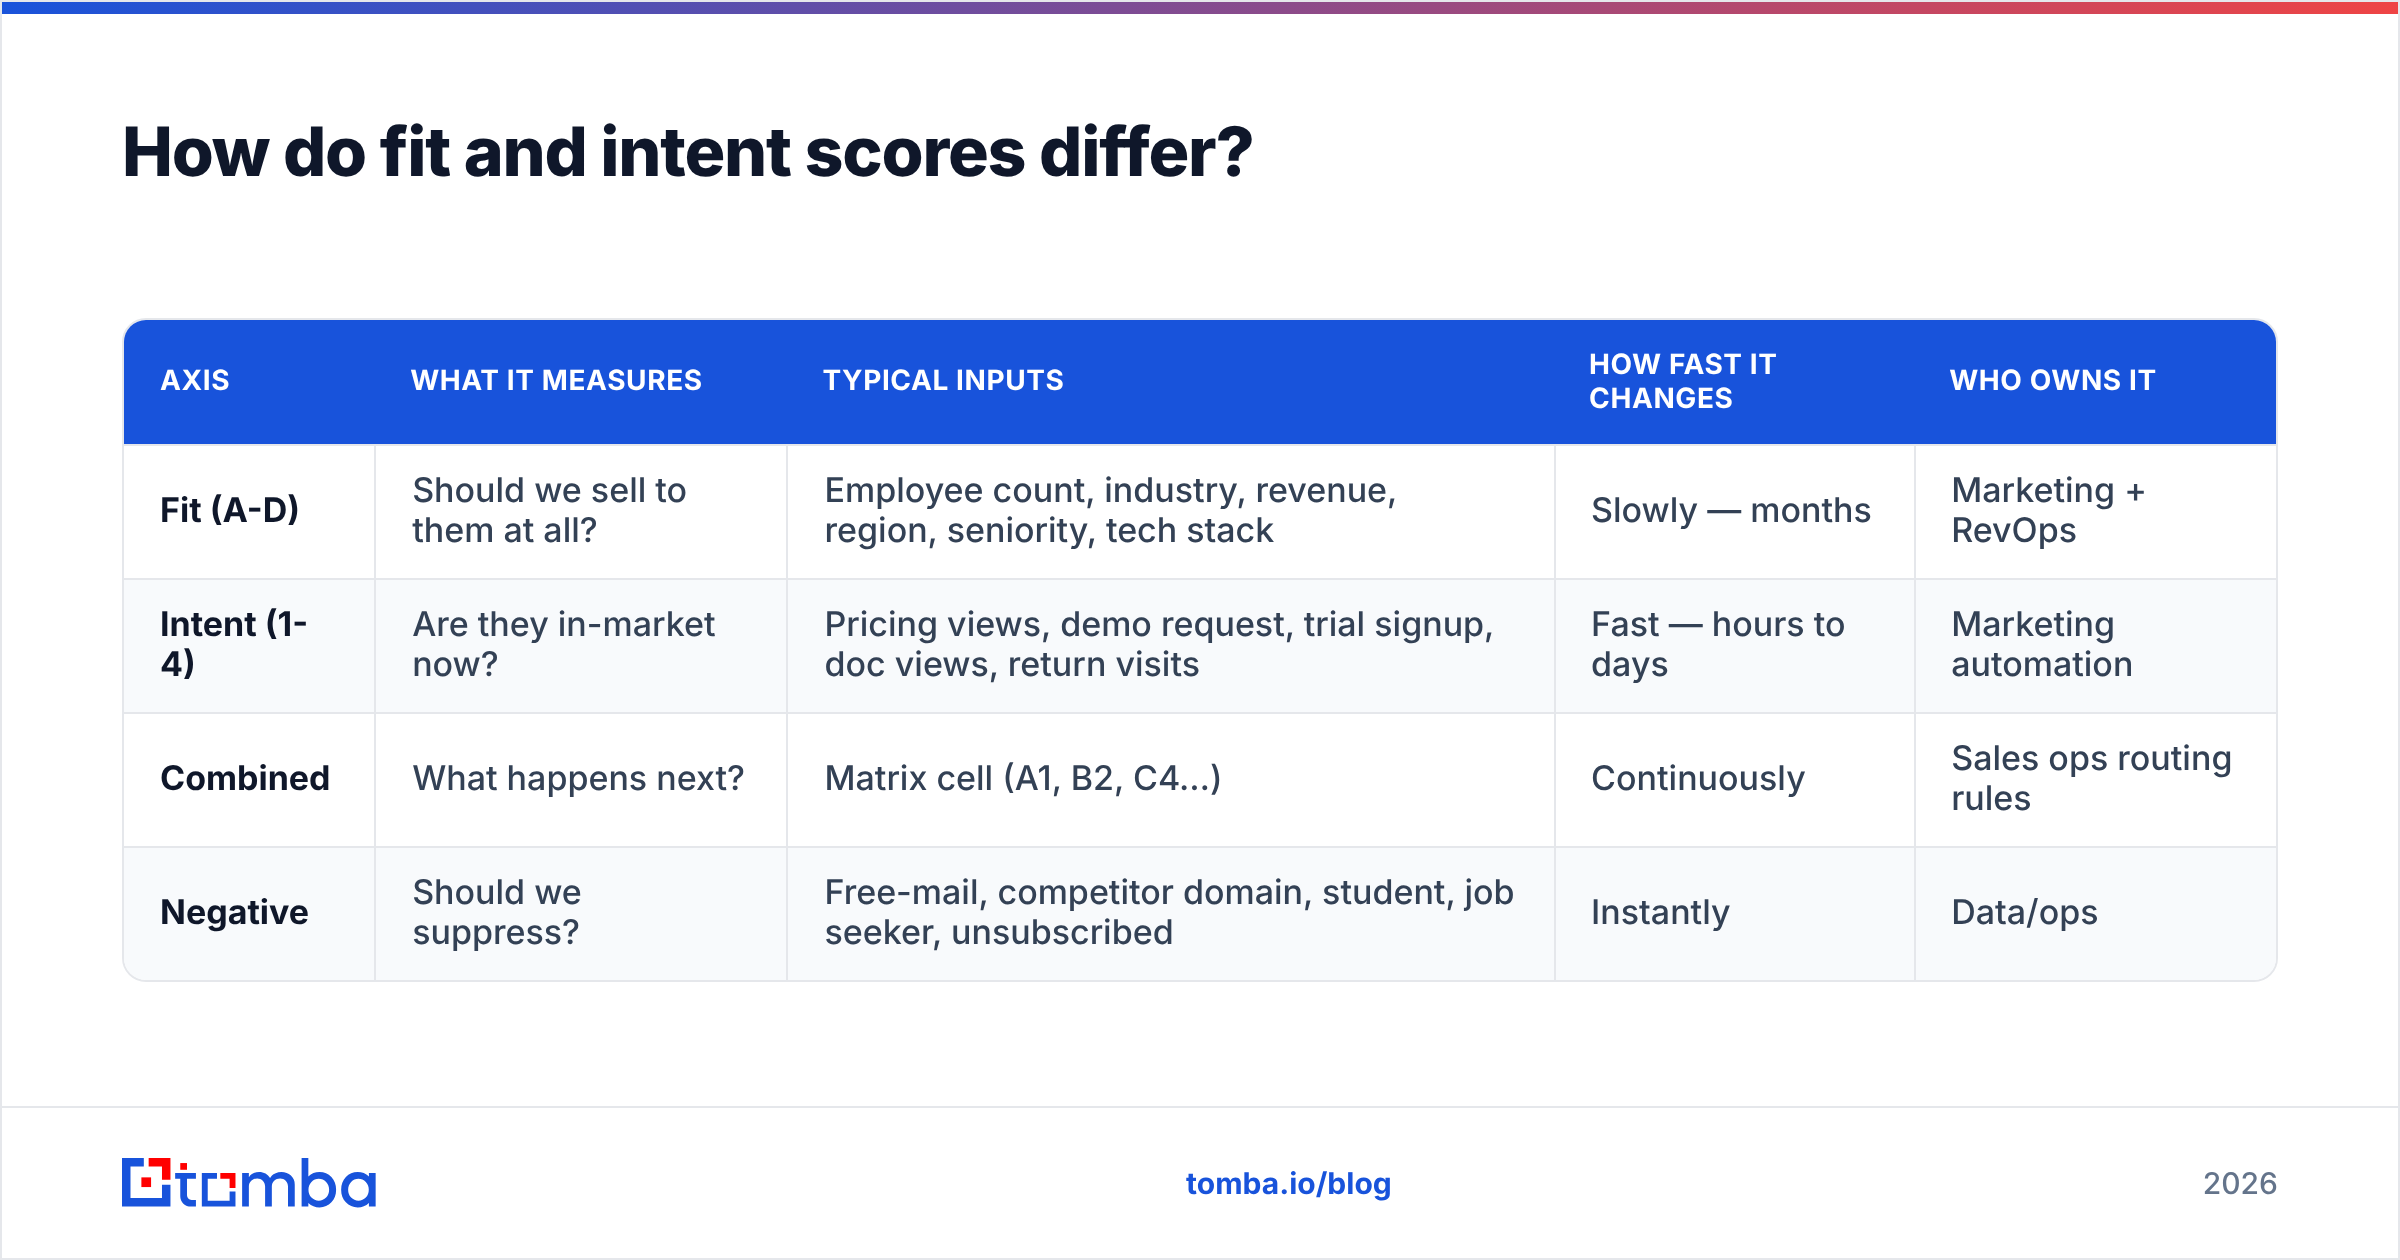
Score them separately, then combine into a routing decision. A two-axis matrix gives sales something they can actually act on.
| Axis | What it measures | Typical inputs | How fast it changes | Who owns it |
|---|---|---|---|---|
| Fit (A-D) | Should we sell to them at all? | Employee count, industry, revenue, region, seniority, tech stack | Slowly — months | Marketing + RevOps |
| Intent (1-4) | Are they in-market now? | Pricing views, demo request, trial signup, doc views, return visits | Fast — hours to days | Marketing automation |
| Combined | What happens next? | Matrix cell (A1, B2, C4…) | Continuously | Sales ops routing rules |
| Negative | Should we suppress? | Free-mail, competitor domain, student, job seeker, unsubscribed | Instantly | Data/ops |
The routing logic then writes itself. A1 and A2 go to an AE with a same-day SLA. B1 and B2 go to an SDR. C and D with high intent go to self-serve nurture or a product-led onboarding flow — not to a human, no matter how many pages they viewed. A-fit with low intent goes into a marketing nurture track and gets revisited monthly.
This is also how you avoid the classic argument where sales says the leads are bad and marketing says sales did not work them. With a matrix, both teams are looking at the same two-dimensional truth instead of arguing about a single blended number.
What does a working point model look like?#
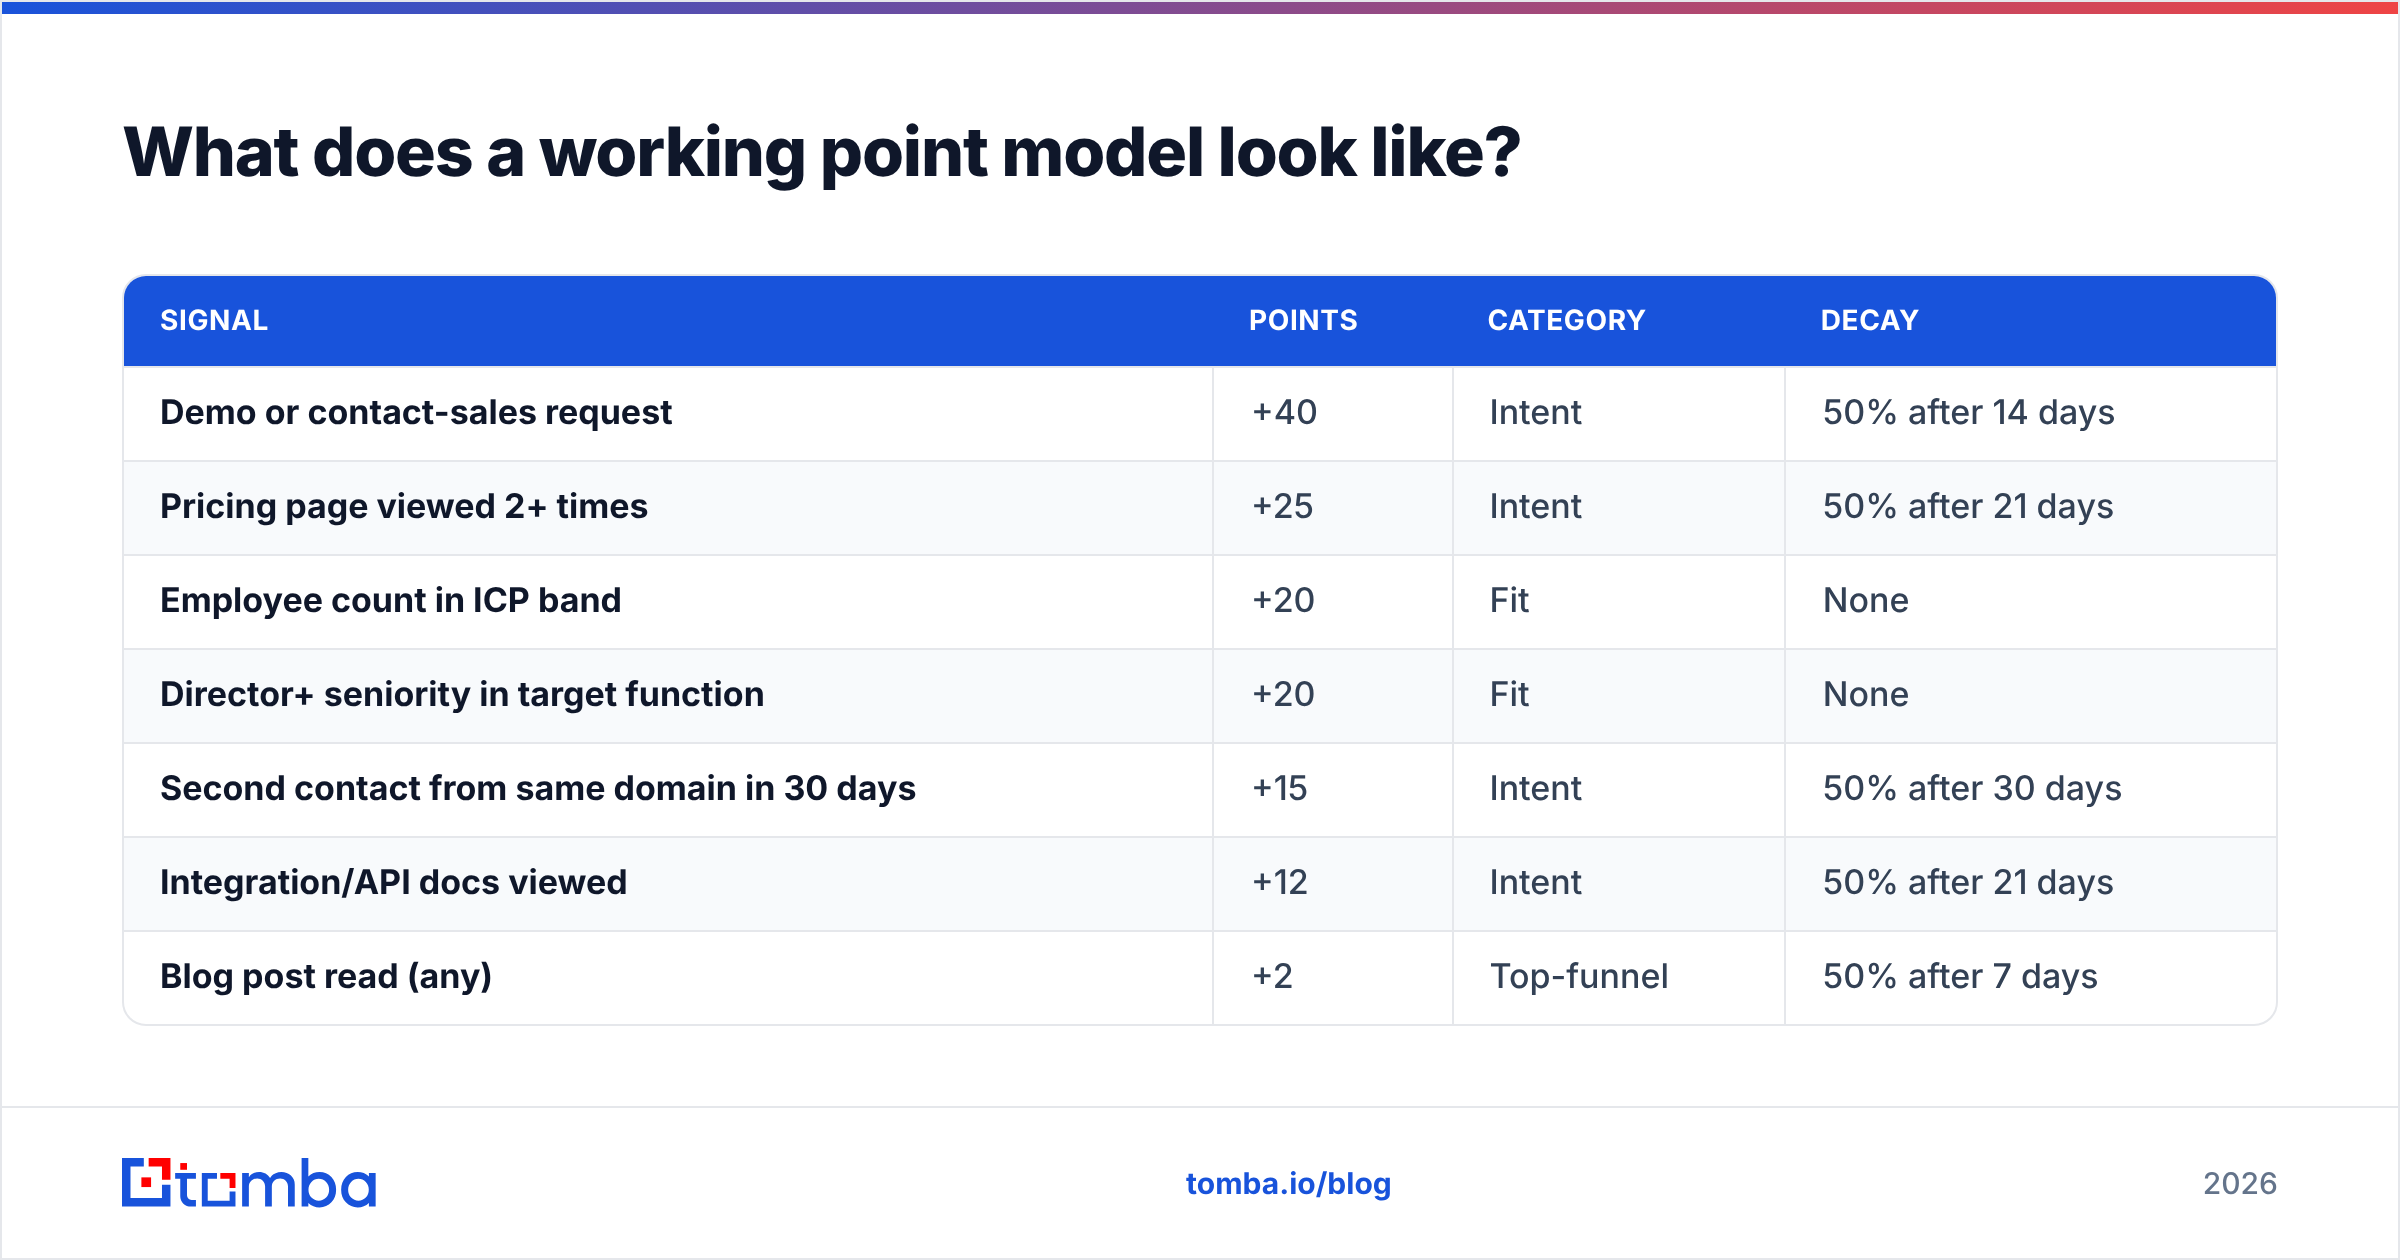
If you are building rules-based scoring, start narrow. Ten to fifteen rules total, not sixty. Here is a starting frame you can calibrate against your own conversion data:
| Signal | Points | Category | Decay |
|---|---|---|---|
| Demo or contact-sales request | +40 | Intent | 50% after 14 days |
| Pricing page viewed 2+ times | +25 | Intent | 50% after 21 days |
| Employee count in ICP band | +20 | Fit | None |
| Director+ seniority in target function | +20 | Fit | None |
| Second contact from same domain in 30 days | +15 | Intent | 50% after 30 days |
| Integration/API docs viewed | +12 | Intent | 50% after 21 days |
| Blog post read (any) | +2 | Top-funnel | 50% after 7 days |
| Free-mail domain (gmail, outlook) | -15 | Negative | None |
| Competitor domain | -100 | Negative | None |
| Role contains "student", "intern", "seeking" | -50 | Negative | None |
Two rules about this table. First, the negative values matter as much as the positives — without them your threshold drifts upward every quarter. Second, decay is not optional. A demo request that sat untouched for six weeks is a different object than a fresh one, and your model should say so.
Then validate: take last quarter's leads, run them through the model retroactively, and check whether the top decile actually closed at a higher rate than the rest. If it did not, your weights are wrong. That backtest takes an afternoon and saves a year of misrouted leads.
Should you use rules-based or predictive scoring?#
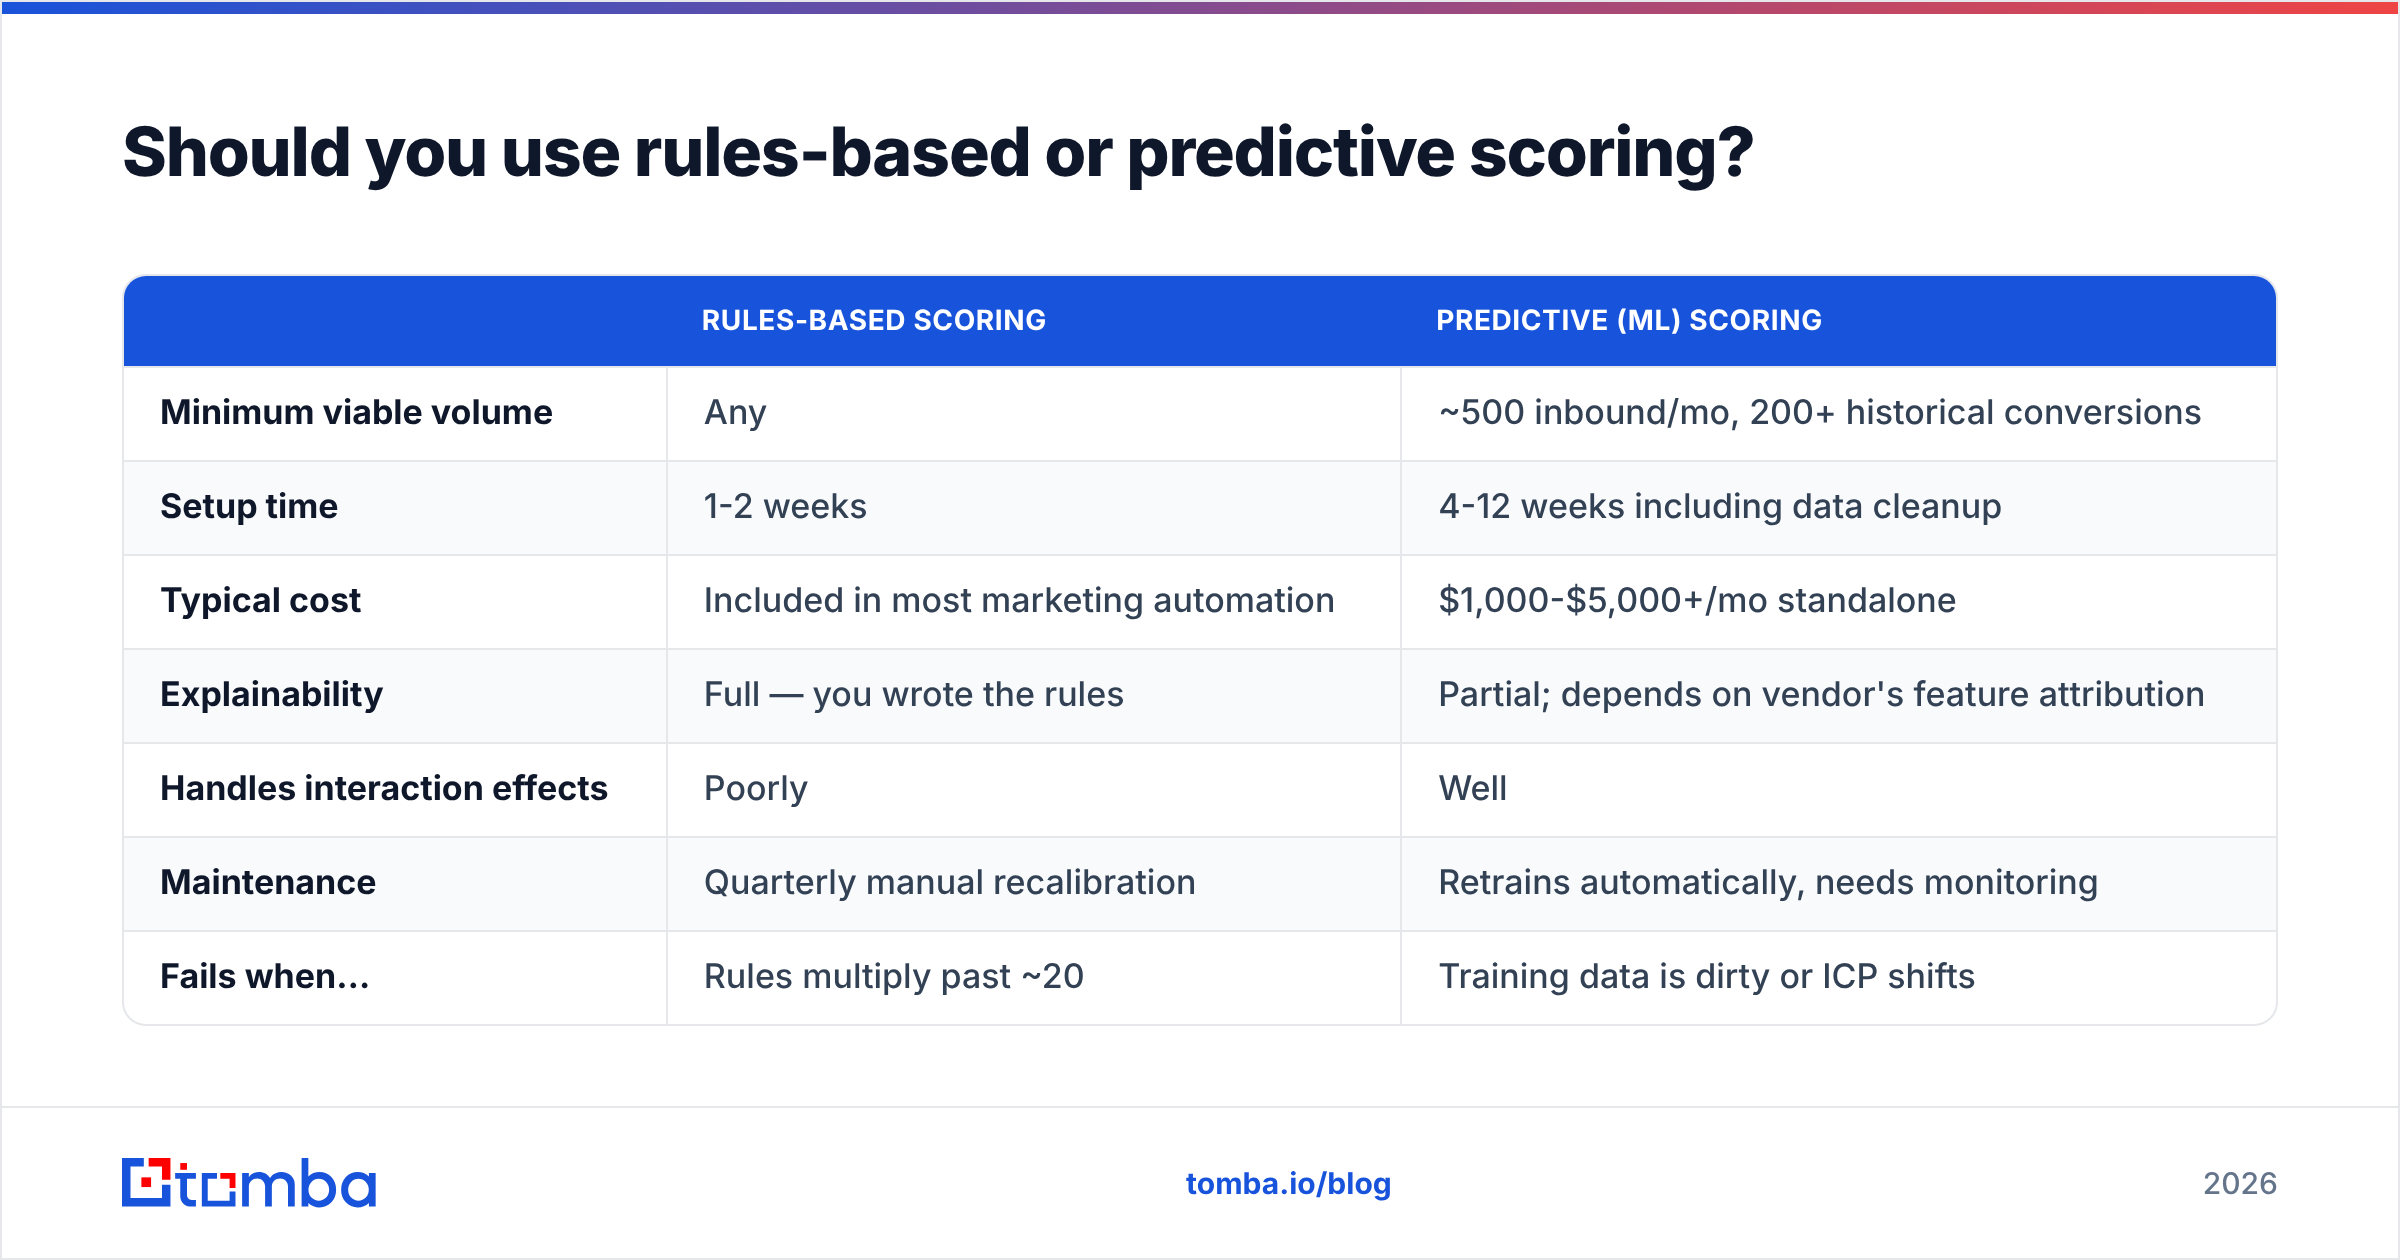
The honest answer depends almost entirely on volume. Predictive models need training data; below a few hundred conversions they overfit and produce confident nonsense.
| Rules-based scoring | Predictive (ML) scoring | |
|---|---|---|
| Minimum viable volume | Any | ~500 inbound/mo, 200+ historical conversions |
| Setup time | 1-2 weeks | 4-12 weeks including data cleanup |
| Typical cost | Included in most marketing automation | $1,000-$5,000+/mo standalone |
| Explainability | Full — you wrote the rules | Partial; depends on vendor's feature attribution |
| Handles interaction effects | Poorly | Well |
| Maintenance | Quarterly manual recalibration | Retrains automatically, needs monitoring |
| Fails when… | Rules multiply past ~20 | Training data is dirty or ICP shifts |
Most teams should run rules-based scoring properly for two to three quarters before considering predictive. The data hygiene work you do to make rules work — normalized industries, resolved accounts, verified contacts — is the same work a predictive model needs anyway. Skipping to machine learning with messy inputs just automates your existing errors faster. Gartner and G2's lead-scoring category both show the same pattern: buyers who adopt predictive scoring without a functioning rules baseline churn off it within a year.

How does data quality quietly break your model?#
This is the part almost every scoring guide skips, and it is where the biggest gains hide.
Your model learns from conversion outcomes. If 30% of your inbound leads have an unreachable or mistyped email address, those leads never convert — not because they were bad-fit, but because nobody ever reached them. The model absorbs that as "this segment does not convert" and starts scoring the segment down. You have now trained your scoring system on a delivery problem.
Three fixes, in order of impact:
Verify at capture. Run an email verification check on the form submission itself, before the record hits your CRM. Typos, role addresses, and spam-trap patterns get flagged immediately rather than polluting six months of training data. This also protects sender reputation on the follow-up sequence.
Enrich before scoring, not after. A form with three fields gives you almost nothing to score on. Run data enrichment against the email domain to append employee count, industry, seniority, and tech stack, then score. If you score first and enrich later, half your leads get routed on incomplete fit data and the routing decision is already made by the time the good data arrives.
Resolve anonymous and partial records. Free-mail signups from real buyers are common in product-led motions. A reverse email lookup can attach a person and a company to an address that carries no domain signal, converting a "-15 free-mail" penalty into a proper fit score. Similarly, when a lead gives a company name but no work email, a domain search resolves the account so buying-committee density can be computed.
Providers differ in what they cover well. For self-serve enrichment and email discovery at low per-record cost, Tomba's API works directly inside a form handler or a CRM workflow, with a free tier of 25 searches a month and paid plans starting at $49/mo (see Tomba pricing for the Growth and Pro tiers). For teams that would rather buy a pre-built, filtered list to complement inbound — a common play for account-based programs — a curated database vendor like BookYourData is a reasonable and well-regarded option. The two solve different problems: one enriches records you already have, the other supplies records you do not.
How do you know the model is actually working?#
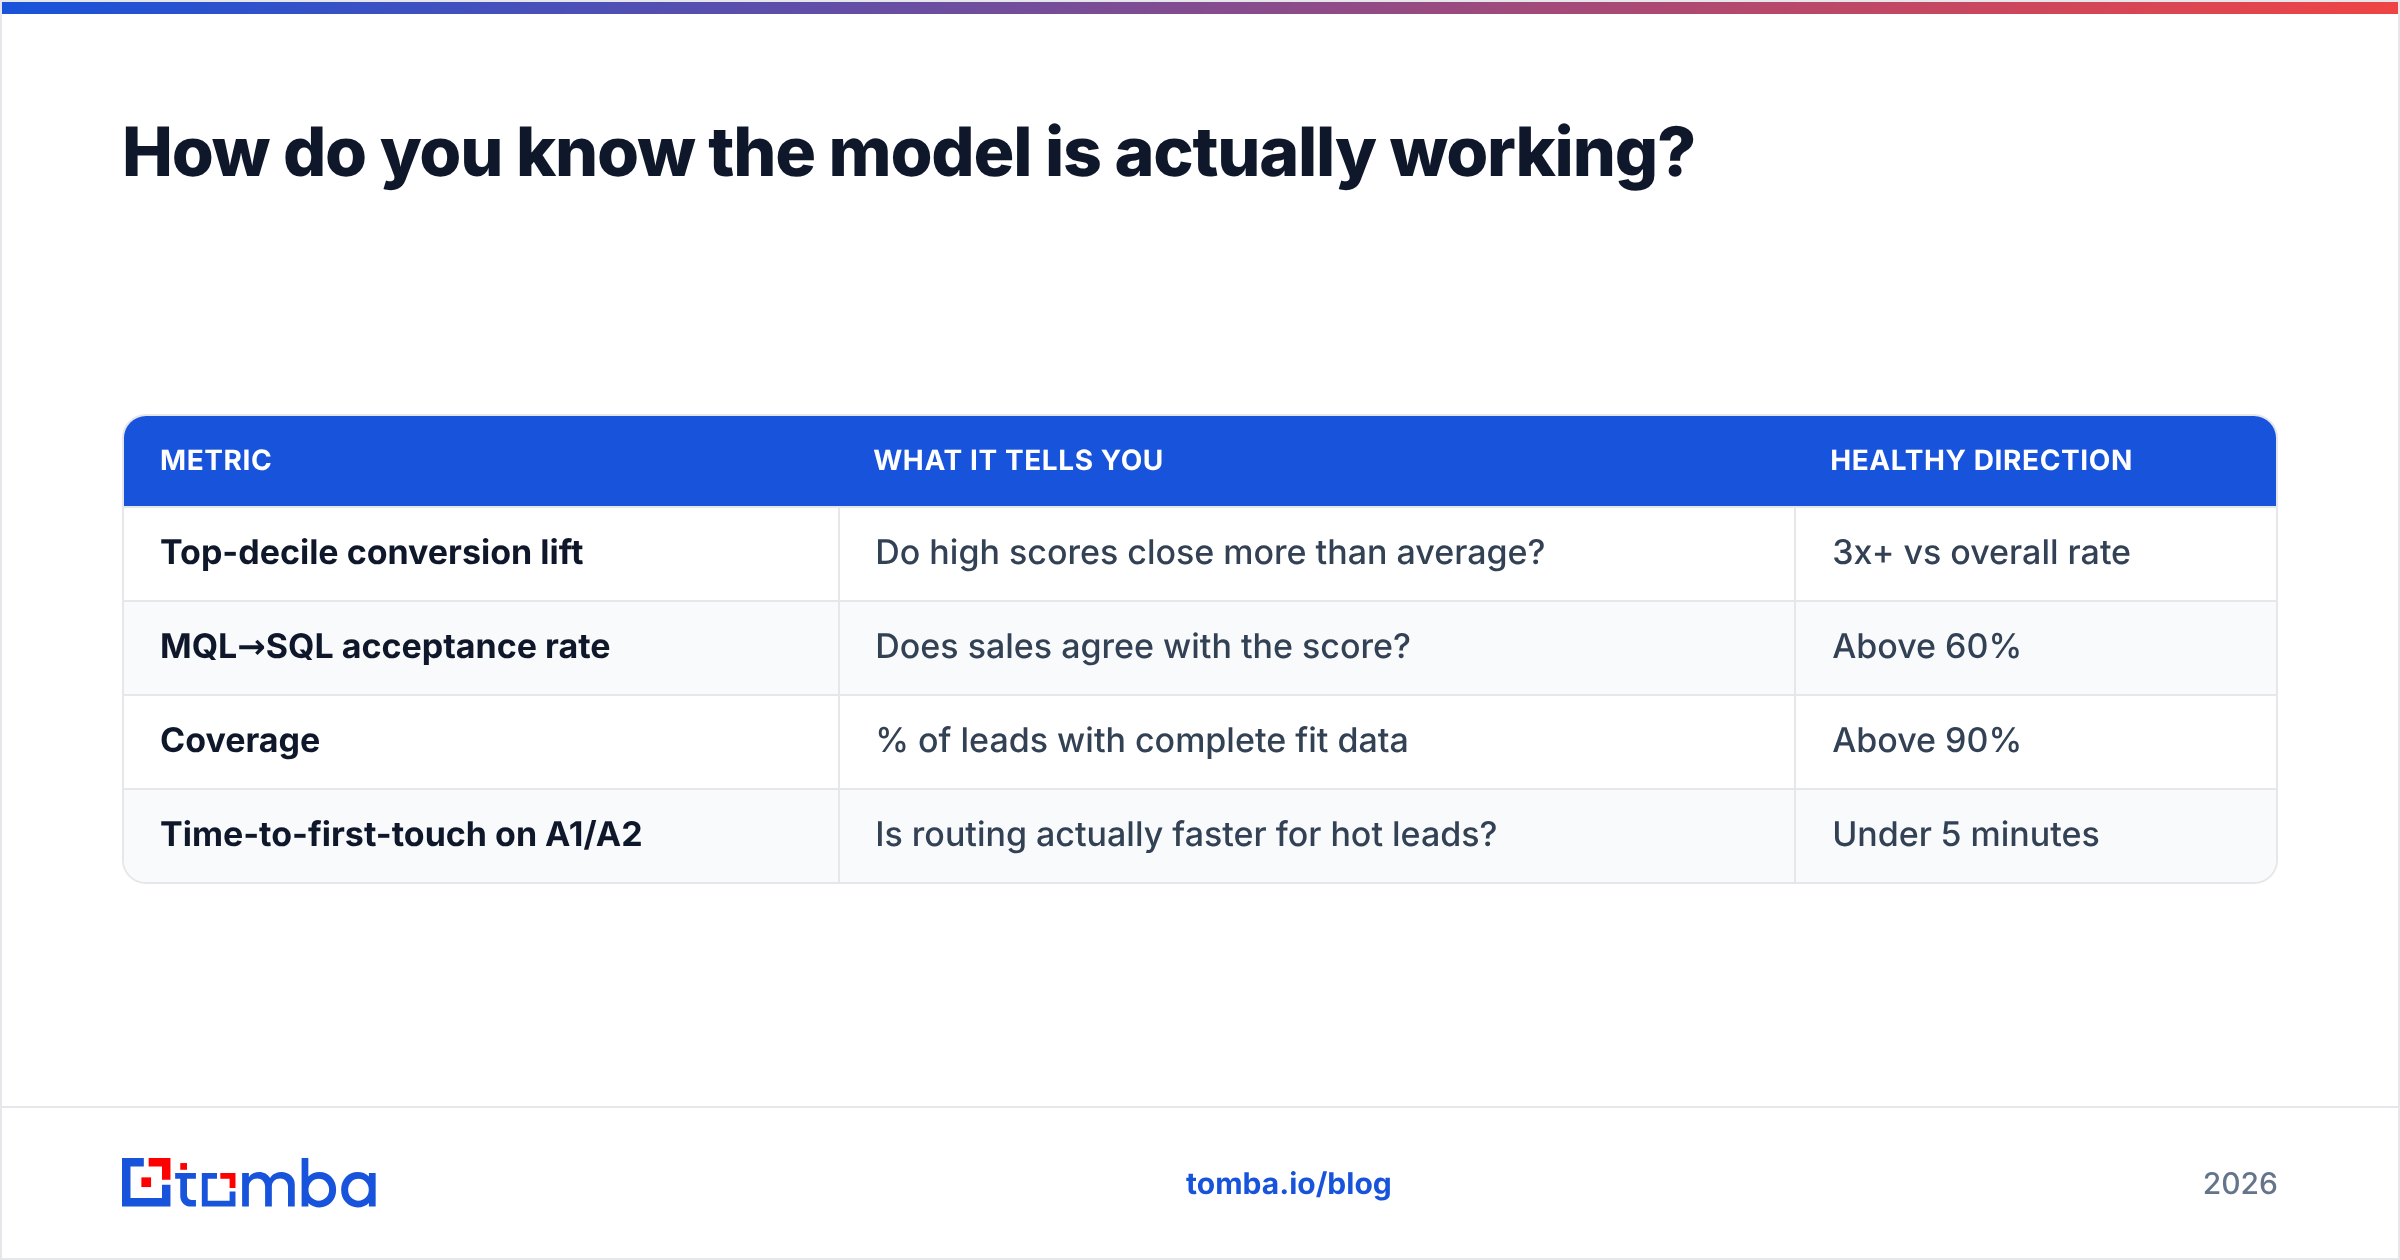
Track four numbers monthly. If you cannot produce them, you do not have a scoring model — you have a point system.
| Metric | What it tells you | Healthy direction |
|---|---|---|
| Top-decile conversion lift | Do high scores close more than average? | 3x+ vs overall rate |
| MQL→SQL acceptance rate | Does sales agree with the score? | Above 60% |
| Coverage | % of leads with complete fit data | Above 90% |
| Time-to-first-touch on A1/A2 | Is routing actually faster for hot leads? | Under 5 minutes |
The top-decile lift is the one that matters most. If your highest-scoring leads convert at roughly the same rate as everyone else, the model has zero information content and you should rebuild the weights from conversion data rather than tweaking them. HubSpot's lead scoring documentation and Salesforce's guidance both recommend the same quarterly recalibration cadence, and quarterly is about right — faster and you chase noise, slower and ICP drift catches you.
One more discipline: keep a "score reason" field on every record showing the top three contributing signals. Reps trust a score of 84 far more when the record also says "demo request, 500-employee SaaS, VP Marketing." Opaque numbers get ignored; explained numbers get worked.
Where should you start this week?#
Pick the smallest useful version. Build a four-cell fit matrix (A/B/C/D), define three intent tiers, add five negative rules, backtest against last quarter, and route on the matrix rather than a single threshold. That is a week of work and it will outperform a sixty-rule model built on opinion.
Then fix the input layer, because scoring accuracy is capped by data accuracy. If you want fit attributes appended to every inbound form fill — company size, industry, seniority, verified work email — start with the Tomba Email Finder and its enrichment endpoints. Free tier covers 25 searches a month so you can test the lift on a sample before committing, and the API drops into an existing form handler in an afternoon. Score better data, and the model finally starts predicting revenue instead of activity.
Related guides#
// get started
Find, verify and enrich your first contacts today
Start on the free plan with 25 searches a month, then scale when your team is ready.
Free plan · No credit card required · GDPR & CCPA
// about the author