Influenced Pipeline: How to Measure It Without Fooling Yourself
Influenced pipeline is the most quoted and least trusted number in B2B reporting. Here is how to define it, model it, audit it, and present a version your CFO will actually sign off on.
TL;DR
- Influenced pipeline is the total value of open opportunities that touched at least one of your marketing or GTM programs before or during the sales cycle. It is a coverage metric, not a credit metric.
- It gets abused because it double-counts by design: one deal can be "influenced" by six programs, so the sum of influenced pipeline across teams can exceed total pipeline by 3-5x.
- The fix is not to kill the metric. It is to publish influenced pipeline next to sourced pipeline, define the touch window in writing, and report a weighted version alongside the raw one.
- Bad contact data breaks influence tracking before any model does. If 30% of your contacts have stale or wrong emails, a third of your touchpoints never attach to the right account record.
- Practical target: report sourced pipeline as the accountability number, influenced pipeline as the diagnostic number, and never let a single slide show only the second one.
What is influenced pipeline?#
Influenced pipeline is the combined dollar value of open opportunities where at least one contact on the account engaged with a tracked program before the opportunity closed. Webinar attendance, a nurture email click, a paid ad form fill, a conference badge scan, a content syndication download — any of these can mark an opportunity as "influenced."
The everyday analogy: sourced pipeline is who walked the customer through the front door. Influenced pipeline is everyone who talked to the customer anywhere in the building. Both are real. Only one of them can claim the introduction.
Technically, influence is a many-to-many join. One opportunity links to many contacts, each contact links to many campaign engagements, and the opportunity is flagged influenced if any of those engagements falls inside the attribution window. That join is the whole reason the number inflates. Sourced pipeline is a one-to-one assignment — one opportunity, one origin. Influenced pipeline has no such constraint unless you impose one.
This distinction matters more in 2026 than it did five years ago because buying committees got bigger. Gartner's long-running research on B2B buying groups puts the typical enterprise committee somewhere between six and ten people. When ten humans each touch three programs, you have thirty influence events on one deal. Every one of them is technically true. None of them individually explains why the deal exists.
How is influenced pipeline different from sourced pipeline?#
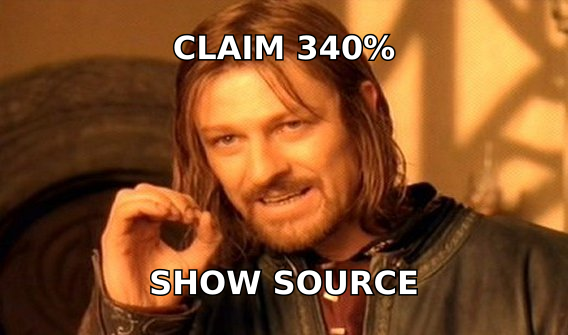
Sourced, influenced, and self-sourced pipeline answer three different questions. Confusing them is the most common reporting failure in revenue operations.
| Dimension | Sourced pipeline | Influenced pipeline | Self-sourced (rep) pipeline |
|---|---|---|---|
| Question it answers | Who created this deal? | Who helped this deal along? | Which reps prospect on their own? |
| Credit model | Single-touch, first origin | Multi-touch, any touch | Owner-based |
| Can exceed total pipeline? | No | Yes, often 2-5x | No |
| Typical owner | Demand gen | Full marketing + partner + product | Sales leadership |
| Best used for | Budget allocation, quota-carrying targets | Program diagnostics, content ROI | Coaching, territory design |
| Common failure | Ignores dark social and word of mouth | Double-counts, invites credit fights | Punishes reps in low-inbound territories |
| Board-safe on its own? | Yes | No — needs sourced next to it | Yes |
The practical rule: sourced is the accountability metric, influenced is the diagnostic metric. You set a marketing target on sourced. You use influenced to decide which programs to keep funding. Swap those roles and marketing starts optimizing for touch volume — more emails, more low-quality webinars, more retargeting impressions — because touch volume is what raises the number.
Why does influenced pipeline get abused?#
Because it is the only pipeline metric that can go up without anything real happening.
Add one more nurture email to every account in your database. Influenced pipeline jumps. Broaden the attribution window from 90 days to 365. It jumps again. Count anonymous IP-matched ad impressions as touches. It triples. Nothing about the business changed, but the quarterly deck looks stronger.
Four inflation patterns show up in almost every audit:
- Window creep. The lookback quietly extends from 90 days to 12 months, so a whitepaper download from last spring now "influences" a deal that started from an outbound cold call in Q3.
- Touch inflation. Email opens count as touches. Opens have been unreliable since Apple Mail Privacy Protection started prefetching images, and counting them turns your entire sendable database into influenced accounts.
- Account-level smear. One contact at a 4,000-person enterprise attends a webinar, and the entire $800K opportunity — owned by a different division — is marked influenced.
- Post-hoc touches. Engagement that happened after the opportunity was created gets counted as influence on its creation. Late-stage content is valuable, but it did not source anything.
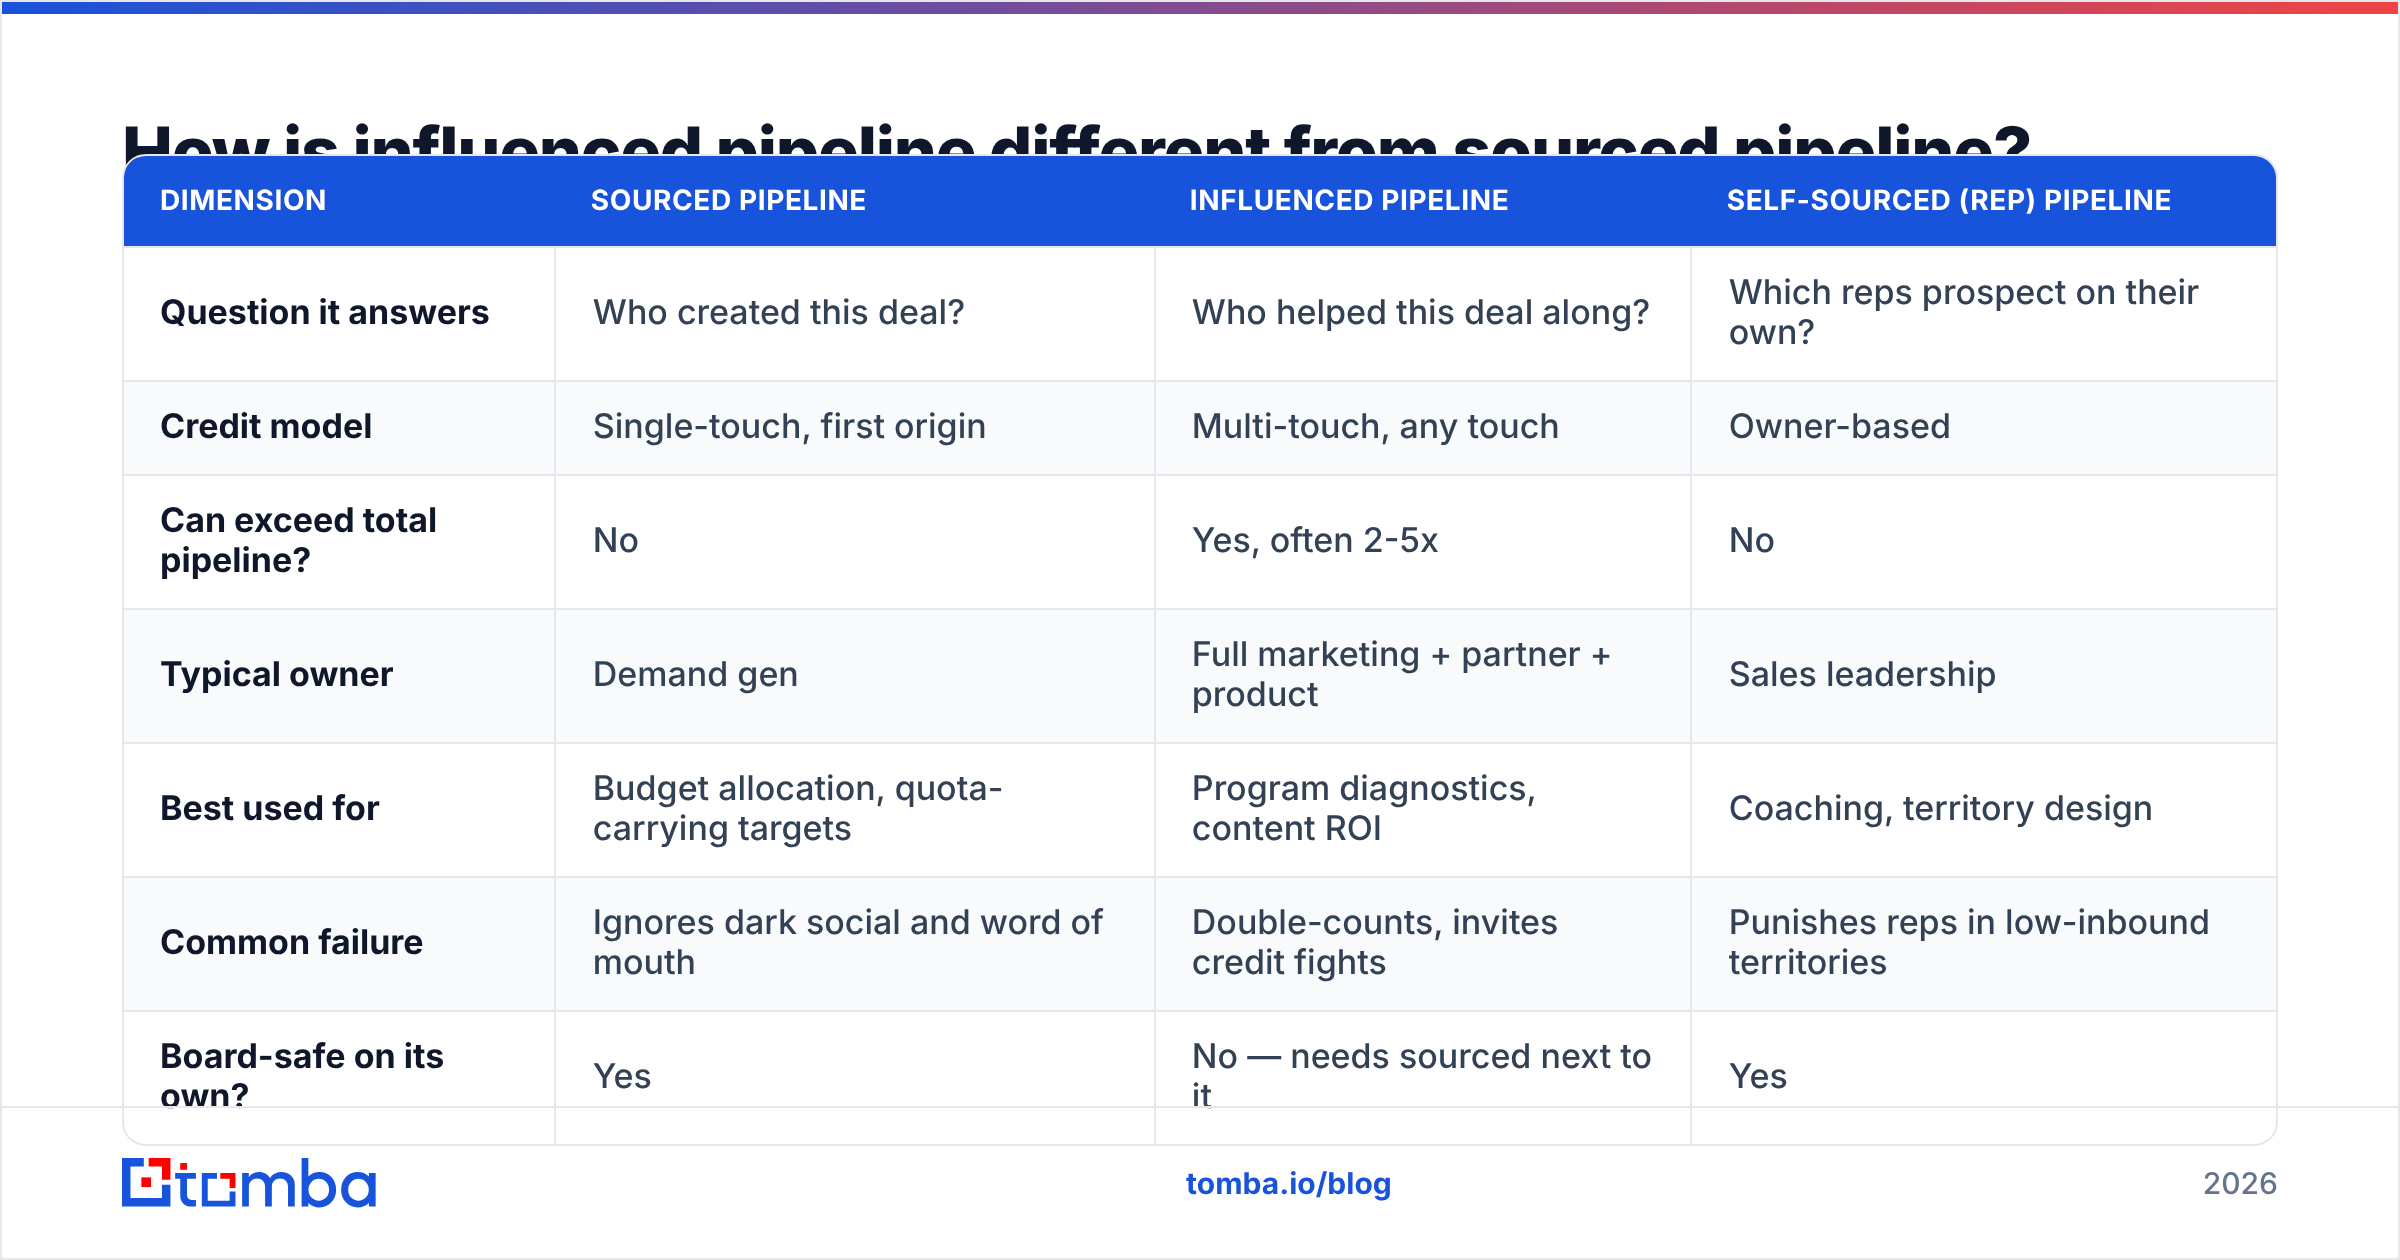
- No de-duplication across teams. Field marketing, demand gen, partner marketing, and product marketing each report their own influenced number. Summed, they claim 340% of the pipeline that exists.
If you only fix one of these, fix the window. A documented, enforced attribution window kills most of the inflation on its own.
Which attribution model should you use for influenced pipeline?#
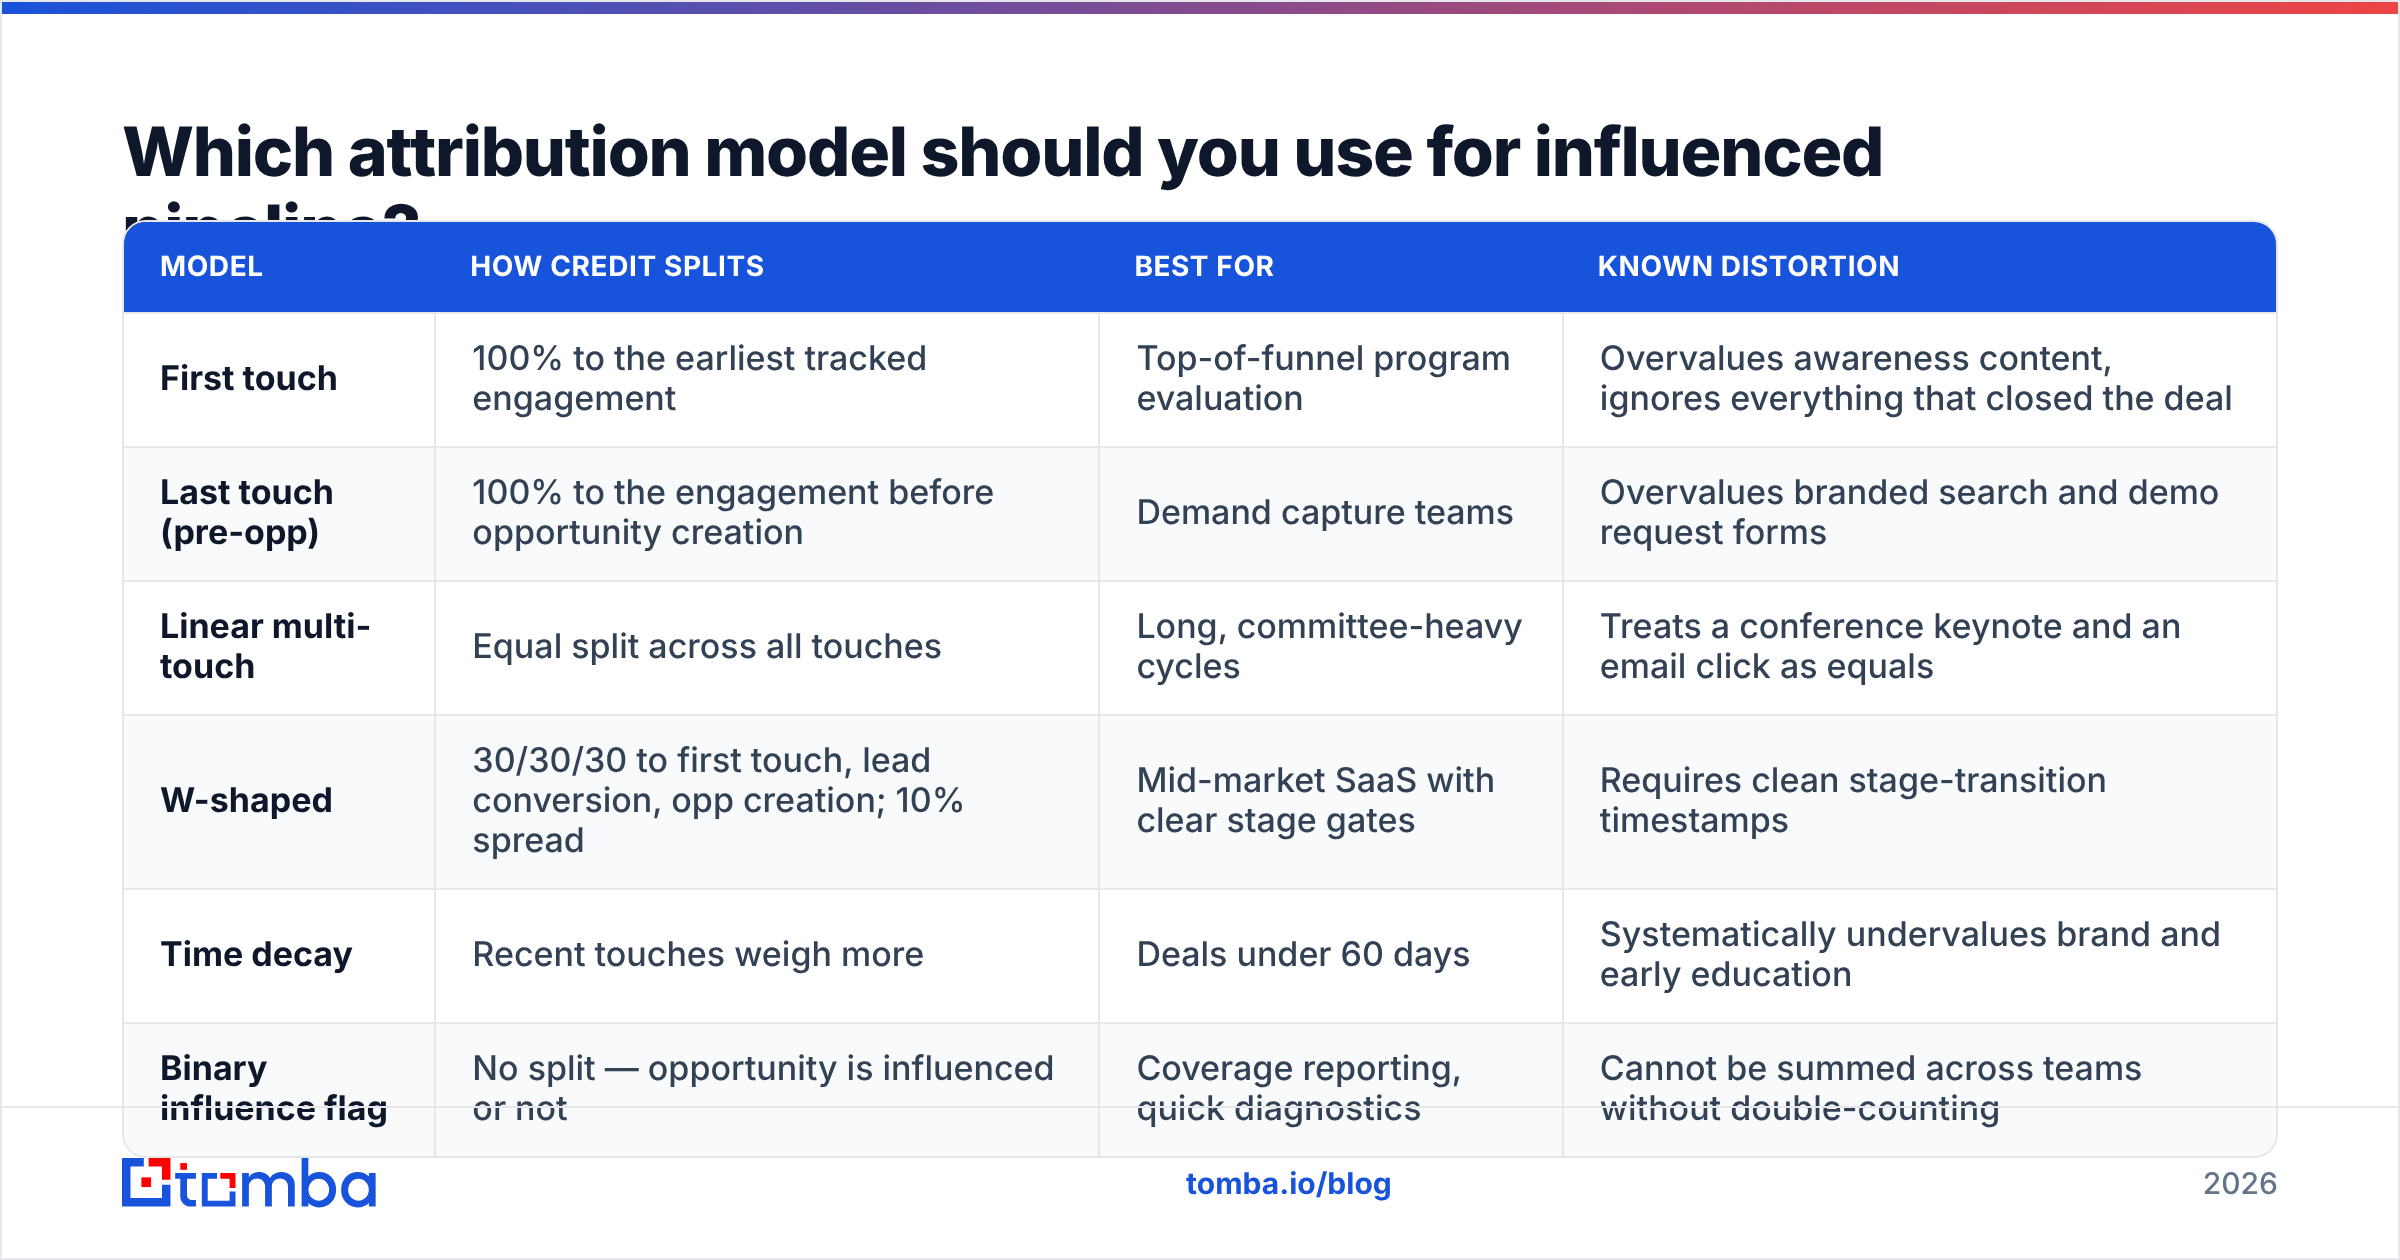
There is no correct model, only models with known distortions. Pick the one whose distortion you can live with, write it down, and stop changing it mid-year.
| Model | How credit splits | Best for | Known distortion |
|---|---|---|---|
| First touch | 100% to the earliest tracked engagement | Top-of-funnel program evaluation | Overvalues awareness content, ignores everything that closed the deal |
| Last touch (pre-opp) | 100% to the engagement before opportunity creation | Demand capture teams | Overvalues branded search and demo request forms |
| Linear multi-touch | Equal split across all touches | Long, committee-heavy cycles | Treats a conference keynote and an email click as equals |
| W-shaped | 30/30/30 to first touch, lead conversion, opp creation; 10% spread | Mid-market SaaS with clear stage gates | Requires clean stage-transition timestamps |
| Time decay | Recent touches weigh more | Deals under 60 days | Systematically undervalues brand and early education |
| Binary influence flag | No split — opportunity is influenced or not | Coverage reporting, quick diagnostics | Cannot be summed across teams without double-counting |
For most B2B teams under $50M ARR, the honest combination is a binary influence flag for coverage plus W-shaped weighting for dollar credit. Coverage tells you what percentage of pipeline your programs touched at all. Weighted credit tells you which programs deserve next quarter's budget. Publishing both prevents the classic argument where two teams claim the same $400K deal.
If you want the conceptual background on how these models evolved, the Wikipedia entry on marketing attribution is a reasonable neutral primer, and Forrester's revenue-process research covers why single-touch models break down on committee purchases.
How do you calculate influenced pipeline step by step?#
Here is the sequence that survives an audit. Each step is a decision you should be able to point to in a document.
- Define the opportunity population. Open opportunities only, created in a fixed date range, above a minimum amount threshold, excluding renewals and intercompany deals. Write the exact filter.
- Define what counts as a touch. Recommended baseline: form fills, webinar attendance (not registration), event badge scans, content downloads, demo requests, and meaningful email clicks. Exclude opens, impressions, and unauthenticated page views.
- Define the attribution window. Ninety days before opportunity creation through opportunity close is a defensible default for mid-market. Enterprise cycles justify 180 days. Anything past 365 days is storytelling.
- Resolve contacts to accounts. Every touch must map to a contact, and every contact must map to the right account. This is where most programs silently break — see the next section.
- Apply the influence flag, then the weighting. Flag first for coverage reporting, then run the weighted model for dollar credit. Store both on the opportunity record so the numbers are reproducible six months later.
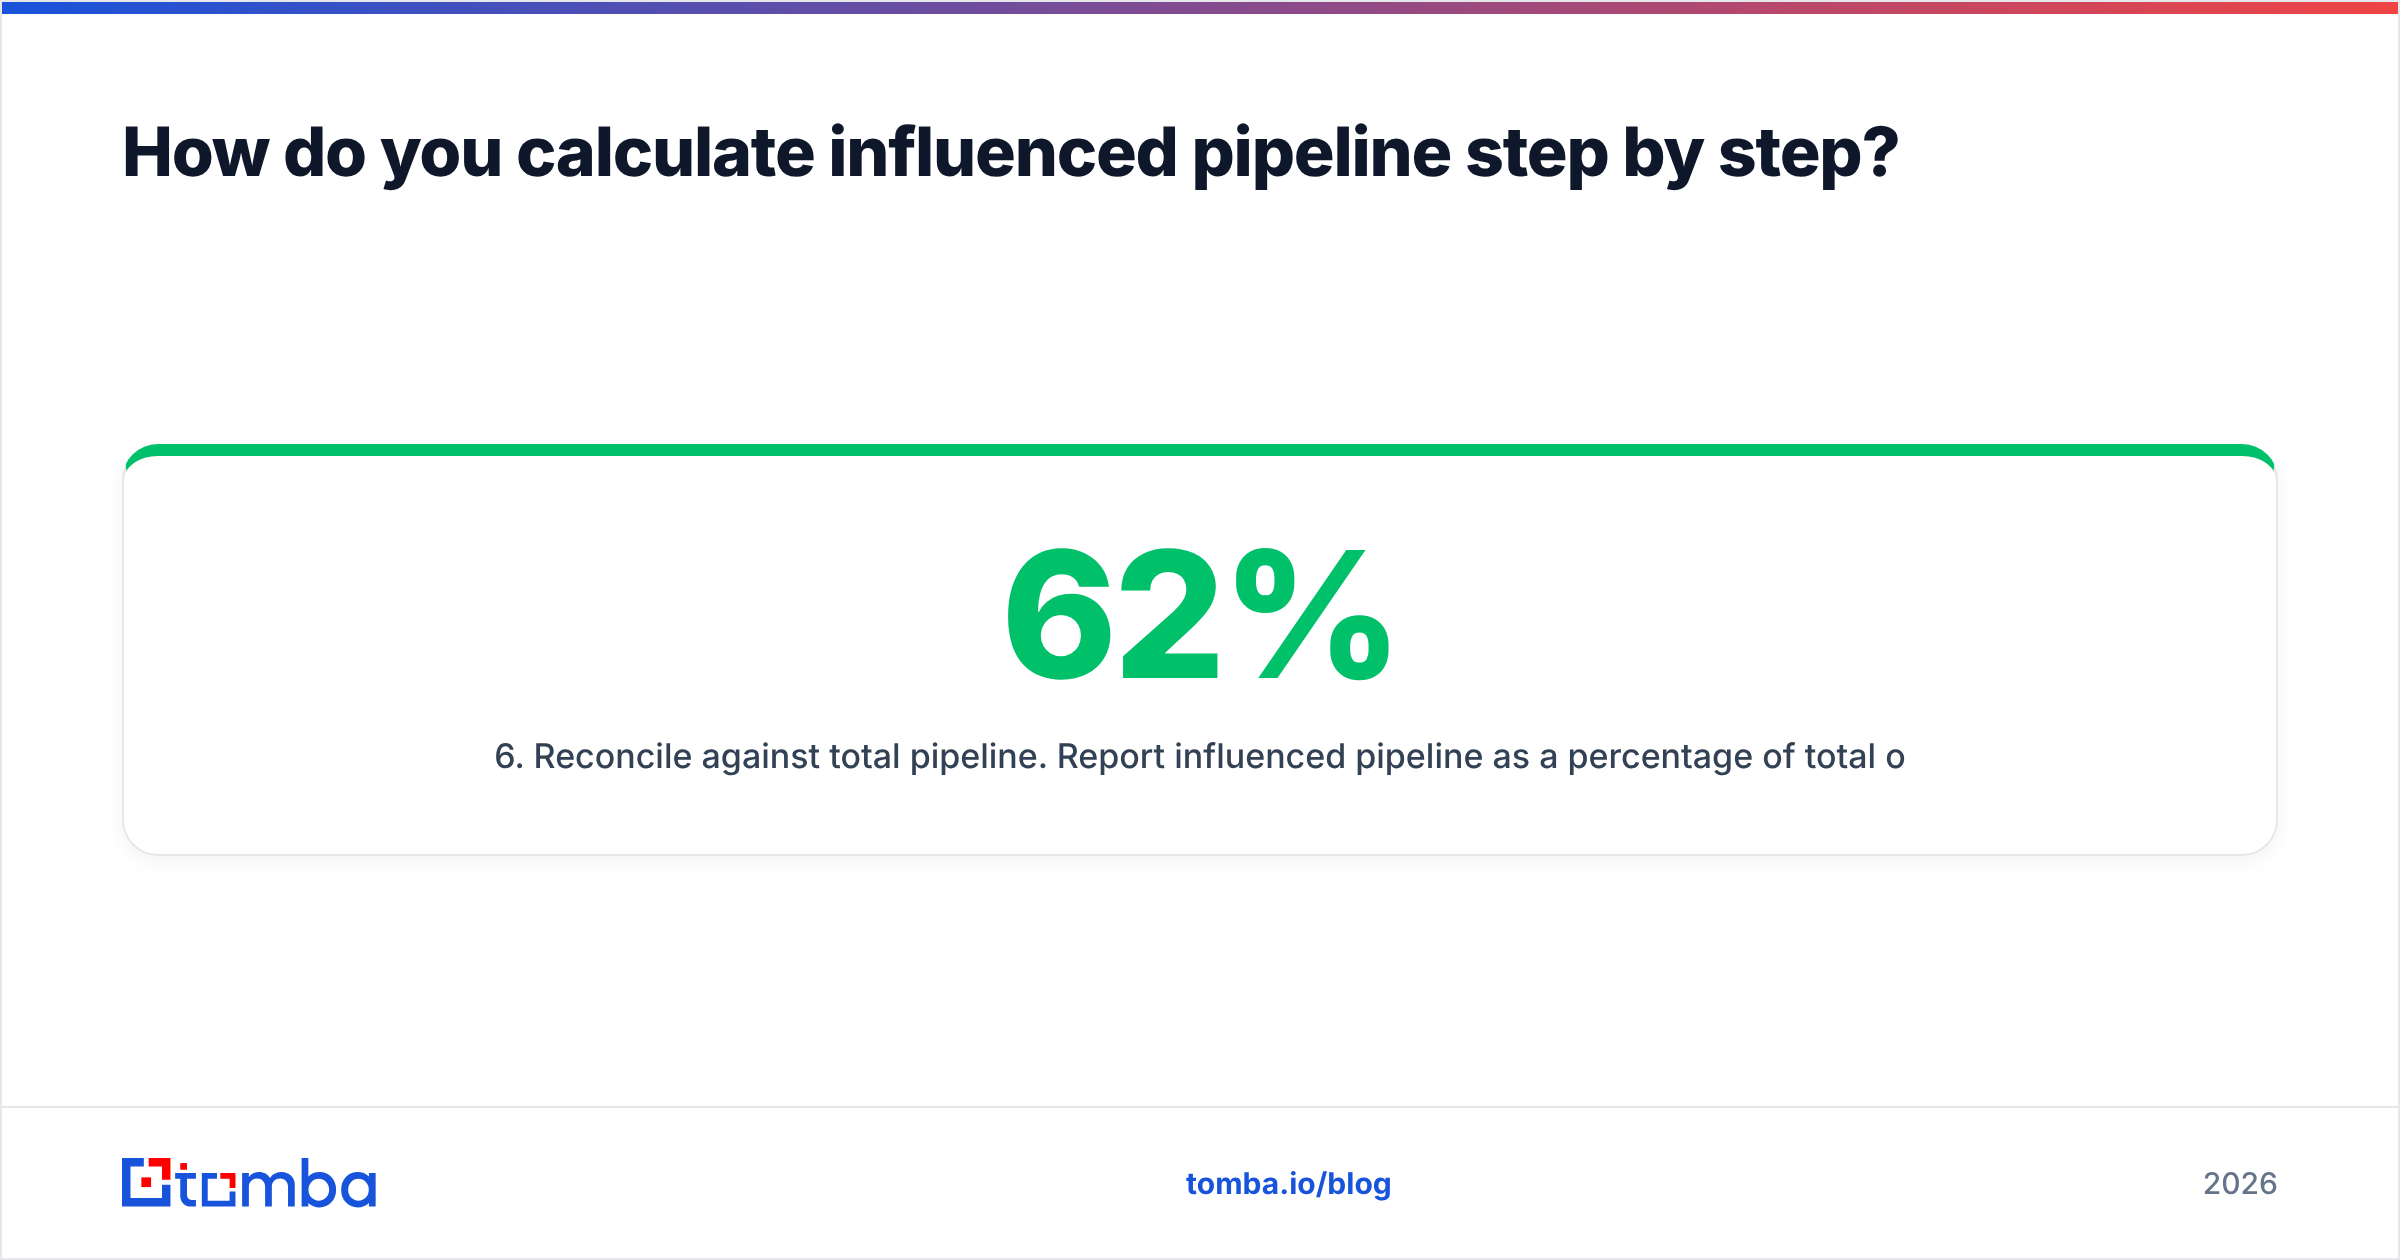
- Reconcile against total pipeline. Report influenced pipeline as a percentage of total open pipeline, never as a raw dollar figure that could exceed the total. "62% of open pipeline touched a marketing program" is a sentence a CFO can evaluate. "$14.2M influenced" against $9M total pipeline is a sentence that ends the meeting.
What data quality problems break influenced pipeline before the model does?#
Attribution models get all the attention. Identity resolution does all the damage.
An influence event is only counted if the system can answer: which person did this, and which account do they belong to? When contact records are stale, duplicated, or missing an email address, the join fails silently. The touch still happened. It just never lands on the opportunity, so your influenced number is understated in ways that are impossible to see from the dashboard.
Three concrete failure modes:
- Missing or invalid work emails. A conference list arrives with names, titles, and companies, but no verified addresses. Those attendees never match to CRM contacts, so an event that genuinely drove three deals shows zero influence. Running the list through an email verifier and appending verified addresses before import fixes the match rate immediately.
- Personal-email signups. Someone registers for a webinar with a Gmail address. Your CRM has their work address. Two records, no link, no influence credit. Reverse lookup and data enrichment can tie the personal identity back to the company domain.
- Job changes. B2B contact data decays roughly 25-30% per year. A champion who moved companies still sits on the old account, so their new-company engagement attaches to the wrong opportunity entirely — which is worse than no attribution, because it is confidently wrong.
Before you argue about W-shaped versus linear, run a match-rate audit. Take last quarter's event and webinar lists and check what percentage successfully resolved to a CRM account. If it is under 70%, your model choice is irrelevant — you are modeling a sample, not a population.
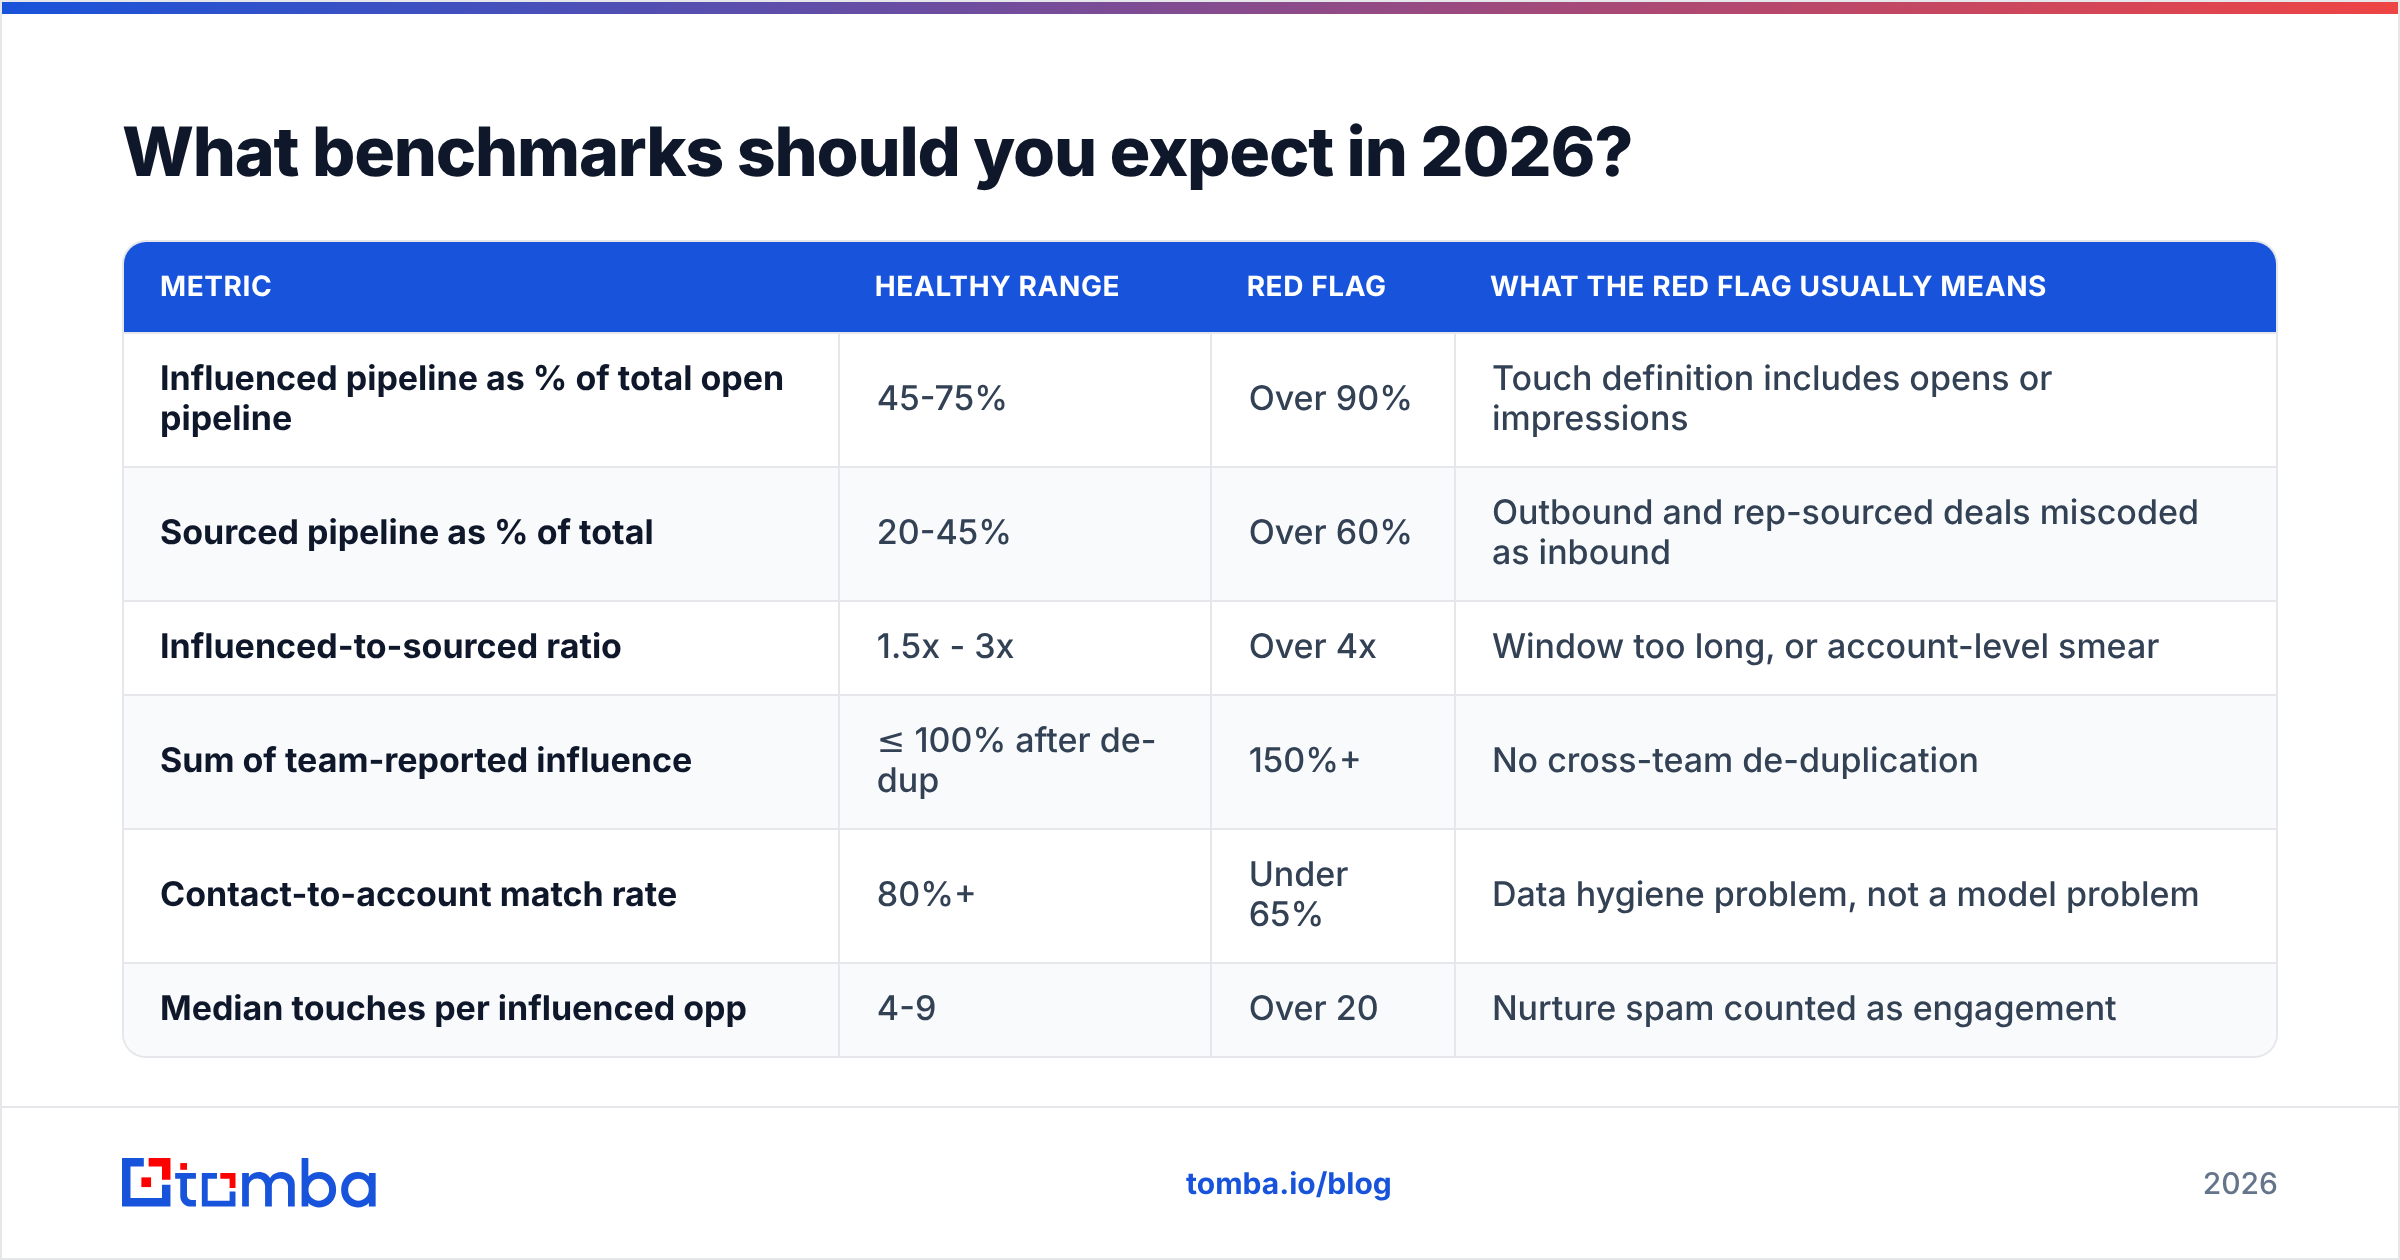
What benchmarks should you expect in 2026?#
Treat these as sanity ranges, not targets. Anything wildly outside them usually indicates a definition problem rather than a performance problem.
| Metric | Healthy range | Red flag | What the red flag usually means |
|---|---|---|---|
| Influenced pipeline as % of total open pipeline | 45-75% | Over 90% | Touch definition includes opens or impressions |
| Sourced pipeline as % of total | 20-45% | Over 60% | Outbound and rep-sourced deals miscoded as inbound |
| Influenced-to-sourced ratio | 1.5x - 3x | Over 4x | Window too long, or account-level smear |
| Sum of team-reported influence | ≤ 100% after de-dup | 150%+ | No cross-team de-duplication |
| Contact-to-account match rate | 80%+ | Under 65% | Data hygiene problem, not a model problem |
| Median touches per influenced opp | 4-9 | Over 20 | Nurture spam counted as engagement |
The ratio row is the one to watch. A 2x influenced-to-sourced ratio says marketing touches roughly twice as much pipeline as it originates — believable for a committee sale. A 6x ratio says your definition of "touch" is doing the heavy lifting.
How do you report influenced pipeline without losing credibility?#
Three rules, and they are mostly about restraint.
Never show influenced pipeline alone. Every slide that contains it must also contain sourced pipeline and total pipeline. The moment influence appears without a denominator, a finance leader assumes inflation — and is usually right.
Publish the definition in the footer. One line: "Influenced = open opps with ≥1 tracked engagement from any account contact within 90 days pre-creation through close. Excludes opens and impressions." That sentence pre-empts 80% of the questions.
Report change, not level. "Influenced coverage moved from 51% to 63% quarter over quarter, driven by the partner webinar series" is a business insight. "$14M influenced" is a number nobody can act on.
If your organization runs a formal attribution report inside a CRM, the vendor documentation is worth reading before you build custom logic — HubSpot's knowledge base and Salesforce both document their native multi-touch models, and knowing what the tool already computes stops you from rebuilding it badly in a spreadsheet.
One last framing note. Influenced pipeline is not a marketing metric — it is a GTM coverage metric. Partner programs, product-led signups, community, and customer marketing all generate influence. If only the demand gen team is measured on it, you have built a scoreboard where one player takes all the shots.
Where does contact data fit into all of this?#
Attribution is a data-join problem wearing a strategy costume. Every model above assumes you can reliably connect a human to a company to an opportunity. That assumption fails quietly and constantly.
If your influenced pipeline numbers look inexplicably low for a channel you know works — or if event lists and webinar exports keep landing in your CRM as unmatched junk — start by fixing identity, not the model. Verified work emails, correct company domains, and current job titles are the raw material every attribution model consumes.
Start with the join, not the model. Use the Tomba Email Finder to resolve names and companies into verified work emails before they hit your CRM, so event lists, webinar exports, and partner-sourced contacts actually match the accounts they belong to. The free tier gives you 25 searches a month to test match rates on a real list; paid plans start at $49/mo, and you can review the full Tomba pricing breakdown before committing. Clean the join first — the attribution argument gets a lot shorter once everyone is looking at the same accounts.
Related guides#
// get started
Find, verify and enrich your first contacts today
Start on the free plan with 25 searches a month, then scale when your team is ready.
Free plan · No credit card required · GDPR & CCPA
// about the author