Inside Sales KPIs: The 12 Metrics That Actually Drive Revenue
Most inside sales dashboards track 30 metrics and explain nothing. This guide cuts the list to 12 KPIs that actually predict quota attainment, with 2026 benchmarks, formulas, and the data-quality metrics almost every team forgets.
TL;DR
- Most inside sales teams track 25-40 metrics and can't tell you which three move revenue. Twelve is enough.
- Split your KPIs into three layers — activity, conversion, and outcome — and manage coaching at the conversion layer, not the activity layer.
- Activity volume is the least predictive KPI on your dashboard. Connect rate and meeting-to-opportunity conversion are the most predictive.
- Data quality KPIs (bounce rate, contact accuracy, enrichment coverage) silently cap every other number you track. Fix them first.
- Benchmarks below are directional ranges for 2026 B2B SaaS and services teams — use them to spot outliers, not to set quotas.
What Are Inside Sales KPIs, Exactly?#
Inside sales KPIs are the measurable indicators that tell you whether a remote-selling team is generating pipeline efficiently — not just whether reps are busy.
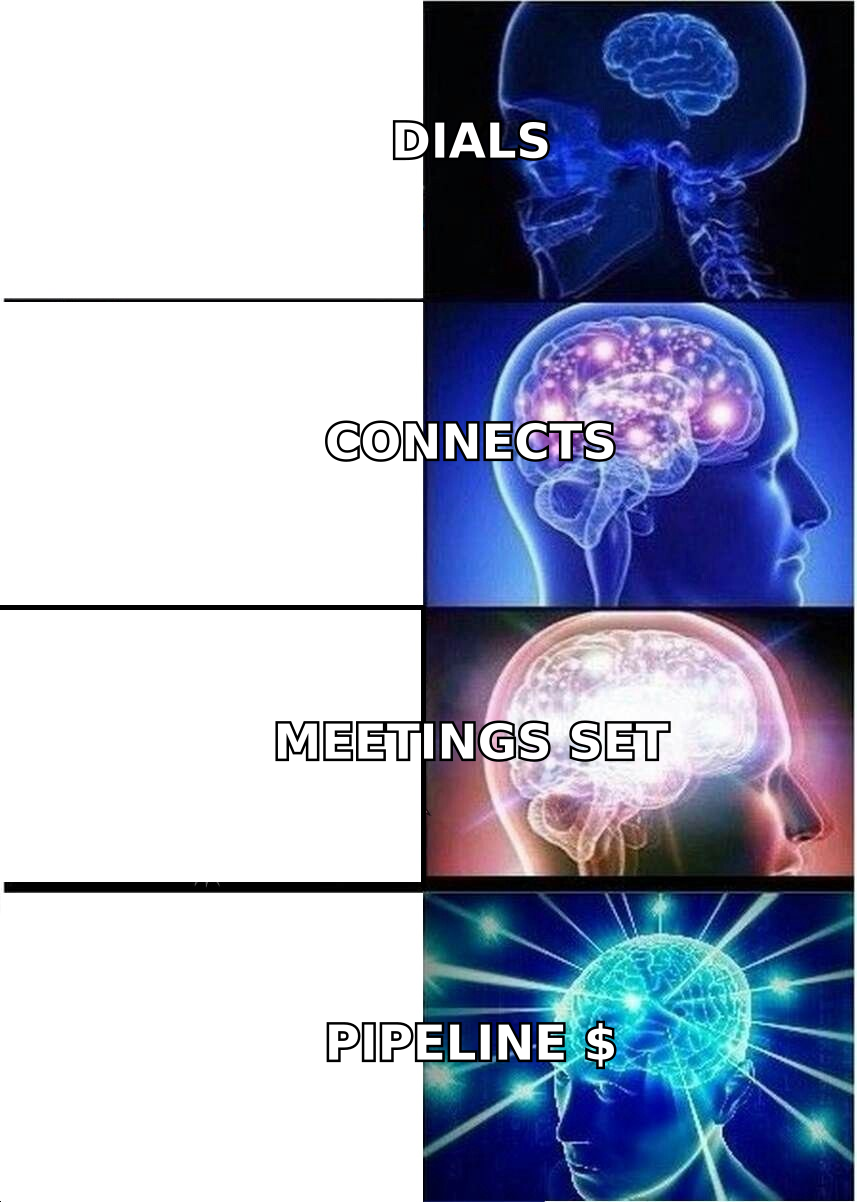
The distinction matters because inside sales is a volume game wrapped around a conversion game. A rep who makes 120 dials a day and books two meetings is worse than a rep who makes 45 dials and books five. The first rep looks better on every activity dashboard ever built. That's the trap.
A useful KPI set has four properties:
- It is causal, not correlated. Dials correlate with meetings. Connect rate causes them. Coach the second.
- It is owned by one person. If a KPI depends on marketing, product, and finance simultaneously, no rep can move it, so it isn't a rep KPI.
- It moves within a coaching cycle. A metric that takes two quarters to shift is a board metric, not a weekly one-on-one metric.
- It has a known-good range. Without a benchmark, a number is trivia. "Our connect rate is 8%" means nothing until you know the range is 3-12%.
- It survives contact with bad data. Every downstream KPI inherits the accuracy of your contact list. Measure the input or stop trusting the output.
Teams that get this wrong end up with what Gartner's sales research repeatedly flags: dashboards that report activity faithfully and forecast revenue terribly.
Which Inside Sales KPIs Actually Predict Revenue?#
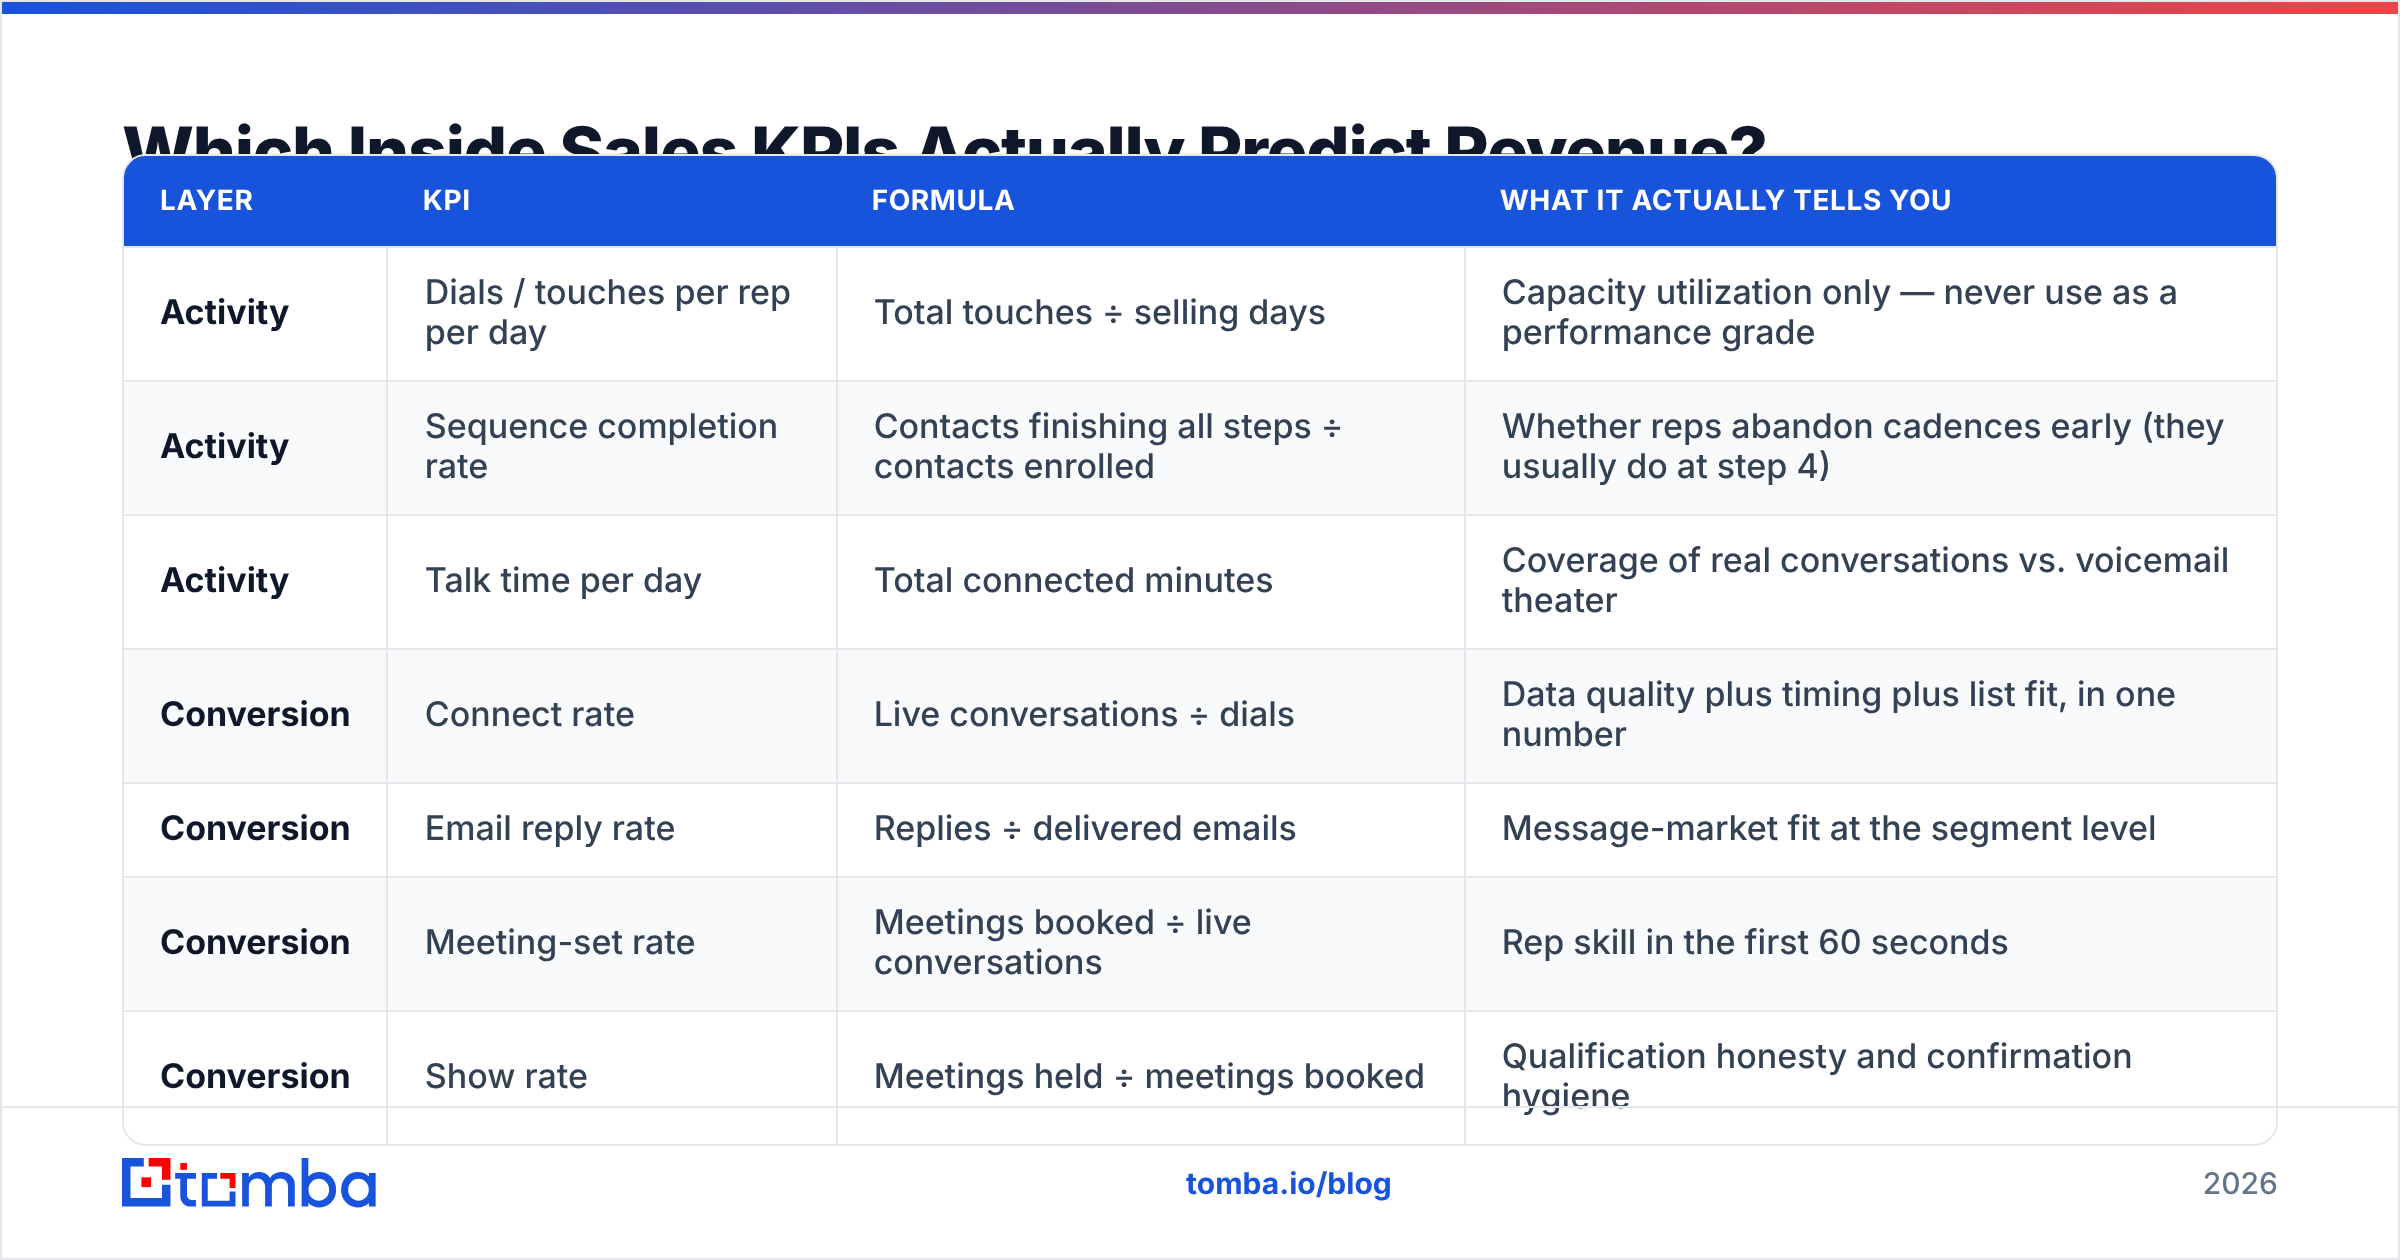
Here are the twelve, organized by layer. Activity KPIs tell you whether the machine is running. Conversion KPIs tell you where it's jamming. Outcome KPIs tell you whether any of it mattered.
| Layer | KPI | Formula | What it actually tells you |
|---|---|---|---|
| Activity | Dials / touches per rep per day | Total touches ÷ selling days | Capacity utilization only — never use as a performance grade |
| Activity | Sequence completion rate | Contacts finishing all steps ÷ contacts enrolled | Whether reps abandon cadences early (they usually do at step 4) |
| Activity | Talk time per day | Total connected minutes | Coverage of real conversations vs. voicemail theater |
| Conversion | Connect rate | Live conversations ÷ dials | Data quality plus timing plus list fit, in one number |
| Conversion | Email reply rate | Replies ÷ delivered emails | Message-market fit at the segment level |
| Conversion | Meeting-set rate | Meetings booked ÷ live conversations | Rep skill in the first 60 seconds |
| Conversion | Show rate | Meetings held ÷ meetings booked | Qualification honesty and confirmation hygiene |
| Conversion | Meeting-to-opportunity rate | Opportunities ÷ meetings held | Whether you're booking the right people |
| Outcome | Pipeline generated per rep | Sum of qualified opp value | The single most defensible AE/SDR scorecard number |
| Outcome | Win rate | Closed-won ÷ closed total | Deal quality and competitive position |
| Outcome | Sales cycle length | Median days, created to closed | Forecast reliability and cash timing |
| Outcome | Cost per opportunity | Fully loaded team cost ÷ opportunities | Whether the motion scales or just spends |
Note what's missing: emails sent, LinkedIn connection requests, tasks completed, CRM notes logged. Those are inputs to inputs. Track them in the tool that generates them and keep them off the dashboard your VP looks at.
What Are Good Benchmarks for Inside Sales KPIs in 2026?#
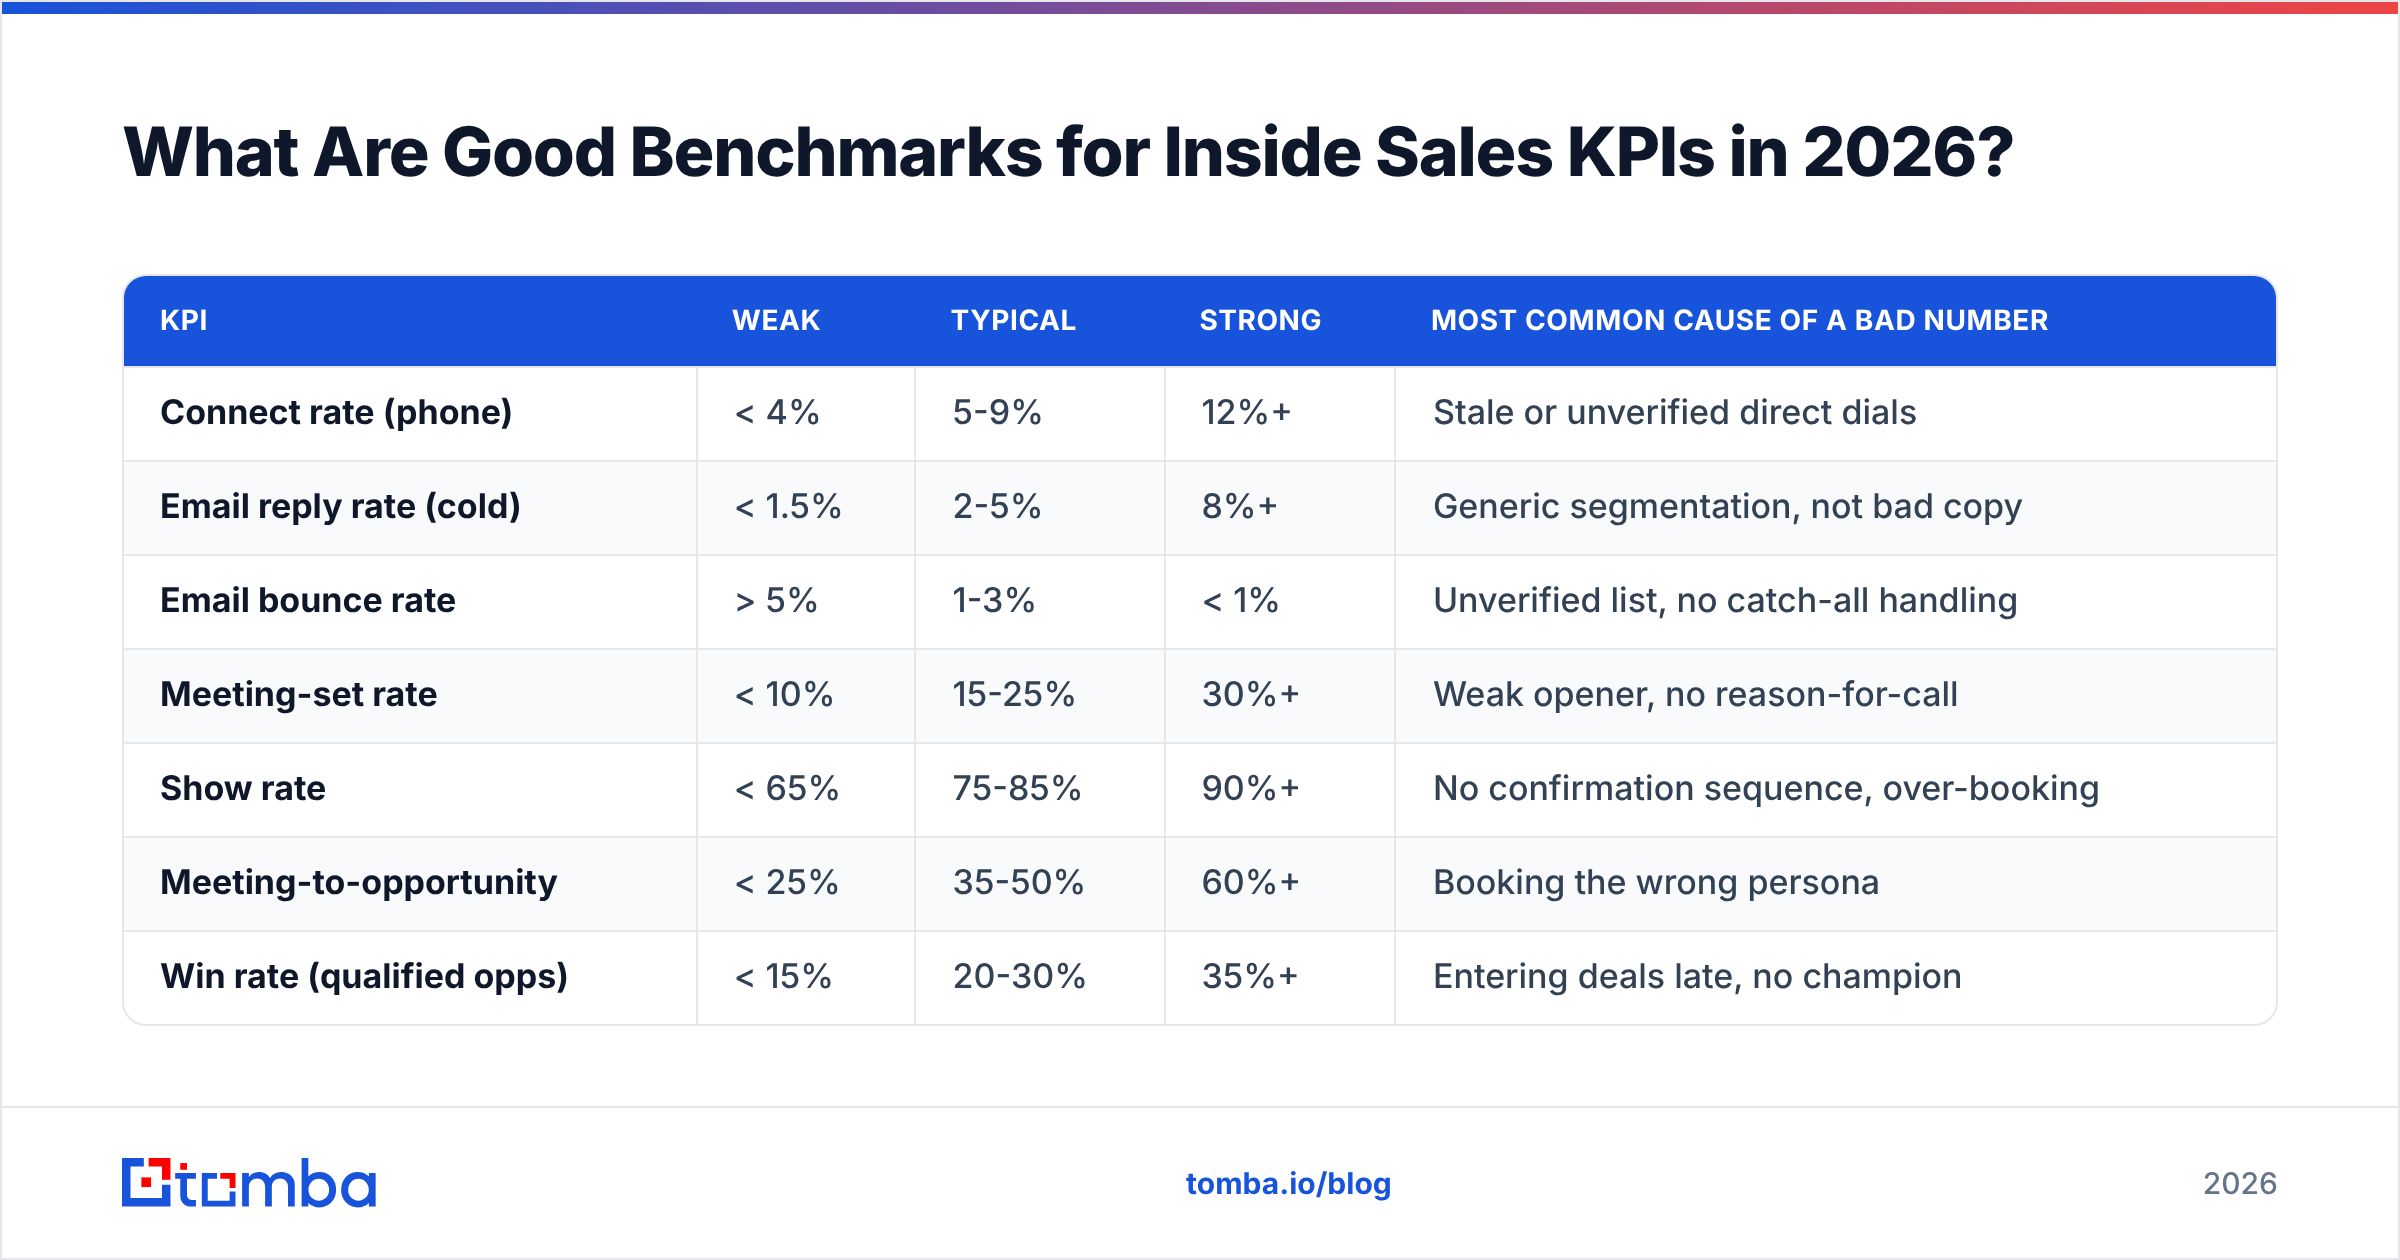
Benchmarks are dangerous when used as targets and useful when used as tripwires. If you're inside the range, stop optimizing and go work on something else. If you're outside it by 2x in either direction, something is structurally wrong — including your measurement definition.
| KPI | Weak | Typical | Strong | Most common cause of a bad number |
|---|---|---|---|---|
| Connect rate (phone) | < 4% | 5-9% | 12%+ | Stale or unverified direct dials |
| Email reply rate (cold) | < 1.5% | 2-5% | 8%+ | Generic segmentation, not bad copy |
| Email bounce rate | > 5% | 1-3% | < 1% | Unverified list, no catch-all handling |
| Meeting-set rate | < 10% | 15-25% | 30%+ | Weak opener, no reason-for-call |
| Show rate | < 65% | 75-85% | 90%+ | No confirmation sequence, over-booking |
| Meeting-to-opportunity | < 25% | 35-50% | 60%+ | Booking the wrong persona |
| Win rate (qualified opps) | < 15% | 20-30% | 35%+ | Entering deals late, no champion |
| Ramp time to full quota | > 6 mo | 3-5 mo | < 90 days | No structured enablement |
Two cautions. First, these ranges compress or stretch by deal size — a $200k ACV motion will show far lower meeting volume and far higher meeting-to-opportunity conversion than a $6k ACV motion. Second, published benchmark sets disagree with each other constantly; HubSpot's sales statistics roundup and Salesforce's State of Sales research both illustrate how much definitions vary between studies. Use one consistent internal definition and trend it against yourself.
Should You Manage to Activity KPIs or Outcome KPIs?#
Neither. Manage to conversion KPIs, and use the other two as guardrails.
Here's the logic. Activity KPIs are fully within rep control but only weakly predictive of revenue. Outcome KPIs are highly predictive but only partially within rep control and far too lagging to coach on — by the time win rate moves, the quarter is over. Conversion KPIs sit in the middle: controllable, leading, and diagnosable.
A practical weekly cadence looks like this:
- Monday (activity guardrail): Is anyone below the floor on touches or talk time? That's an effort or a systems conversation, not a skills one.
- Wednesday (conversion coaching): Pick the single lowest conversion step for each rep and coach only that. If the meeting-set rate is the problem, listen to call openers. If reply rate is the problem, audit the first two lines of the email.
- Friday (outcome review): Pipeline generated, cycle length, cost per opportunity. Roll up, don't coach.
The failure mode is inverting this — reviewing pipeline every Monday and never diagnosing why a rep's connect rate is 3% while the team's is 9%. That gap is almost never effort. It's usually the list.
How Do Data Quality KPIs Silently Cap Everything Else?#
Every conversion KPI on your dashboard has a hard ceiling set by the accuracy of your contact data, and most teams never measure that ceiling.
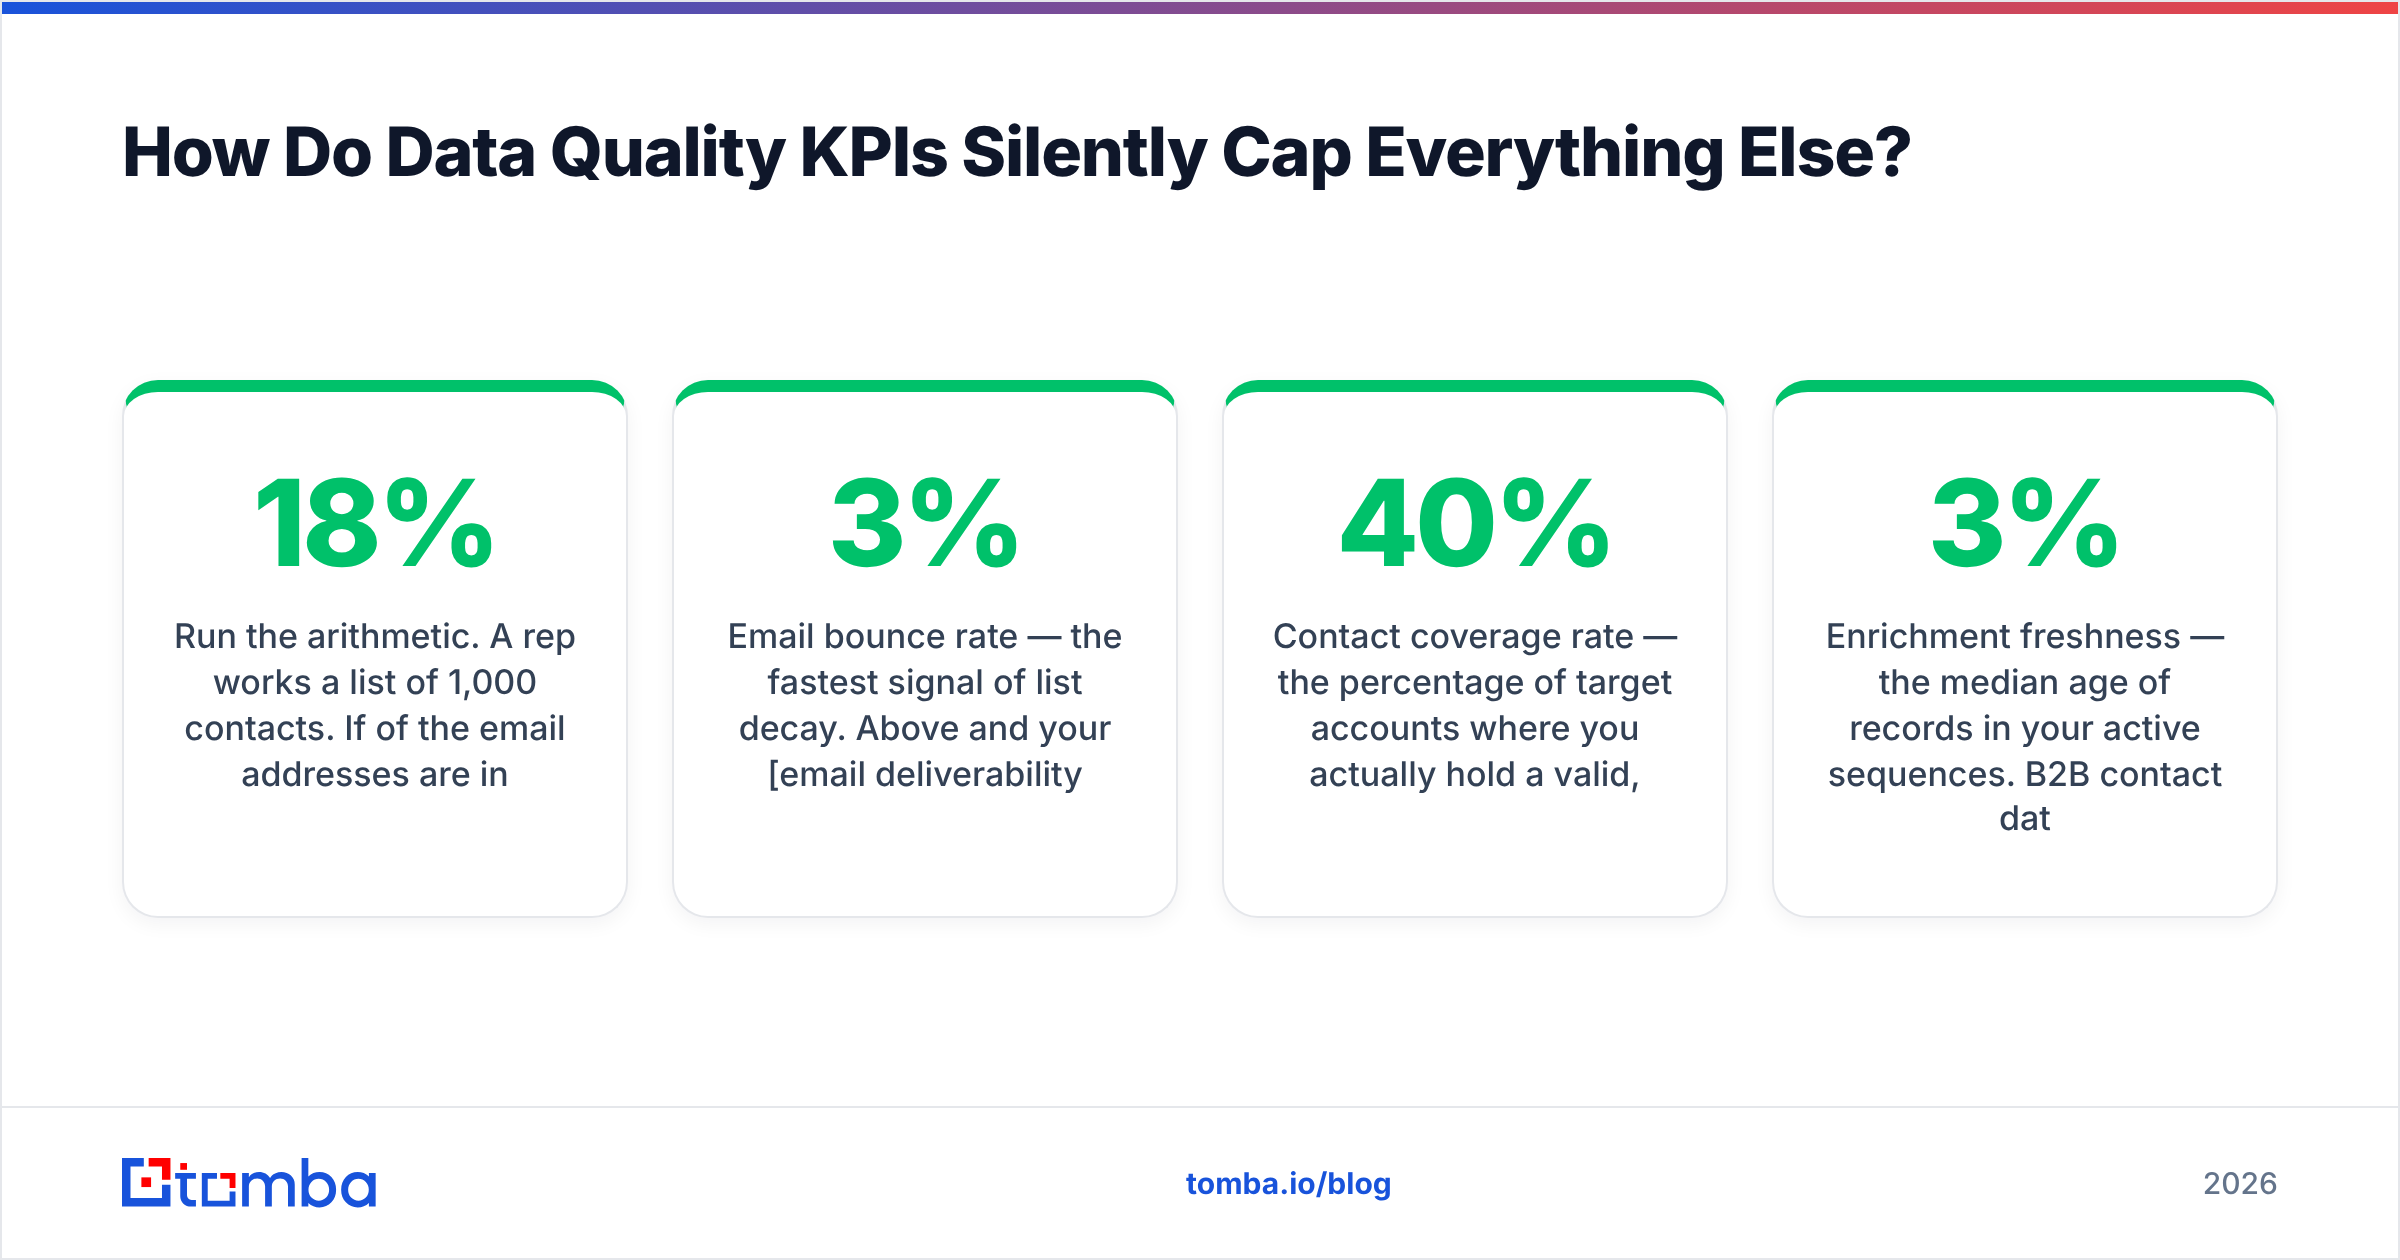
Run the arithmetic. A rep works a list of 1,000 contacts. If 18% of the email addresses are invalid and 25% of the phone numbers are switchboard lines rather than direct dials, that rep is functionally working a list of roughly 600 — while being measured as though they had 1,000. Their reply rate, connect rate, and meeting-set rate all get divided by an inflated denominator. The rep looks lazy. The data is lazy.

So add three input KPIs above the twelve:
- Email bounce rate — the fastest signal of list decay. Above 3% and your email deliverability is already degrading, which suppresses the reply rate of every subsequent campaign. Run lists through an email verifier before enrollment, not after complaints.
- Contact coverage rate — the percentage of target accounts where you actually hold a valid, role-matched contact. If coverage is 40%, your TAM is a story, not a plan. A domain search across target accounts turns that number into something measurable in an afternoon.
- Enrichment freshness — the median age of records in your active sequences. B2B contact data decays roughly 2-3% per month through job changes alone. Records older than 12 months should be re-enriched or retired.
These three are not "ops metrics." They belong on the sales dashboard because they explain variance the sales dashboard otherwise attributes to rep quality.
How Do You Build an Inside Sales KPI Dashboard That People Use?#
Start with three screens, not one.
Screen 1 — Rep view (daily). Five numbers maximum: touches, connect rate, meetings set, show rate, pipeline created this month. Anything more and reps stop opening it.
Screen 2 — Manager view (weekly). The full conversion funnel with rep-level variance highlighted. The job of this screen is to answer one question: where in the funnel is this rep losing the most relative to the team median?
Screen 3 — Leadership view (monthly). Pipeline generated, cost per opportunity, win rate, cycle length, ramp time, and the three data-quality inputs. No activity metrics at all.
Three design rules that prevent dashboard rot:
- One definition, written down. "Meeting held" means attended for eight minutes or more with a qualified contact. Write it in the field description in your CRM so nobody relitigates it in QBR.
- Show variance, not just values. A 22% meeting-set rate is meaningless. "22% vs. team median 27%, down from 29% last month" is coachable.
- Kill any metric nobody has referenced in 60 days. Dashboards accumulate. Prune them on a schedule.
What Inside Sales KPIs Should You Stop Tracking?#
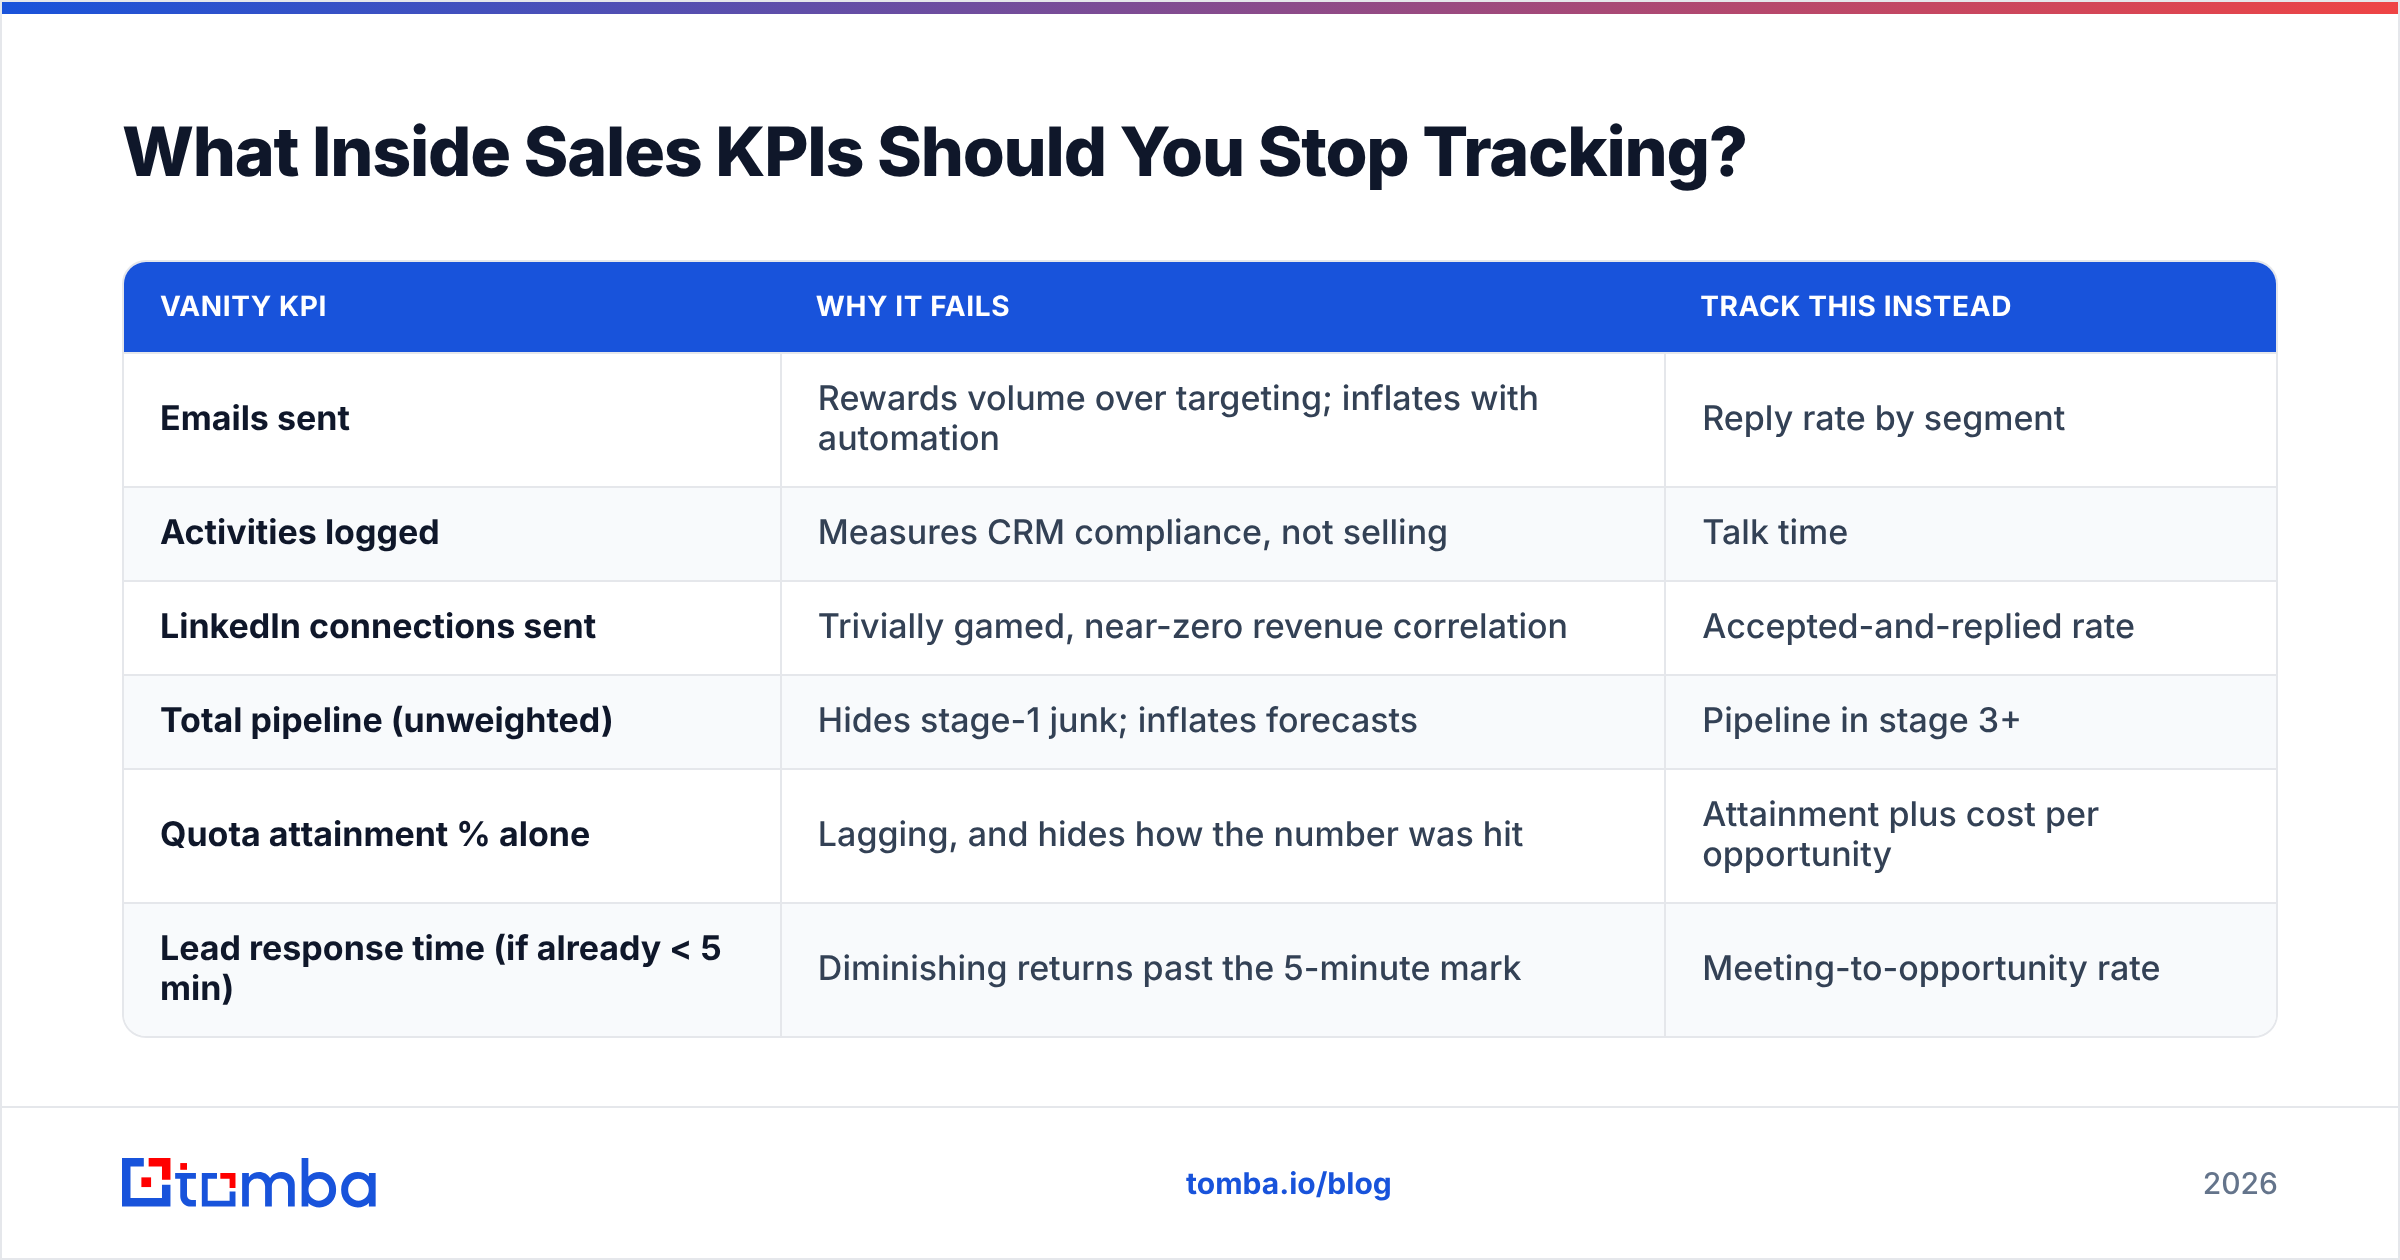
Cut these and nothing bad happens:
| Vanity KPI | Why it fails | Track this instead |
|---|---|---|
| Emails sent | Rewards volume over targeting; inflates with automation | Reply rate by segment |
| Activities logged | Measures CRM compliance, not selling | Talk time |
| LinkedIn connections sent | Trivially gamed, near-zero revenue correlation | Accepted-and-replied rate |
| Total pipeline (unweighted) | Hides stage-1 junk; inflates forecasts | Pipeline in stage 3+ |
| Quota attainment % alone | Lagging, and hides how the number was hit | Attainment plus cost per opportunity |
| Lead response time (if already < 5 min) | Diminishing returns past the 5-minute mark | Meeting-to-opportunity rate |
One nuance on the last row: response time matters enormously going from hours to minutes, and almost not at all going from five minutes to two. Once you're under five, stop optimizing it and move budget to list quality.
How Long Before New KPIs Change Behavior?#
Expect roughly one full sales cycle plus 30 days. Conversion KPIs start shifting within two to three weeks of focused coaching because they're behavioral. Outcome KPIs — win rate, cycle length, cost per opportunity — won't move meaningfully until deals created under the new regime have closed.
That lag is why teams abandon KPI programs in week six, right before the data would have validated them. Set the review horizon before you launch, and don't renegotiate it mid-quarter.
A reasonable rollout sequence:
- Weeks 1-2: Fix definitions and clean the contact database. Measure bounce rate and coverage before touching anything else.
- Weeks 3-4: Instrument the conversion funnel. Accept that the first two weeks of data will be noisy.
- Weeks 5-8: Coach to the single weakest conversion step per rep.
- Week 9+: Review outcome KPIs and adjust targets. Only now are the numbers trustworthy.
Where Should You Start This Week?#
Pick one KPI: connect rate or bounce rate. Both are input metrics, both are fixable in days rather than quarters, and both lift every downstream number automatically.
If your bounce rate is above 3% or your reps are burning half their calling block on switchboard numbers, the bottleneck isn't coaching — it's the list. Accurate, verified contact data is the cheapest KPI improvement available to an inside sales team, because it raises the denominator problem for every rep at once.
That's the gap Tomba's Email Finder is built to close: find and verify role-matched business emails by name, domain, or company before they ever enter a sequence, so your connect and reply rates reflect rep skill instead of data decay. Start on the free tier (25 searches a month) to audit a sample of your current list, then scale on Starter at $49/month or Growth at $99/month — full Tomba pricing is public. Verify the list first. Then argue about the dashboard.
Related guides#
// get started
Find, verify and enrich your first contacts today
Start on the free plan with 25 searches a month, then scale when your team is ready.
Free plan · No credit card required · GDPR & CCPA
Get the Tomba newsletter
Product and data updates
// about the author