Inside Sales Metrics: The 14 KPIs That Actually Predict Revenue
Most inside sales dashboards track motion, not money. Here are the 14 inside sales metrics that actually correlate with closed revenue, the formulas behind them, 2026 benchmarks, and the data-quality checks that keep the numbers honest.
TL;DR
- Most inside sales dashboards count motion: dials, emails sent, tasks closed. Only four things move revenue. Reach rate, qualified conversion, cycle time, and win rate.
- Track 14 inside sales metrics, not 40. Sort them into activity, efficiency, and outcome tiers. Then you know which number to pull when a quarter goes sideways.
- Activity metrics are clues, never targets. The moment "200 dials/day" becomes a quota, reps chase the counter and your data gets worse.
- Contact data quality is a metric too. A 22% bounce rate quietly drags down every other number on your board.
- Review weekly by cohort, monthly by rep, quarterly by model. Mixing those cycles is how teams end up coaching noise.
What are inside sales metrics?#
Inside sales metrics are the numbers that track how a remote sales team works and what it closes. They run from dials per rep to pipeline speed to the revenue you keep. "Inside sales" just means selling without flying anywhere. Phone, email, video, chat, LinkedIn. Since 2020, that is how most B2B teams sell. So inside sales metrics are now the default way to measure a sales org, not a niche one.
Here is the problem worth naming up front. Inside sales throws off a huge amount of data. Every dialer logs talk time. Every sequencer logs opens. Every CRM logs stage changes. All that data feels like measurement. But you end up with a 40-tile dashboard, and nobody can say which tile predicts next quarter.
Think of a car dashboard. You steer by four gauges: speed, fuel, engine heat, and oil pressure. The rest matters once in a while, when something breaks. A dashboard that shows all 40 gauges at the same size is not richer. It is worse.
Which inside sales metrics actually predict revenue?#
Six groups of inside sales metrics carry almost all of the signal. The rest are drill-downs on one of them.
Reach rate (connect + reply) — the share of target contacts who give you a human response, on any channel. This is your best early warning. It slips 30 to 60 days before pipeline does.
Qualified conversion rate — meetings held that turn into a real opportunity. It tells "my calendar is full" apart from "my calendar is full of the right people." High reach with low conversion means your targeting is off, not your pitch.
Sales cycle length by segment — median days from new deal to closed-won, split by deal size. Averages lie here. One 400-day whale will skew a mid-market average. Use the median.
Win rate by stage entered — not overall win rate, which blends junk leads with real deals. Count from the first stage where a buyer admits a problem. This number shows whether your team can sell, not just whether it can make noise.
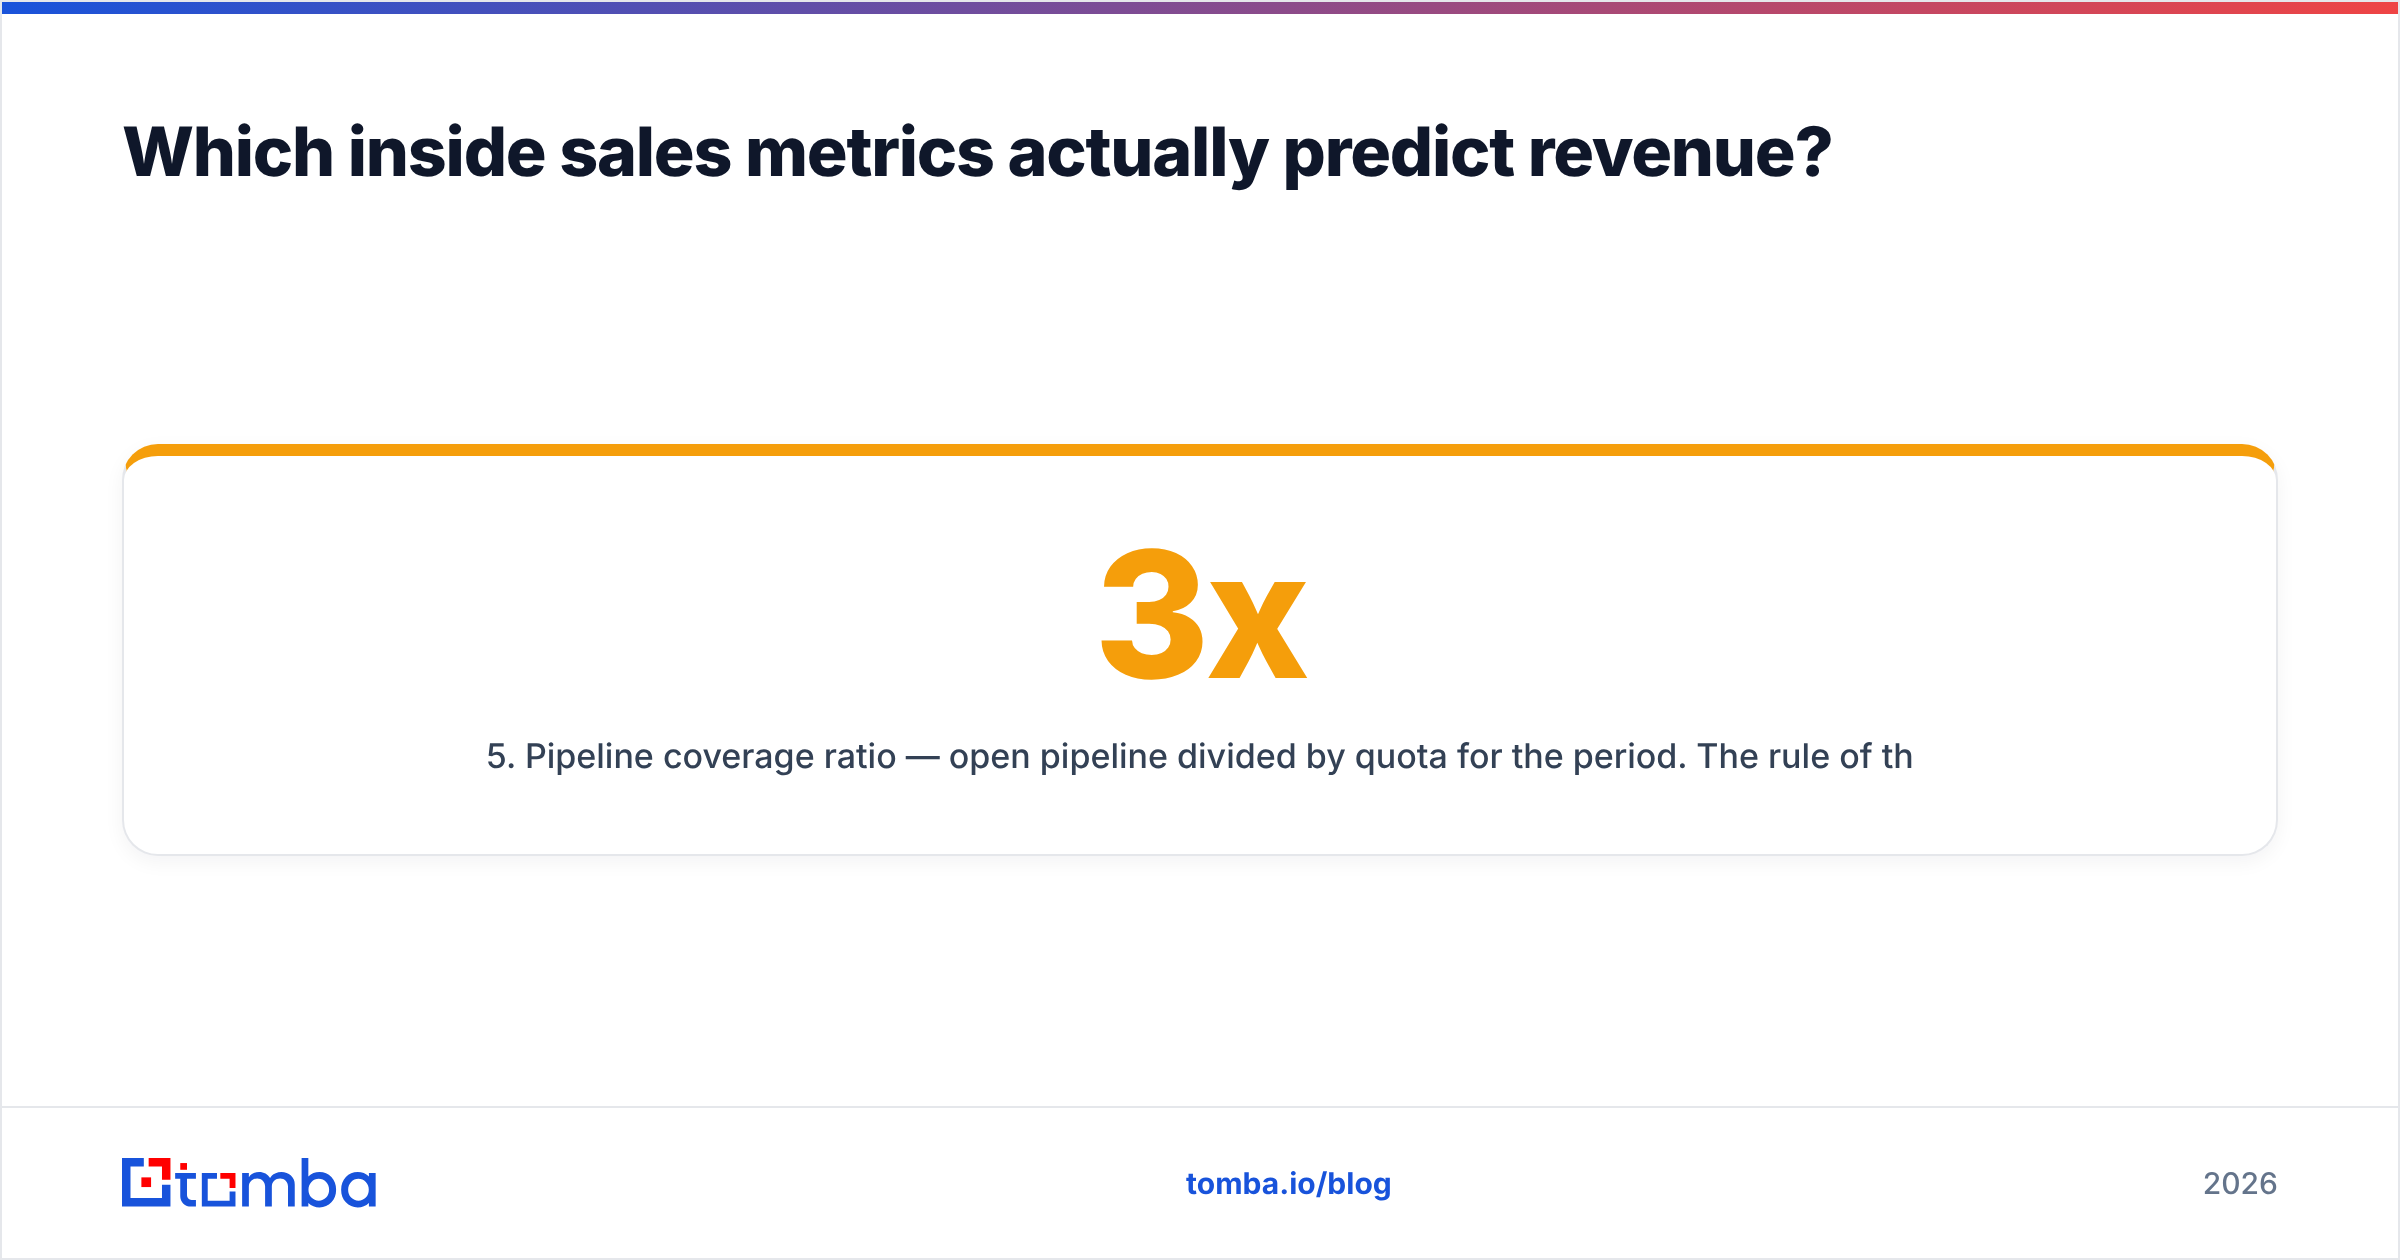
Pipeline coverage ratio — open pipeline divided by quota for the period. The 3x rule is folklore. Do the math on your own win rate. Close 25% and you need 4x. Close 40% and 2.5x is plenty, so chasing 3x just burns rep hours.
Contact data accuracy — the share of your outbound list with a live email and a current job title. Most teams never track it. Then they wonder why reach rate fell 8 points, when the real cause was a stale list.
What does the full inside sales metrics list look like?#
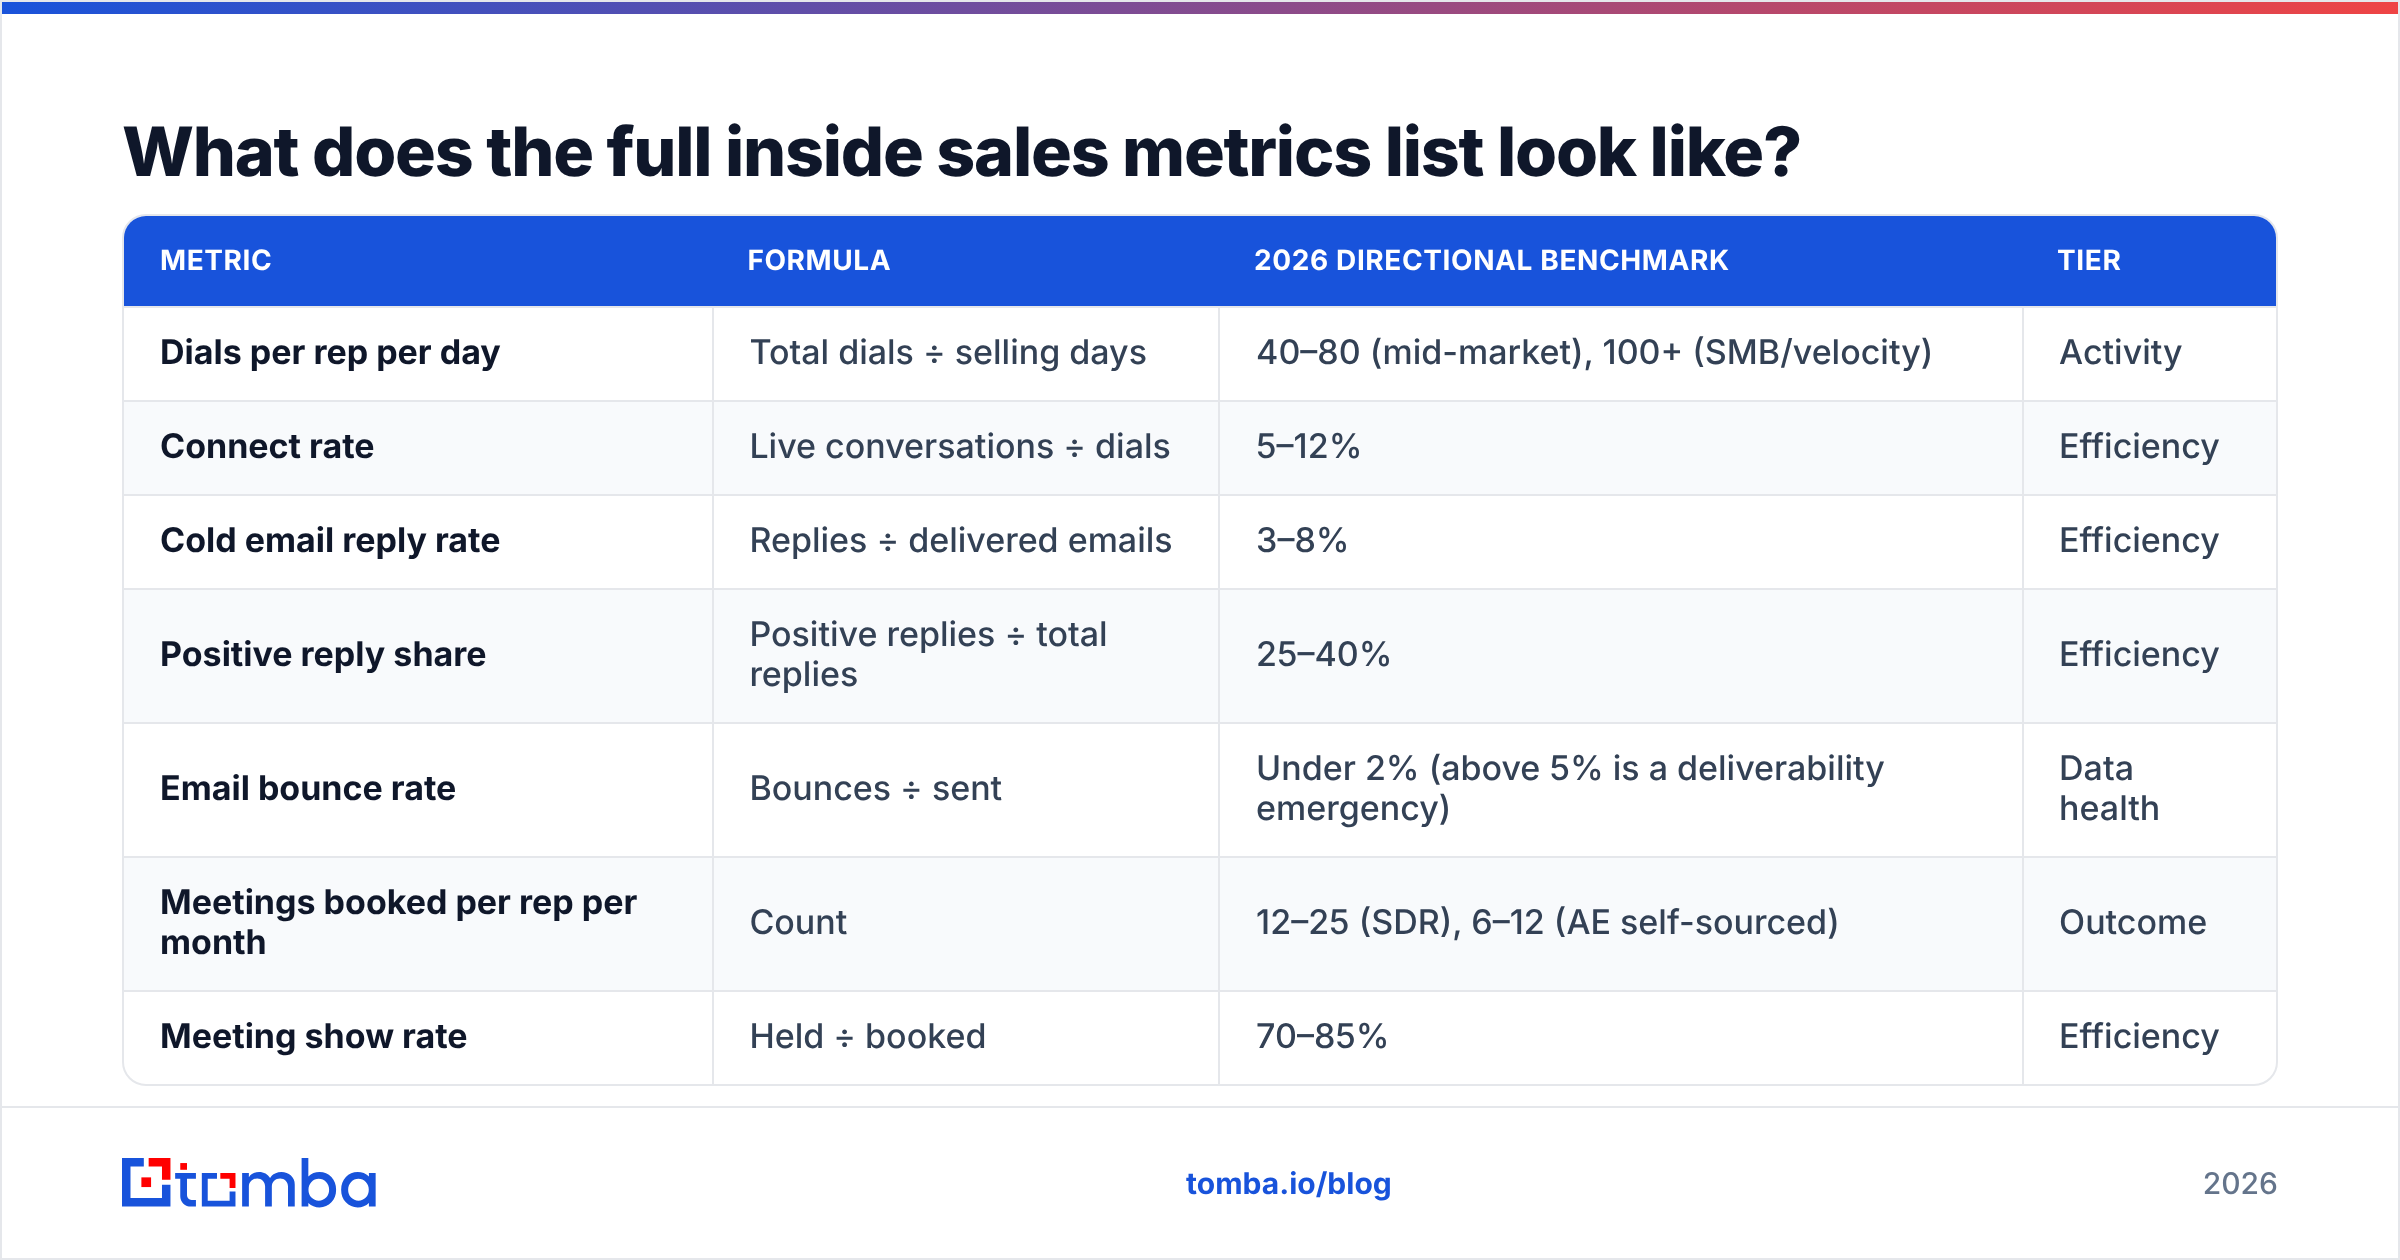
Here are all 14, grouped by tier. The 2026 numbers are rough ranges drawn from public B2B SaaS reports and vendor data. Treat them as sanity checks, not goals. Your deal size, ICP, and channel mix will move every one of them.
| Metric | Formula | 2026 directional benchmark | Tier |
|---|---|---|---|
| Dials per rep per day | Total dials ÷ selling days | 40–80 (mid-market), 100+ (SMB/velocity) | Activity |
| Connect rate | Live conversations ÷ dials | 5–12% | Efficiency |
| Cold email reply rate | Replies ÷ delivered emails | 3–8% | Efficiency |
| Positive reply share | Positive replies ÷ total replies | 25–40% | Efficiency |
| Email bounce rate | Bounces ÷ sent | Under 2% (above 5% is a deliverability emergency) | Data health |
| Meetings booked per rep per month | Count | 12–25 (SDR), 6–12 (AE self-sourced) | Outcome |
| Meeting show rate | Held ÷ booked | 70–85% | Efficiency |
| Meeting-to-opportunity rate | Qualified opps ÷ meetings held | 40–60% | Outcome |
| Opportunity win rate | Won ÷ (won + lost) | 18–30% | Outcome |
| Median sales cycle | Median days, created to closed-won | 30–90 days (mid-market SaaS) | Efficiency |
| Average deal size (ACV) | Total won ACV ÷ deals won | Segment-dependent | Outcome |
| Pipeline coverage | Open pipeline ÷ quota | 3x–4x | Outcome |
| Quota attainment | Closed ÷ quota | 55–70% of reps at or above | Outcome |
| Ramp time to full productivity | Months to first full-quota quarter | 3–6 months | Enablement |
Fourteen is not a magic number. But it is close to the most a manager can hold in their head during a pipeline review. Past that, people stop reading the dashboard. They just ask "so what's the number?" in Slack, which is a reliable sign that your reporting has failed.
How do activity metrics and outcome metrics differ?#
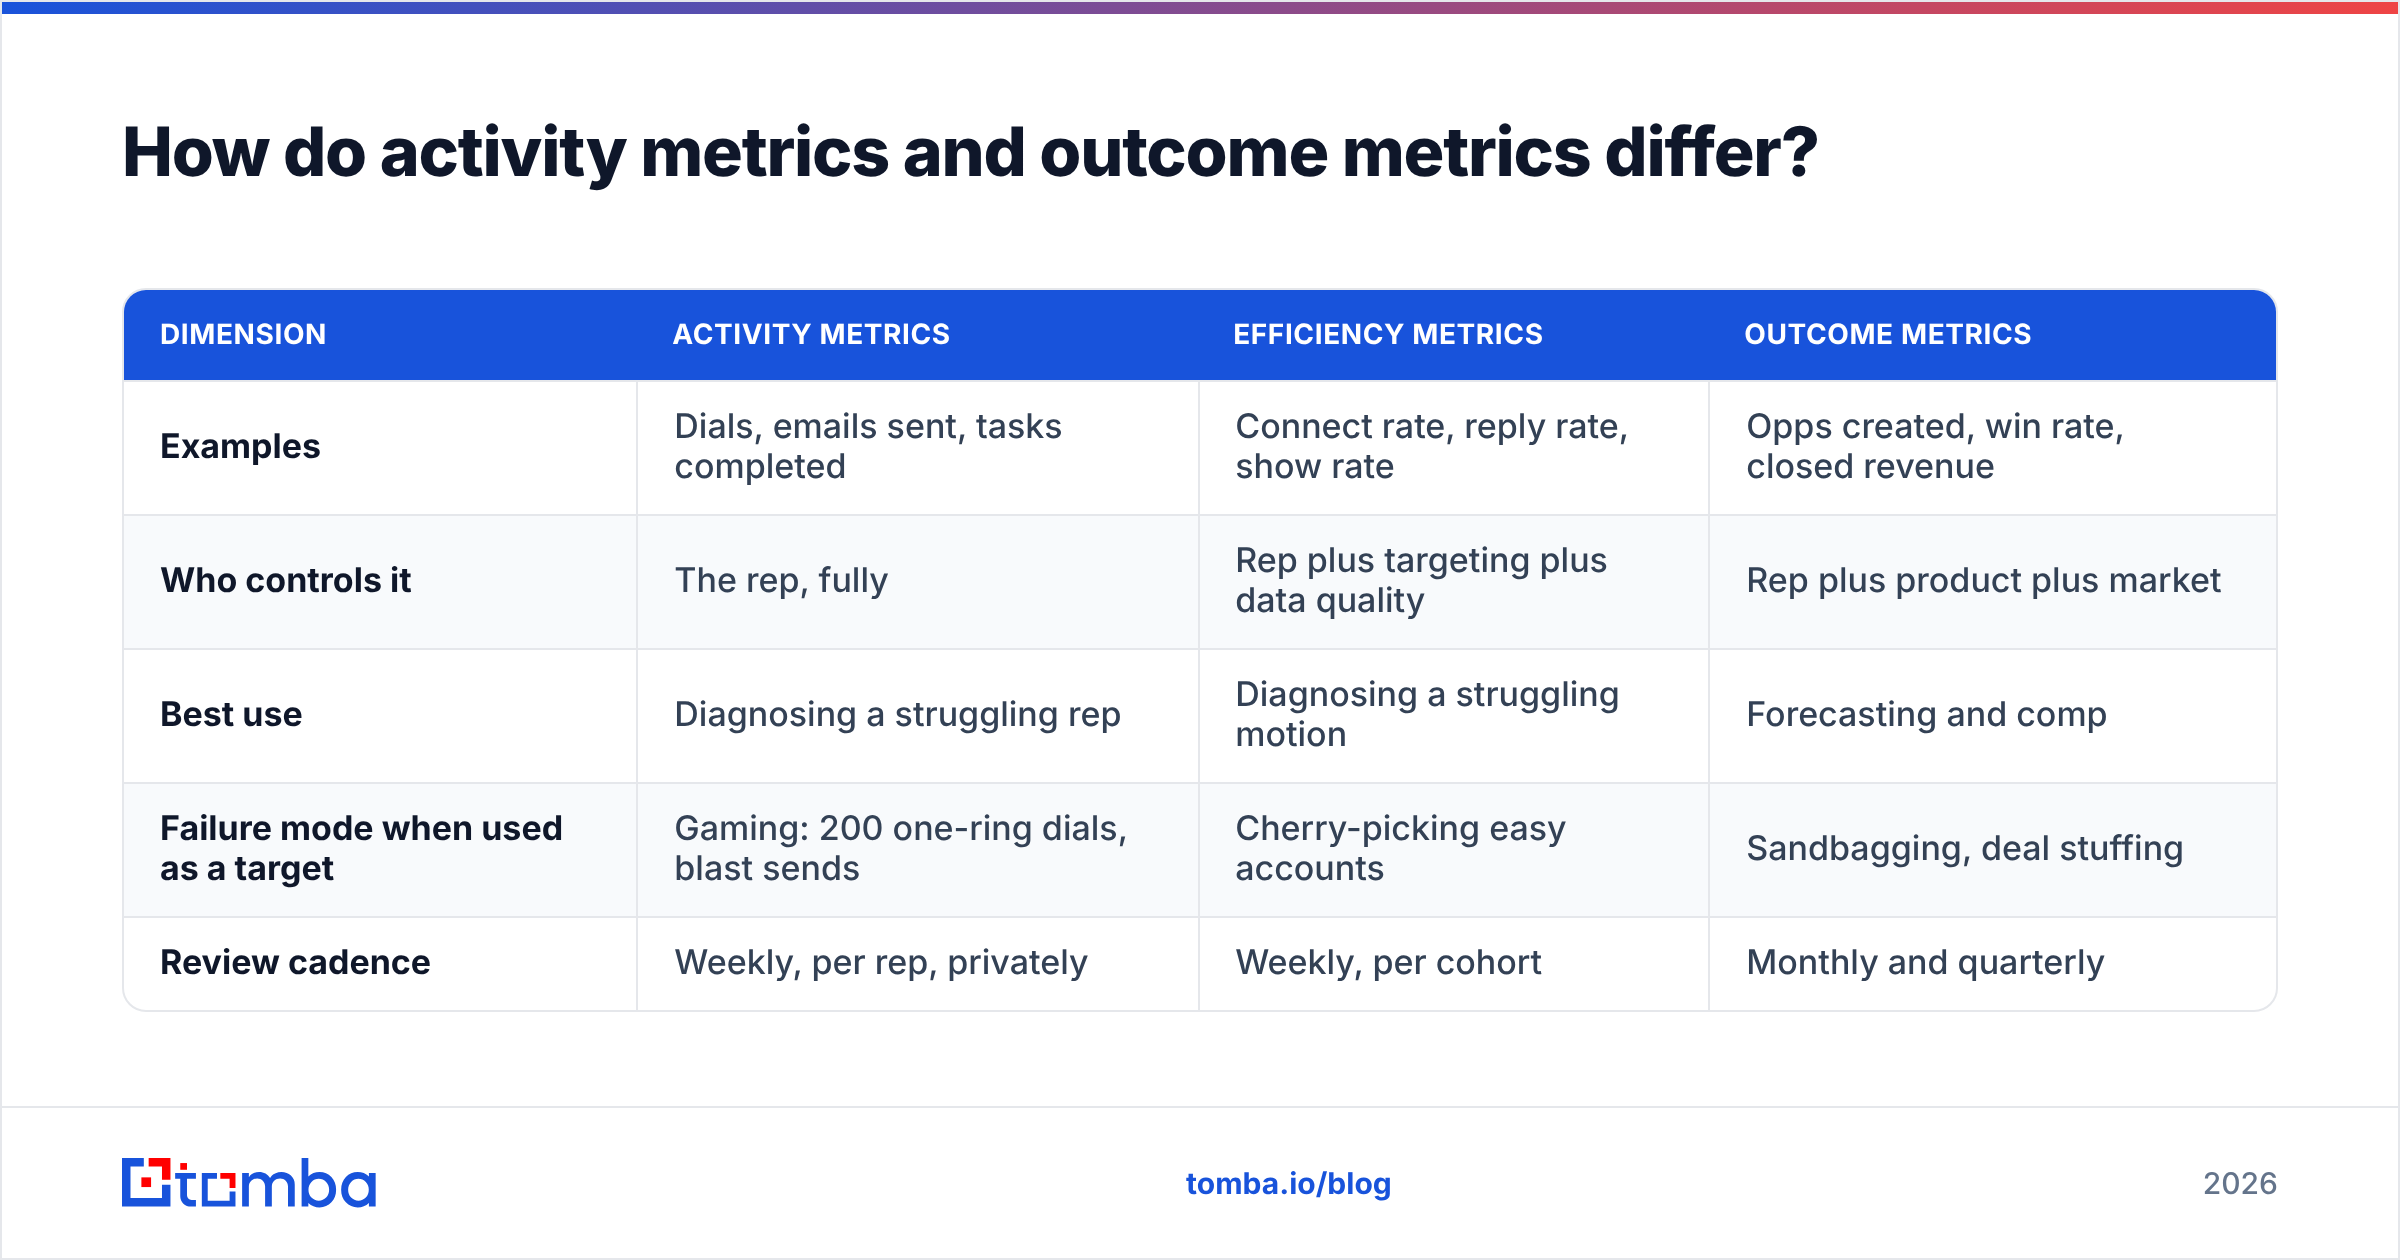
These 14 inside sales metrics split into two families. Activity metrics track what reps do. Outcome metrics track what buyers do. Mixing up the two is the most common and most costly mistake in sales management.
| Dimension | Activity metrics | Efficiency metrics | Outcome metrics |
|---|---|---|---|
| Examples | Dials, emails sent, tasks completed | Connect rate, reply rate, show rate | Opps created, win rate, closed revenue |
| Who controls it | The rep, fully | Rep plus targeting plus data quality | Rep plus product plus market |
| Best use | Diagnosing a struggling rep | Diagnosing a struggling motion | Forecasting and comp |
| Failure mode when used as a target | Gaming: 200 one-ring dials, blast sends | Cherry-picking easy accounts | Sandbagging, deal stuffing |
| Review cadence | Weekly, per rep, privately | Weekly, per cohort | Monthly and quarterly |
The rule: never pay on activity, always coach on it. When a rep misses quota, open the activity tier to find out why. When a team hits quota, ignore the activity tier. Goodhart's law is not a theory in sales. Attach money to any activity counter, and within a quarter it stops measuring the thing it was built to measure.
There is a second split: leading versus lagging. Reply rate leads pipeline by weeks. Pipeline leads revenue by one cycle. Revenue leads nothing. It is a report card. If your weekly meeting spends 40 minutes on last week's closed-won number, you are driving by the mirror.
Why do most inside sales dashboards fail?#
Four failure modes turn good inside sales metrics into noise, in rough order of how often they show up.
They show averages, not spread. Say the team's average deal is $24,000. Two reps close $80k logos and six close $9k logos. That average tells you nothing you can act on. Use medians and quartiles. A metric that hides spread hides your whole coaching plan.
They drop the denominator. "We booked 90 meetings" means nothing without "from 4,200 contacts." The rate is the story. Volume is just one input. Teams that report raw counts solve every problem by hiring, because a count only responds to more bodies.
They treat CRM stage data as truth. Stage data is typed in by the same people who get graded on it. Expect optimism. Check it against hard signals: meetings actually held, email threads with buyer replies, security reviews sent.
They never audit the data layer. This one is invisible. Say 18% of your prospect emails bounce, and another 12% go to people who changed jobs. Your reply rate is not 4%. It is 4% of a broken denominator, and your year-over-year chart is junk. Clean the list before you read any channel metric. A quick pass through an email verifier on your live sequences often explains more than a week of call reviews.

How do you measure data quality as an inside sales metric?#
Data quality belongs on the board with the rest of your inside sales metrics. Treat it like any other KPI. Define it, baseline it, and track it. Four sub-metrics are enough:
Deliverability rate — valid, non-bouncing addresses ÷ total records. Aim above 97% on any list going into a sequence. Check it before you send, because a bounce has already cost you sender trust.
Title currency — the share of contacts whose title matches their real job today. B2B contact data goes stale at roughly 2% to 2.5% a month. That is a quarter of your database each year. Re-enrich every quarter.
Coverage rate — the share of target accounts where you have a live contact at the right level. Low coverage is why "we target 500 accounts" turns into "we email 140 accounts."
Duplicate rate — the same buyer sitting twice across your CRM and sequencer. Duplicates pad activity counts and send one person three sequences. That is how domains get blocked.
The fix is boring and it works. Verify on entry, verify again before each campaign, and enrich on a schedule. Running bulk verify on a list before it hits your sequencer takes minutes. It protects the email deliverability that every other number depends on. If your response rate drops while your data is clean, then it is a messaging problem.
What tools do you need to track inside sales metrics?#
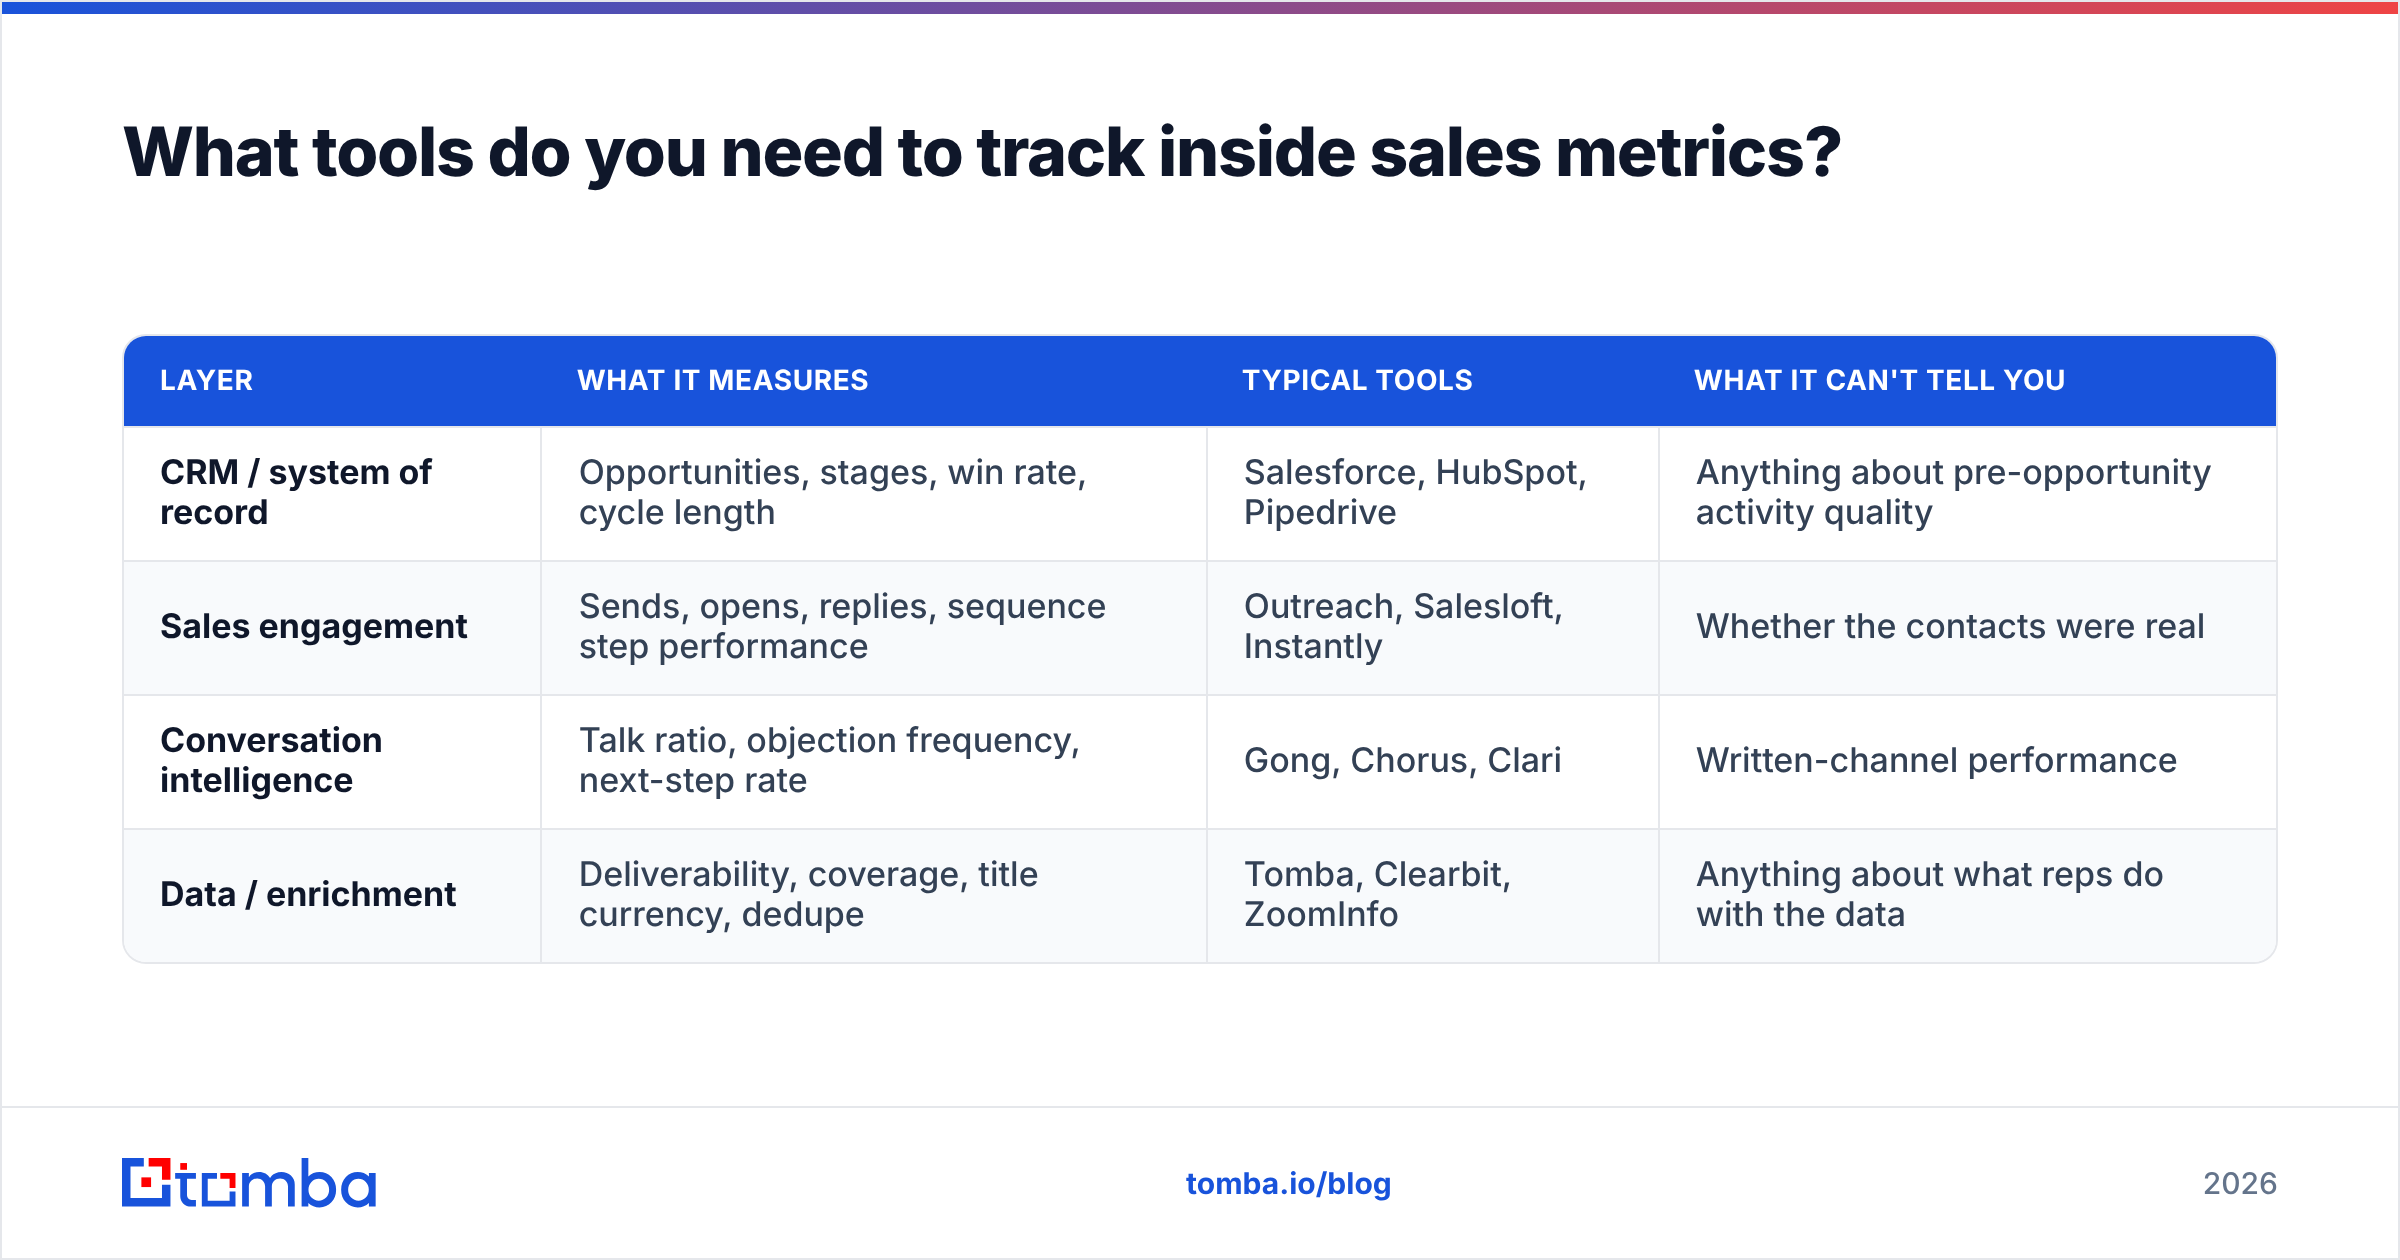
No single tool tracks all 14 inside sales metrics. You need four layers, and most teams over-buy layer two and under-invest in layer four. That is exactly backwards.
| Layer | What it measures | Typical tools | What it can't tell you |
|---|---|---|---|
| CRM / system of record | Opportunities, stages, win rate, cycle length | Salesforce, HubSpot, Pipedrive | Anything about pre-opportunity activity quality |
| Sales engagement | Sends, opens, replies, sequence step performance | Outreach, Salesloft, Instantly | Whether the contacts were real |
| Conversation intelligence | Talk ratio, objection frequency, next-step rate | Gong, Chorus, Clari | Written-channel performance |
| Data / enrichment | Deliverability, coverage, title currency, dedupe | Tomba, Clearbit, ZoomInfo | Anything about what reps do with the data |
One note on tool sprawl. Every layer you add creates one more source of conflicting numbers. Your sequencer says 312 emails sent. Your CRM says 287 logged. Someone will burn a day on that gap. Pick one system as the owner of each metric, and write it down. HubSpot's sales statistics roundup and the category reviews on G2 help you compare the stack itself. Neither one replaces an in-house data dictionary.
How should you run the weekly metrics review?#
Thirty minutes. Three questions, in this order.
1. Did reach rate hold? Look at connect rate and reply rate by cohort: by segment, by sequence, by ICP tier. Not by rep. If a cohort dropped more than 20% week over week, check the list and the sending setup before you question the humans.
2. Is the conversion chain intact? Walk meetings booked → held → qualified → opportunity. One stage will be leaking. Fix that stage only. Teams that attack the whole funnel at once improve nothing they can prove.
3. Does coverage support the forecast? Divide open pipeline by the quota left, then hold it against your own win rate. If coverage is short, the fix is more activity this week, not heroics in week twelve.
Rep-level inside sales metrics belong in one-on-ones, never in the group review. Public activity leaderboards buy a short lift and long-term bad data, because reps learn to make the counter move. Cohort numbers in the group. Individual numbers in private. Model numbers each quarter with your RevOps lead.
One last habit: write down what every metric means, edge cases and all, and version it. When "qualified opportunity" quietly changes meaning in March, your year-over-year chart turns into fiction, and nobody notices for two quarters.
Start with the layer everyone skips#
Metrics only tell the truth when the data under them is true. If your reach rate is soft, do not start with subject lines. Start with how much of your list is deliverable, current, and actually at the accounts you mean to target.
Tomba's Email Finder gives you verified, sourced contact data, so your denominators are real. Find emails by domain or name, verify before you send, and hold bounce rates under the 2% line that protects your sending domain. The free tier includes 25 searches a month, so you can test it on your own list. Paid plans start at $49/mo — see Tomba pricing for the full breakdown. Clean the data layer first. Then your inside sales metrics can be trusted.
Related guides#
// get started
Find, verify and enrich your first contacts today
Start on the free plan with 25 searches a month, then scale when your team is ready.
Free plan · No credit card required · GDPR & CCPA
// about the author